2 3 4 5 6 7 8 9 10 11 12 13 14 15 16 17 18 19 20 21 22 23 24 25 26 27 28 29 30 31 32 33 34 35 36 37 38 39 40 41 42 43 44 45 46 47 48 49 50 51 52 53
55 56 57 58 59 60 61 62 63 64 65 66 67 68 69 70 71 72 73 74 75 76 77 78 79 80 81 82 83 84 85 86 87 88 89 90 91 92 93 94 95 96 97 98 99 100 101 102 103 104 105 106
Deb8: A Tool for Collaborative Analysis of Video
Anonymous Author(s)
ABSTRACT
Public, parliamentary and television debates are common-place in modern democracies. However, developing an un-derstanding and communicating with others is often limited to passive viewing or, at best, textual discussion on social media. To address this, we present the design and implemen-tation of Deb8, a tool that allows collaborative analysis of video-based TV debates. The tool provides a novel UI de-signed to enable and capture rich synchronous collaborative discussion of videos based on argumentation graphs that link quotes of the video, opinions, questions, and external evidence. Deb8 supports the creation of rich idea structures based on argumentation theory as well as collaborative tag-ging of the relevance, support and trustworthiness of the different elements. We evaluated the design of the tool in a study of three groups of three people. We present the results of the study and a reflection on the challenges involved.
CCS CONCEPTS
•Human-centered computing→Synchronous editors;
KEYWORDS
Video analysis, evidence linking, collaborative debate analy-sis, argumentation
ACM Reference Format:
Anonymous Author(s). 2019. Deb8: A Tool for Collaborative Anal-ysis of Video. InProceedings of ACM SIGCHI conference (TVX’19). ACM, New York, NY, USA, 12 pages. https://doi.org/10.475/123_4
1 INTRODUCTION
Broadcast debates are common in modern democracies as a powerful forum to help shape the public’s image of those debating and their arguments. Multiple speakers can present arguments and counter-arguments, opposing views and con-nected arguments each with varying degrees of relevance,
Permission to make digital or hard copies of all or part of this work for personal or classroom use is granted without fee provided that copies are not made or distributed for profit or commercial advantage and that copies bear this notice and the full citation on the first page. Copyrights for components of this work owned by others than the author(s) must be honored. Abstracting with credit is permitted. To copy otherwise, or republish, to post on servers or to redistribute to lists, requires prior specific permission and/or a fee. Request permissions from [email protected]. TVX’19, June 2019, Manchester, United Kingdom
© 2019 Copyright held by the owner/author(s). Publication rights licensed to ACM.
ACM ISBN 123-4567-24-567/08/06...$15.00 https://doi.org/10.475/123_4
valence and trustworthiness. For example, in 2016, over a quarter of the population of the USA watched the final candi-date debate in the presidential election while millions more watched live streams and recordings of the debate.
However, because debates involve people making argu-ments, they are flawed. Untruths, lies or superficial state-ments litter debates. Simple statestate-ments of fact can be open to interpretation and hence support divergent viewpoints in the same debate. For example, “the unemployment rate is at a 10 year low” might support the argument the economy is doing well but if people have stopped looking for work then the economy might actually be worse off! During a debate, statements can be fact checked but if the arguments are based on opinions or the statements require more nu-ance, then it can be difficult to definitively label something as untrue. Moreover, debates are complex multi-faceted events which make it difficult to form an overall picture to make a decision about the opposing arguments.
In the face of this, audiences and the general public have turned to a range of communication technologies to support discussion (e.g., social media). However, many systems are not fit for purpose when it comes to discussing a debate with many arguments, branching to sub-arguments, degrees of relevance in the evidence presented, or requiring the ability to deconstruct opinions. The effort required to discover and weave together the relevant information involved, on even a single debate, is beyond the capacity of an individual.
To overcome the problems inherent in discussing or “debat-ing a debate”, and the weaknesses in the exist“debat-ing approaches we proposeDeb8, a visual language underpinned by a
syn-tactic graph structure [8]. Deb8 is an online system which allows multiple people to collaboratively analyze videos of recorded debates. It supports a structured approach to the collection and linking of information within and around dif-ferent parts of the video. To this end, Deb8 uses an ontology derived from the argumentation literature, which includes linking to data from the internet. Starting with quotes or snapshots from the video, Deb8 supports the creation of chains of questions, opinions and evidence where the links among these elements can be weighted by each person based on the degree to which they feel it supports or is relevant. Deb8 additionally supports temporal filtering of argument elements along with the ability to only view those with par-ticular degrees of support and relevance.
We make the following contributions: 1) the design and implementation of a collaborative platform for the group-based analysis of debate videos; 2) a set of argument theory
107 108 109 110 111 112 113 114 115 116 117 118 119 120 121 122 123 124 125 126 127 128 129 130 131 132 133 134 135 136 137 138 139 140 141 142 143 144 145 146 147 148 149 150 151 152 153 154 155 156 157 158
160 161 162 163 164 165 166 167 168 169 170 171 172 173 174 175 176 177 178 179 180 181 182 183 184 185 186 187 188 189 190 191 192 193 194 195 196 197 198 199 200 201 202 203 204 205 206 207 208 209 210 211
driven features for supporting quotes, questions, opinions, relevance and support in evidence-based analysis, and; 3) a preliminary study of three groups of users suggesting that Deb8 can address existing challenges of video-based debates.
2 EXAMPLE SCENARIO
A group of journalists at a national newspaper have been tasked by the editor with analyzing a televised debate that took place that afternoon on national TV. The newspaper, which prides itself on its balanced views and rigorous re-spect for facts, wants to offer an analysis of each candidate’s discourse. The analysis should weigh supporting and con-tradicting views for their arguments and statements. The journalists will select and comment on quotes by the candi-dates, find evidence and data that corroborates or contradicts their statements and collectively evaluate their relevance and weight. Once the analysis of the debate is completed, they want to reach some kind of team consensus regarding the strength of the different candidates and how trustworthy their proposals are.
The scenario is then extended when the editors decide that they want to open up the analysis to the general public. Interested readers will have different sources of evidence (missed by the journalists, or from non-reputable sources) and will have different points of view regarding what is relevant, important, and believable. Note that, at this time, we are not considering scenarios involving real-time analysis of debates.
3 RELATED WORK
The growth of online discussion fora has given rise to nu-merous ways in which existing systems can be used to sup-port group discourse around a debate. Examples include collaborative web-based learning environments (e.g. Black-board, MOOC), newsgroups, question and answer systems (e.g. Quora), commenting systems (e.g. newspapers, blogs), dedicated discussion channels (e.g. IRC, Slack), online news and discussion communities (e.g. Reddit, Slashdot) and so-cial networks (e.g. Facebook). Such systems are often largely textual with simple reply mechanisms, limited threading for discussions and little support for the identification of argu-ments and counter-arguargu-ments or rebuttals, topics, concepts, emergent questions, evidence, or for providing structure in how these aspects interrelate in the debate.
The strength of such simple text-based systems has al-lowed them to be used in flexible ways supporting a breath of discourse types ranging from discussion around a debate event, to an ongoing discussion (sometimes called a “debate”) around a controversial social topic [10].
While such general purpose systems can be used to sup-port many forms of discussion, the need to supsup-port more structured discourse, such as in formal debates, has given
rise to the development of systems that work around op-posing arguments, often ending with a vote. These afford users the opportunity to create a topic or question to de-bate (e.g. ConvinceMe.net, Dede-bate.org, EDeb8.com, Dede-bateIs- DebateIs-land.com, debatewise.org or artikulate.in), add polls (e.g. debate.org), opinions (e.g. Debate.org), arguments for and against (e.g. ConvinceMe.net, quibl.com, createdebate.com and debatewise.org) and voting (e.g. Debat [21], Debate.org, ConvinceMe.net, EDeb8.com, netivist.org, quibl.com, cre-atedebate.com or debatewise.org). Alternatively, dedicated strands within an established system, such as “change my view” in Reddit.com [22], take an existing platform and over-lay new rules of behaviour to afford new features and forms of interaction for debate.
Brainstorming and Crowds
Group discussion in a debate can be seen as a form of brain-storming, while the involvement of ever larger groups sug-gests that the “wisdom of the crowd” may allow for richer discussions and hence agreement, or at least evidenced dis-agreement. Brainstorming, as an identified concept, dates back over half a century [27], while the notion of employing the “wisdom of the crowd” is at least a century old [9]. Since first identified, both concepts have had detractors, yet the de-velopment of digital platforms which rely on both concepts are now commonplace. Consensus building or the formation of opposing views through brainstorming are common uses of online discussion tools. From Facebook to email we can see use of such systems to allow for spontaneous group dis-cussion, harnessing the wisdom of a group to produce new ideas or solve old problems.
Manifestations of such brainstorming systems, which al-low the wisdom of many participants, can be seen in nu-merous forms of related work. For example, the presenta-tion of informapresenta-tion in face to face or remote settings can support this. Platforms such as SlideShare or Prezi allow for limited markup and discussion of the content while IdeaMâché [20] affords information composition with con-cept maps through presentation, discussion and ideation. Alternative approaches for collaborative sense-making and intelligence analysis offer a sense-making canvas to reduce the cognitive effort of analysts in making sense of infor-mation from various sources, including The Sandbox [40] and others (e.g., [15, 38]). In addition, interactive visual lan-guages, such as iVoLVER [26], can be employed to facilitate analysis of visual data.
213 214 215 216 217 218 219 220 221 222 223 224 225 226 227 228 229 230 231 232 233 234 235 236 237 238 239 240 241 242 243 244 245 246 247 248 249 250 251 252 253 254 255 256 257 258 259 260 261 262 263 264 265
266 267 268 269 270 271 272 273 274 275 276 277 278 279 280 281 282 283 284 285 286 287 288 289 290 291 292 293 294 295 296 297 298 299 300 301 302 303 304 305 306 307 308 309 310 311 312 313 314 315 316 317 318
Mind-maps, collaborative mind-maps [32] and systems ground-ed in the mindmapping paradigm [20] rely on the ability to create textual or graphical nodes, introduce child nodes, manipulate siblings, and grow the often tree-structured in-formation space by interactively linking elements. Graphical data-flow languages from audio composition [6] to visualiza-tion [26] or health data-flow [35] or to end user programming (e.g. LabView), all relate to the visual appearance and linking of the elements employed in Deb8. We refer the reader to [17] for a comprehensive survey of dataflow languages and [8] for visual languages in general. The flexibility introduced by such graph components enable the representation of com-plex argument structures such as argument reinstatements, that is, arguments that support a claim by challenging its un-dermining arguments (i.e., [31]). This last group of systems are most closely related to our work but do not incorporate the key collaborative analysis aspects we introduce.
Debates and debating systems have given rise to many strands of research, often focused on understanding the con-tent of the debate. In this regard, prior work has explored fact checking [12, 28], identification of stance [1], highlight iden-tification [36], argument analysis [19], sentiment analysis and segmentation [23], along with second-screen experi-ences [2, 11] and collective assessment (e.g. “the worm” [4]) in live debates , real-time feedback [14], and debate visualisa-tion [29]. Such research can enhance any system to support debate but does not address the inherent problems of collab-orative analysis.
Alongside applications that focus on understanding de-bates, argument-mapping tools have developed to help users analyze and structure arguments, including Rationale & bCi-sive (reasoninglab.com), Compendium [34], AGORA-net [13], and OVA+ [16]ÆŠ. These tools provide graph patterns to guide the construction of well-formed arguments under-pinned by a specificargument ontologywhich indicates the
meaning of nodes and relationships [3]. Tools such as bCisive and Compendium are based on the Issue-Based Information System (IBIS) representation [18] wherepositionscan be used
to respond to anissue, and can be expanded with pro and
conarguments. IBIS has been used in many applications [34],
including dialogue analysis [5] to build collaborative under-standing of an issue. Other systems provide an ontology that focuses on identifying the structure of inferences and con-flicts, for example OVA+, based on the Argument Interchange Format [3], which distinguishes between information nodes or scheme nodes. Deb8 builds on these ontologies by speci-fying elements necessary to represent meaningful structures for collaborative discussion and analysis of debates.
Deb8 exemplifies the four stages of Collect, Relate, Create, and Donate [33] for sparking creativity in the identification of quotes, development of questions and opinions, provision of an evidence base while allowing for collaborative analysis
and identification of relevance, support and belief inherent in one’s own, and others’ points of view.
4 DESIGN GOALS, SCOPE AND PRINCIPLES
Our overarching goal is to create a new type of web-based media that enhances understanding and communication of people about video-based debates. More specifically, we de-signed Deb8 to: G1) support deep and close analysis of video debates; G2) facilitate direct linking with existing knowledge and opinions; G3) enable collaboration between people with different opinions, and; G4) allow people to manage com-plexity. Although we realize the importance of simplicity in the design of the interface and strive to make the UI as accessible as possible, we prioritized the goals above over the creation of an interface for “walk up and use” because we believe that deep analysis requires some training. We consider arguments in a broad sense and we do not intend to map the structure of arguments, such as premises and conclusions, at this stage.
Some of our goals above are partly shared with exist-ing tools (e.g., Compendium [34], AGORA-net [13], and OVA+ [16]), but they all draw from our belief that deeper collaborative engagement with evidence and political ideas by a broader range of the population is a good way forward towards better functioning democracies.
In order to address our design goals we established the following design principles as a guide: DP1) provide a small set of reusable elements that can be interconnected in rich ways; DP2) map interface elements to the constructs in argu-ment theory to structure discussion; DP3) allow each user to judge relevance, valence and trustworthiness of discussion elements at a fine level of granularity; DP4) support multi-ple views and filtering of data and; DP5) provide flexible UI navigation and linking to support complex workflows. In the following sections, we describe the interface and use the codes for goals and design principles above to describe how specific features address them.
5 DEB8
In this section we use the example scenario above to describe the Deb8 system and its underlying argument structure in relation with the goals (G1-4) and design principles (DP1-4) of Section 4.
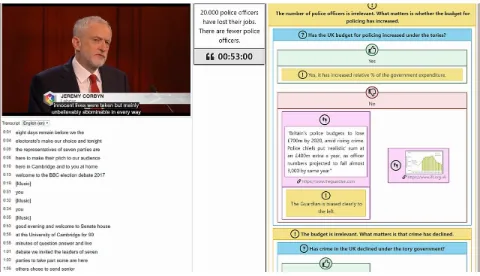
Interface Structure
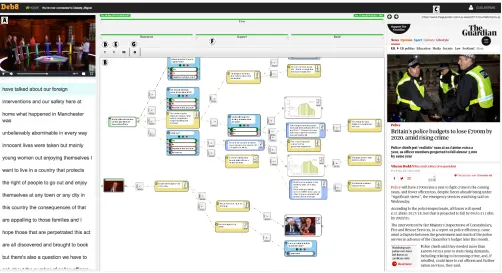
Deb8 is conceived to run in a large landscape monitor or inter-active surface, preferably high-resolution (UHDTV). Besides a thin horizontal bar at the top with the title and log-in but-tons, the main structure divides the screen into three vertical panels: the Video and Caption Panel (Fig. 1.A), the Argument Canvas (Fig. 1.B), and the Web Browser (Fig. 1.C). The three panels are interlinked in multiple ways to support G2. We
319 320 321 322 323 324 325 326 327 328 329 330 331 332 333 334 335 336 337 338 339 340 341 342 343 344 345 346 347 348 349 350 351 352 353 354 355 356 357 358 359 360 361 362 363 364 365 366 367 368 369 370
[image:4.612.57.559.90.363.2]372 373 374 375 376 377 378 379 380 381 382 383 384 385 386 387 388 389 390 391 392 393 394 395 396 397 398 399 400 401 402 403 404 405 406 407 408 409 410 411 412 413 414 415 416 417 418 419 420 421 422 423
Figure 1: Main structure of the Deb8 interface.
anticipate that the activities supported by the three panels (video watching, argument structure creation and linking, and web browsing) take place in a highly interleaved way, and therefore all of them are present continuously on the screen (DP5). To accommodate varying importance of the activities at different points in time, the amount of screen real estate that each panel takes can be adjusted by dragging their boundaries.
Video and Caption Panel
The leftmost panel contains a video player to display the debate video, with the usual web-video facilities (play, stop, pause and a timeline). Underneath the video, there is a scrol-lable panel that contains the video captions. As the video plays, the corresponding caption is highlighted. It is also pos-sible to click on a specific caption in the panel, which moves the video to the corresponding time. This is an example of cross-element UI linking (DP5).
Textual caption “text snippets” or video frames “snap-shots” can be dragged from the caption panel into the central argument canvas. Such actions create textual or video quotes respectively, which can hence be manipulated and intercon-nected within the canvas.
Argument canvas
The central and core panel of the application is an infinite zoomable argument canvas that allows the journalists to build a shared graph of argument chains (G2) by creating arbitrarily complex (G4) combinations of simple elements (DP1) derived from argument theory (DP2). This model and interface are inspired by existing interfaces used for brain-storming [20], argument mapping [16, 34, 38], and visual programming [6, 26]. The types of elements that can be con-nected are described in Subsection 5, and were chosen to represent the smallest atomic argument components to ana-lyze debates (DP1) and to connect to each other in as many meaningful ways as possible (see also Section on “Argument Ontology”).
Argument elements.Deb8 offers four key atomic argument
analysis element classes (quotes, opinions, questions, and evidence). Arguments are meant to be built from left to right expanding the analysis of previous points, therefore elements connect to other elements from their left connectors and are connected to other objects on their right connectors.
425 426 427 428 429 430 431 432 433 434 435 436 437 438 439 440 441 442 443 444 445 446 447 448 449 450 451 452 453 454 455 456 457 458 459 460 461 462 463 464 465 466 467 468 469 470 471 472 473 474 475 476 477
[image:5.612.65.293.93.239.2]478 479 480 481 482 483 484 485 486 487 488 489 490 491 492 493 494 495 496 497 498 499 500 501 502 503 504 505 506 507 508 509 510 511 512 513 514 515 516 517 518 519 520 521 522 523 524 525 526 527 528 529 530
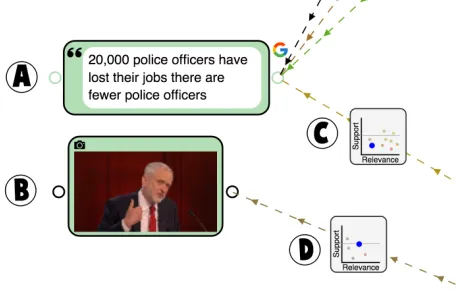
Figure 2: Two examples of the Quote Widget. Caption quote widget on top and snapshot quote widget below.
the caption text or the snapshot of the video. Quotes are designed to be the roots of the argumentation threads in a graph, to which all other elements can connect. This is an explicit design decision to help the discussion stay focused on what is in the primary content itself (the video–G1) rather than allowing any opinion or evidence to exist independently, without any connection to any content. We believe that this helps support collaboration despite people having different opinions (G3), as material drawn from the video is a primary source.
The quote widget (Figure 2) has an outbound connection port on its left (Fig. 2.A–because quotes can also be used as a type of evidence on a deeper part of the graph structure) and an inbound connector port on the right, to connect other elements to. In all widgets, inbound and outbound ports allow multiple outbound and inbound connections (G2, G4, DP1, DP5). The main body of the widget displays the quote itself (Fig. 2.A) or the snapshot (Fig. 2.B). The small icon on the top left sets the video play location to the quote. The “G” icon on the top right of the caption quote widget launches a search on the browser with the current selection of words within the quote (G2, DP5).
Question.A journalist can create a question widget by dragging the question icon from the icon bar (Fig. 1.D) and typing the question text. The same member of the team, or others, can use the three color-coded buttons marked with a plus sign to create positive answers (e.g., in our example, Yes, as shown in Fig. 3), negative answers, or neutral answers to the question.
This widget is the only one which contains internal “sub-widgets”: the answers. This breaches DP1 somewhat because we could have made answers separate widgets that connect to a question. However, here we decided to limit the flexi-bility of answering a question for the sake of simplification (G4) and, more importantly, to help the team maintain an
[image:5.612.318.555.96.166.2]Figure 3: A question widget (right) connected to a quote (left).
Figure 4: An opinion widget.
understandable common structure of their arguments (DP2). Answer sub-widgets are designed to be general and to group a variety of elements that can connect to them. In other words, we prefer to encourage many opinions and bits of evidence (of different types) connected to a few answers (Yes, No, Maybe) rather than very long lists of answers which might be somewhat similar to each other. As with the other widgets, many other widget types can connect to an answer. The way that a question is formulated and the negative (-) or positive (+) polarity of each answer is important. This is because a comment or evidence that supports a positive answer should also support whatever the question is con-nected to (G3, G4, DP2, DP3). This is further described in the Section on Linking and Rating below.
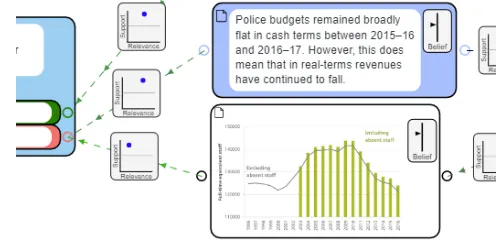
Opinionwidgets contain mainly text to explain or intro-duce an argument or idea, without providing direct evidence or stating a question (Fig. 4). Opinions are created by drag-ging the exclamation mark icon (Fig. 1.E) from the icon bar and have the usual outbound and inbound ports as well as an additional widget that allows anyone connected to this debate to rate the degree of belief that they have on this particular opinion. The system records a data point for each analyst who moves the belief slider. The belief that other people have expressed on a particular opinion is visible in the widget as a shadow, forming a kind of histogram (see Fig. 4–supports G3, DP3, DP4). In the second part of the scenario, one could imagine how a large number of readers could weigh in to provide a well-sampled crowdsourced poll of the believability of this item.
Evidenceis represented through a widget that can be text- or image-based (Fig. 5). A journalist can create evi-dence widgets by selecting and dragging text or an image from the browser of the rightmost panel of the application
[image:5.612.321.558.219.280.2]531 532 533 534 535 536 537 538 539 540 541 542 543 544 545 546 547 548 549 550 551 552 553 554 555 556 557 558 559 560 561 562 563 564 565 566 567 568 569 570 571 572 573 574 575 576 577 578 579 580 581 582
[image:6.612.46.297.94.215.2]584 585 586 587 588 589 590 591 592 593 594 595 596 597 598 599 600 601 602 603 604 605 606 607 608 609 610 611 612 613 614 615 616 617 618 619 620 621 622 623 624 625 626 627 628 629 630 631 632 633 634 635
Figure 5: Two evidence widgets: text-based (top), and image-based (bottom).
(Fig. 1.C). Evidence widgets store the link of the original source document. Any journalist in the team can later re-trieve the web document to their right-panel web-browser by clicking on the document icon on the top left of the wid-get (Fig. 5). Evidence widwid-gets have belief sliders identical to those of opinions. This widget allows the journalists to store their fact checking efforts within the debate analysis itself and also provides an appropriate entry point for those who want to follow up on the sources that they have linked.
Argument Linking and Rating System.Thebelief rating slider
of the opinion and evidence widgets described above is one part of the rating system, and supports G3, enacting DP3. In addition, all other links between widgets are also tagged in two dimensions with a special square widget. This is visible in figures 2 to 4, with a close-up in Figure 6. Thislink rating widgetallows each analyst to rate the connection between
the origin widget and the destination widget in two dimen-sions:relevanceandsupport. Relevance denotes whether the
origin of the link is on topic with respect to the destination of the link. Moving the blue dot to the right means increased relevance. For example, a question such as “has the govern-ment forbidden alcohol advertisegovern-ment” might be judged to have very low or no direct relevance to a quote stating that “20,000 police officers have lost their jobs” (i.e., most in the team will move the dot to the left). An opinion stating that “The number of police officers is irrelevant, what matters is crime stats trends” might be considered of middle relevance by some, for the same quote, and evidence stating that “the number of police officers has declined in the last four years by 14%” might be considered very relevant, and therefore most raters will move the blue dot to the right.
The other dimension of the square link tagger widget is
support. Support indicates the polarity of the relationship
be-tween the origin and the destination of the link. For example, an opinion that reads “police officers have not lost their jobs, they have retired” would be judged to be on the negative
side of the support dimension (i.e., it contradicts the quote, which shows the blue dot lower in the widget), whereas a piece of evidence from a web article indicating that “15,000 police officers have been made redundant in 2018” would be considered highly supportive of the quote. In general, posi-tive support means that the higher the importance and belief of the origin widget, the higher the importance or belief in the destination. Negative support inverts this relationship.
Although questions do not intrinsically support or con-tradict a quote, opinion or evidence, they have a polarity according to how they are formulated. The rule here is that a link from a question should be rated as supportive if ayes
or affirmative answer (indicated with green at the time of the creation of the answer), is supportive of the element in the destination. This allows the analysts flexibility in how the question is formulated. For example, a question on the same quote about police officers above that is formulated as “Are there currently fewer police officers?” would be con-sidered supportive of the quote, since ayesanswer would
work in the same direction as the quote. If the question was formulated as “Are there currently more police officers?” the question should be rated to contradict the quote.
What each journalist sees on their own canvas are their own blue dots (one per link), along with a group-aware view of where all the other people’s views of the relevance lay across the 2D “chart” (Figure 6). As before, a large number of ratings from the general readership of the newspaper could offer a quick overview of whether that connection between the argument items is controversial (broad distribution of dots) or not (sharp distribution) for this group of people, and along which dimension.
Notice that even fairly straightforward relationships be-tween widgets can be somewhat controversial. In the exam-ple above, a nitpicky journalist might consider whether a question about there being fewer police officers is relevant, since this might depend on the meaning of losing a job, and police force attrition could also happen through retirement. For this reason (i.e., to support different opinions–G3, at low granularity–DP3) each journalist can make their own judg-ment on relevance, support and belief. Finally, the color of the graphical link and of the dots behind double-encode sup-port and relevance visually: average positive and negative support change the hue from green to red respectively, and relevance increases saturation (low relevance is close to gray, and high relevance makes the colors vivid).
Argument Ontology.The widgets described above are based
637 638 639 640 641 642 643 644 645 646 647 648 649 650 651 652 653 654 655 656 657 658 659 660 661 662 663 664 665 666 667 668 669 670 671 672 673 674 675 676 677 678 679 680 681 682 683 684 685 686 687 688 689
[image:7.612.52.297.94.178.2]690 691 692 693 694 695 696 697 698 699 700 701 702 703 704 705 706 707 708 709 710 711 712 713 714 715 716 717 718 719 720 721 722 723 724 725 726 727 728 729 730 731 732 733 734 735 736 737 738 739 740 741 742
Figure 6: Close-up of the link tagger widget connecting a quote with a question.
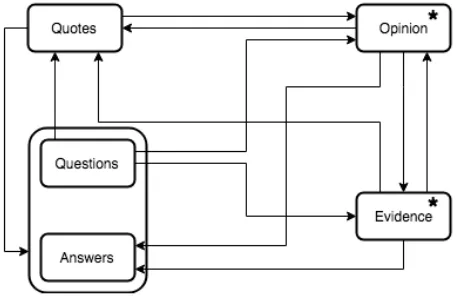
Figure 7: The ontology of widgets/argumentation elements, with their possible connections. Elements marked with an ”*” have a belief rating slider. All links have support and
rel-evance rating widgets.
that most of other links can go in either direction. All relation-ships can be many-to-many. The ontology that we derived is most closely related to the IBIS representation [18, 34] extended for collaborative analysis of debate. IBIS’s ‘Issues’ would be posed asquestionsin Deb8, and Deb8’squotesand answersrepresent ‘positions’ in IBIS jargon. IBIS’s
‘Argu-ments’ are instantiated instead throughopinionandevidence
widgets, of which plausibility and polarity can be rated via their relevance, support, and belief widgets.
Filtering and Layout.One downside of the atomic/constructive
approach of DP1 is the potential complexity of the generated constructions [24, 25]. To help manage this complexity (G4), we support multiple filtering and layout mechanisms (DP4). The filter bank is shown on top of the argument canvas (see Figure 1.F) and contains four filters which control the visibil-ity of widgets depending on time (when they were created), relevance, support and belief. Each slider bar has two han-dles, which allow low-, high- and band-pass filtering of each dimension.
The time filter allows the journalists to collaborate (G3) and manage complexity (G4). Moving the left handle to the
right makes widgets created before the current slider’s time fade visibly. By moving this slider’s handle back and forth the analyst can see which areas of the discussion are more recent. This can be useful if the journalist has been working elsewhere on the canvas for a while. Moving the right han-dle to the left makes any widgets created after the position of the time disappear. This supports a “manual replay” to understand how the graphs grew (a form ofprovenance
sup-port [30]). Creating a new widget will automatically bring the slider’s handle to its full positions, in order to avoid hav-ing to deal with the navigation and complexity problems of alternative futures (G4, DP5).
The other three filters hide widgets that do not fit within the ranges of relevance, support and belief indicated through the filter sliders. However, unlike with the time slider, a dis-appearing widget will also make everything else downstream in the argumentation graphs disappear. This design decision is meant to simplify filtering very large trees (G4) based on the assumption that relevance, valence and trustworthiness propagate throughout the graph (DP3). For example, an ele-ment that qualifies or supports something irrelevant is likely to be irrelevant. Through a combination of settings, the jour-nalists can filter the current canvas to show, for example, only relevant supportive arguments, relevant contradicting arguments, or only those arguments which are considered irrelevant.
Multi-user Collaboration Policies
Deb8 is conceived as a synchronous/asynchronous distributed collaboration tool which can also be used in co-located set-tings. Our scenarios propose its use by small to large numbers of people, which requires specific UI design decisions. We prioritized two principles here. First, to enable people with different opinions to collaborate (G3), we wanted to avoid edit wars of the kind seen in Wikipedia and other document-based environments [39]. For this, we enable anyone to judge any of the argument constructions through the link rating mechanism described above (DP3) while, at the same time, locking each construction, including for deletion, once it has been built upon. This means that widgets, including links, can only be removed and/or edited while there is nothing connected to them. Otherwise it would be relatively easy for anyone to subvert the whole meaning of a branch by, for example, adding the word “not” in a question’s text. In general, objects are not visible by everyone connected to a debate until they are connected to quotes or other elements connected themselves to quotes.
Simultaneously, we recognize that people’s ways of build-ing arguments and organizbuild-ing information is personal and constructive (DP1, DP4). Therefore the view in each client is unique: each journalist can choose to rearrange the elements in the 2D canvas however they like. When the number of
[image:7.612.62.292.228.376.2]743 744 745 746 747 748 749 750 751 752 753 754 755 756 757 758 759 760 761 762 763 764 765 766 767 768 769 770 771 772 773 774 775 776 777 778 779 780 781 782 783 784 785 786 787 788 789 790 791 792 793 794
796 797 798 799 800 801 802 803 804 805 806 807 808 809 810 811 812 813 814 815 816 817 818 819 820 821 822 823 824 825 826 827 828 829 830 831 832 833 834 835 836 837 838 839 840 841 842 843 844 845 846 847
elements gets large and others’ contributions start popping up too fast (G4), it is possible to invoke an automatic force-directed constraint algorithm (based on [7]) to rearrange the elements in the argument canvas, starting from quotes on the left, and avoiding overlaps (DP4).
Web browser
Most of the linking functionality between the web browser pane (Fig. 1.C) and the rest of the interface has been already described: journalists can directly search on the web for keywords in quotes, opinions and questions through the “G” button in the corresponding widgets. Pieces of evidence are created on the canvas by dragging text or images from the browser, and clicking on the top left corner of an evidence widget opens the corresponding web source in the browser. In addition to this functionality, journalists can simply search and navigate the web through the search bar and by clicking on links, as with a regular web-browser. All this functionality is individual, an analyst cannot see what others are searching or using their own browsers for.
Analysis Player
The features and panes described so far provide ways to build almost arbitrarily complex analyses of the video by using the argument canvas to link content from the video and evidence from the Internet, but they do not provide a simple way to consume the content of the analysis. We wanted to facilitate visualizing specific views of the video analysis in a way that is easier than traversing the argument graphs visually.
The Analysis Player is an independent feature that ap-pears on a separate screen and sequentializes the structure of the debate to be played alongside the video. For example, a journalist could press the Analysis Player button in the icon bar (Fig. 1.G), to export the elements in the current view (i.e., it will ignore the filtered elements) to an external window (Fig. 8). The new window shows a Video and Caption Panel similar to that of the main interface and two new panels. As the video plays, the quotes of the canvas appear in a mid-dle panel with their corresponding timestamps. The right panel shows all the argument elements associated with each quote. Argument elements are represented as rectangular objects whose visual appearance (color and icon) indicates their type.
The player re-represents the connected elements from the argument canvas using nesting. For example, a question with two answers is shown as an object containing two elements. If one of these answers happens to be associated with a piece of evidence, this will, in turn, contain a visual representation of the evidence (text or image).
[image:8.612.318.558.91.229.2]As in the main interface, the player’s sections are inter-linked. That is, interactions with the video’s timeline or its
Figure 8: The Analysis Player Window uses containment to play sequentialized discussion graphs alongside the video.
captions trigger changes in the displayed quotes and argu-ment eleargu-ments, and vice versa. This allows the team of jour-nalists to generate summaries of the argument analysis that can be consumed by just playing the video (with the argu-ment eleargu-ments rolling on the side). Different versions are easy to generate by filtering in different ways prior to in-voking the player. For example, journalists might want to have a version with only extremely relevant arguments and another one with only supportive arguments.
Other features
The Deb8 interface tracks different users with a log-in sys-tem to allow future personalization of the configuration and saving of different debates and views. There is also a small interface to create new debates out of captioned video.
Implementation
Deb8 works as a web-client implemented in Javascript using Electron framework1using Node-JS2and Video.js libraries3 against a MongoDB database server implemented in Node-JS. The argument canvas is implemented with the publicly available iVoLVER toolkit4, which is, itself, implemented on top of the Fabric.js library5.
6 INITIAL EVALUATION
We conducted an initial study of Deb8 to validate our design with respect to the goals discussed in Section 4 and to assess the viability of the approach. We observed three groups of participants performing an analysis of an election debate to gather insights on the use of Deb8 in collaborative analysis of video material (G1). Furthermore, we studied the support
1http:\electronjs.org 2http:\nodejs.org 3http:\videojs.com
849 850 851 852 853 854 855 856 857 858 859 860 861 862 863 864 865 866 867 868 869 870 871 872 873 874 875 876 877 878 879 880 881 882 883 884 885 886 887 888 889 890 891 892 893 894 895 896 897 898 899 900 901
902 903 904 905 906 907 908 909 910 911 912 913 914 915 916 917 918 919 920 921 922 923 924 925 926 927 928 929 930 931 932 933 934 935 936 937 938 939 940 941 942 943 944 945 946 947 948 949 950 951 952 953 954
that Deb8 offers in facilitating linking evidence and opinions (G2), enabling different forms of collaborative debate analysis (G3) and the complexity of such interactions (G4).
Participants
We recruited 9 participants from a local university (2 females, ages 24-50, 5 native English speakers) divided in groups of 3. Previous experience and engagement in online discus-sions, reading online news and mind mapping tools varied among participants. Most participants (7) were readers of online news but with little or no active engagement, 7 had contributed to online discussions, particularly within social media, and 6 participants had some experience in mind map-ping.
Procedure, Tasks and Analysis
Participants were invited for group study sessions lasting approximately one hour and provided written consent ac-cording to local ethical procedures. We chose a seven-way 2017 UK general election TV debate for this study. Each ses-sion involved three phases: 1) a demo of the system by a facilitator to train the participants in the use and function-ality of Deb8; 2) an individual task where each participant was asked to perform some analysis of three selected quotes from the video regarding specific claims made by the debaters (T1—15 minutes); and 3) a collaborative task of wider scope, where the group was asked to focus on a specific point in the debate regarding priorities for making Britain a safer place (T2—15 minutes). All three participants were co-located in the room, each operating on an individual computer for both tasks, working on an individual canvas of Deb8 for T1, and on a shared canvas for T2.
Each session was video recorded and we took observa-tional notes regarding the participants’ interaction with the tool. We captured the screen of each participant’s computer in order to see their interaction and the process of how each graph was built in detail. To understand the use of widgets, we also collected the argument graph built by each partici-pant as well as the one resulting from the collaborative task. A questionnaire followed each task with open questions re-quiring participants to comment on features of Deb8. For T2, we also collected opinions on whether the tool improves the groups’ shared understanding.
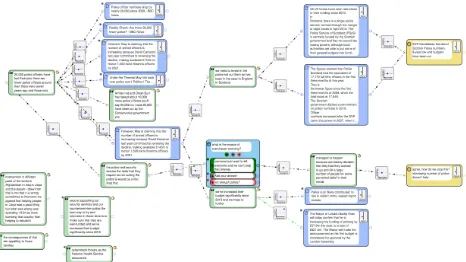
[image:9.612.323.556.100.231.2]The analysis was made by: A) observing the recorded video of each session; B) observing the captured screen of each par-ticipant’s computer; C) analysing the final graph generated by each participant for each task and finally, D) analysing the questionnaires.We used these observations to understand the participant’s behaviour in terms of interaction, commu-nication and collaboration. Regarding the interaction, we also focused on observing the strategies participant groups
Figure 9: An example of T2 final analysis graph
adopted to build the graph and to search for evidence on the web.
Evaluation observations
The analysis graphs generated during the study have the following characteristics. In T1, we see the use of 9.9 wid-gets on average divided as: 0.8 questions, 1.9 opinions, 3.0 quotes, and 4.2 evidence nodes. The maximum depth of the analysis was 2 with a branching factor on average of 2.3 (excluding unconnected widgets). On average in T2 partic-ipants used 25.3 widgets divided as: 13.7 quotes (of which 3.0 were video snap shots), 4.7 evidence nodes, 3.7 opinions, and 1.7 questions. The maximum depth of the analysis was 3 with a branching factor on average of 1.5. Figure 9 shows an example of the obtained collaborative analysis of T2.
Use of tool.Overall, participants were able to construct
rel-atively large argumentation graphs in a relrel-atively short amount of time. We think that the graph size averages of over 10 for T1 and 25 for T2 linked widgets is notable for just a 15 minute period. The resulting graphs show plausible analyses and use of different types of widgets with a mostly coherent semantic. This suggests that Deb8 can support the generation of structured commentary and that its interface functionality can be learned after a short training phase.
Participants’ responses from the questionnaires highlight that Deb8 was particularly helpful in searching and using external pieces of evidence in the analysis and evaluation of quotes. Participants emphasized how this support reduced the effort of switching between different tools or applications to perform similar tasks. Participants also complimented the ability to extract quotes and replaying the debate from the location of particular quote.
Collaboration. We hypothesized that the collaborative task
would introduce higher interaction complexity. Our analysis reveals that, despite the overheads that collaboration usu-ally imposes, the three argumentation graphs that resulted
955 956 957 958 959 960 961 962 963 964 965 966 967 968 969 970 971 972 973 974 975 976 977 978 979 980 981 982 983 984 985 986 987 988 989 990 991 992 993 994 995 996 997 998 999 1000 1001 1002 1003 1004 1005 1006
1008 1009 1010 1011 1012 1013 1014 1015 1016 1017 1018 1019 1020 1021 1022 1023 1024 1025 1026 1027 1028 1029 1030 1031 1032 1033 1034 1035 1036 1037 1038 1039 1040 1041 1042 1043 1044 1045 1046 1047 1048 1049 1050 1051 1052 1053 1054 1055 1056 1057 1058 1059
from T2 are meaningful and of a reasonable size with respect to the time allocated for this task. We observe that in T2 participants created relatively larger constructions than in T1, with a higher number of threads of analysis. Advanc-ing at different speeds, it was common for participants to switch their attention focus to different parts of the canvas argumentation sub-graphs to share opinions and provide evidence.
Because of the diverse social dynamics, often characterized by interleaving of individual and cooperative phases [37], working in collaboration to construct shared understanding is a complex process. Nevertheless, participants were able to cope with these complexities by using Deb8’s UI flexibly (DP4, DP5). While participants focused and contributed on the collaborative analysis, they also created ‘personal spaces’ of analysis within the canvas to focus on individual perspec-tives before bringing them into view to share them with the other members of the group. While the entire canvas is shared, patterns of territoriality emerge giving rise to various forms of sharing and personal use.
The questionnaire responses also show that most partici-pants appreciated the ability to add questions and learn from others’ opinions. However, they suggested that collaboration could be more effective if Deb8 provided additional support for group tasks. For example, highlighting dynamic updates of canvas elements would allow members of the group to fo-cus on the points of analysis that are being currently debated and considered.
Additionally, we noticed that the Deb8 relevance, support and belief rating system was not fully used in T2. This may be attributed to the limited time available to complete the task. Participants might have constructed their arguments but have not yet had the opportunity to critically reflect on the significance of the claims from other member of the group to converge to a conclusion. Such graph sketching may be followed by periods of reflection, in particular as more people employ the filters to focus their attention on material with a particular level of support and relevance.
Arguments and analysis.We observed varied reasoning
pat-terns and argumentation structures in the study. We noticed instances of debate argument analysis, where quotes are linked to other quotes to map the linear thread of debate to an argument graph, that are similar to existing analytical approaches (e.g., [19]). The process involved many instances of fact checking to establish whether a debater’s claim was plausible, and information seeking to find out more about the topic. Both tasks were accomplished by introducing ev-idence from the web and linking to quotes or answers of questions. These patterns align with requirements identi-fied for audience engagement in televised debates (e.g., [29]). Participants used opinions in different ways. For example to
state personal conclusions after analyzing existing evidence (as shown in Figure 9), or to provide additional support and share conflicting views with existing claims as typical in argumentation processes.
While an in-depth analysis of the types of underpinning reasoning processes is out of scope, we noticed that the simple modular design of Deb8 elements (DP1, DP5) enables the formation of rich argumentative structures. Our initial findings suggest that the capabilities of Deb8 provide support for many interlinked reasoning processes such as debate analysis, evidence formation, and collaborative discussion in a coherent format and space for analysis.
7 DISCUSSION AND LIMITATIONS
This paper has introduced the design and implementation of Deb8, a tool for collaborative analysis of video debates that introduces a number of novel features and that is based on a principled design supported by current knowledge in argu-mentation. The system addresses a complex problem and of-fers a sophisticated interface that will likely require training and might not be accessible to everyone. This interface bor-rows elements from the design of graphically-structured ar-gumentation tools such as debatemap.live, debategraph.org, Rationale & bCisive (reasoninglab.com), AGORA-net [13], and OVA+ [16]. Unlike many of these tools, however, Deb8 provides specific features to connect the video/captions source, with the argumentation schema and the evidence. Further-more, the tool offers collaborative features that extend its use beyond the relatively rare expertise of argument analysts. For example, the ability to integrate the relevance, support and belief ratings across a large number of people collabo-rating synchronously over the web is distinctive of Deb8, as is the ability of each separate user to create their own filters and layouts to support their own thinking.
Although the results from the preliminary evaluation pre-sented in Section 6 are promising and indicate that our par-ticipants were very adept at creating arguments and finding evidence to back up or disprove arguments, there are still important outstanding questions. Specifically, what happens when larger numbers of people use the tool? Will the fil-tering and rating mechanisms enable analysts to cope with the complexity of dealing with large numbers of potentially conflicting opinions and sources of evidence? Do the shared canvas, ontology and widgets have significant weakness that allow small numbers of users to hijack the arguments or vandalize the work of many?
1061 1062 1063 1064 1065 1066 1067 1068 1069 1070 1071 1072 1073 1074 1075 1076 1077 1078 1079 1080 1081 1082 1083 1084 1085 1086 1087 1088 1089 1090 1091 1092 1093 1094 1095 1096 1097 1098 1099 1100 1101 1102 1103 1104 1105 1106 1107 1108 1109 1110 1111 1112 1113
1114 1115 1116 1117 1118 1119 1120 1121 1122 1123 1124 1125 1126 1127 1128 1129 1130 1131 1132 1133 1134 1135 1136 1137 1138 1139 1140 1141 1142 1143 1144 1145 1146 1147 1148 1149 1150 1151 1152 1153 1154 1155 1156 1157 1158 1159 1160 1161 1162 1163 1164 1165 1166
(managing complexity) is probably the hardest goal, and it is possible that the design will require further collaboration features and policies to become more suitable, especially for larger groups. Comparisons with different approaches such as debatemap.live, Rationale & bCisive (reasoninglab.com), Compendium [34], AGORA-net [13], and OVA+ [16] will also be useful to understand what aspects of our features are more and less useful.
There are also deeper questions related to the nature of the interface and argumentation itself. Further research, which can be supported by Deb8, can shed light on exactly how graphical layout interfaces can provide better support of argumentation than their mostly linear text-based counter-parts, and why. It is also important to further understand how structuring argumentation might be able to help people with opposite opinions can reach certain types of consensus or at least agree to exchange ideas in civilized rule-based ways. Although Deb8 is a simple step in this direction, we believe that it could be instrumental in answering these questions.
8 CONCLUSION
We presented the design, implementation and preliminary evaluation of Deb8, a system that enables deep collaborative analysis of video-based debates. The system enables dense linking of information across multiple types of media to struc-ture arbitrarily complex arguments based on argumentation theory. The combination of features is unique and follows a set of design principles that address the intricate space of political argumentation in the public sphere. Deb8 and other related tools may, directly or indirectly, help encourage evidence-based debate and better political accountability.
9 ACKNOWLEDGMENTS
Ommitted for blind review. Thanks to the reviewers for their valuable time.
REFERENCES
[1] Pranav Anand, Marilyn Walker, Rob Abbott, Jean E. Fox Tree, Robeson Bowmani, and Michael Minor. 2011. Cats Rule and Dogs Drool!: Clas-sifying Stance in Online Debate. InProceedings of the 2Nd Workshop on Computational Approaches to Subjectivity and Sentiment Analysis (WASSA ’11). Association for Computational Linguistics, Stroudsburg, PA, USA, 1–9. http://dl.acm.org/citation.cfm?id=2107653.2107654 [2] Olfa Ben Ahmed, Gabriel Sargent, Florian Garnier, Benoit Huet,
Vin-cent Claveau, Laurence Couturier, Raphaël Troncy, Guillaume Gravier, Philémon Bouzy, and Fabrice Leménorel. 2017. NexGenTV: Provid-ing Real-Time Insight DurProvid-ing Political Debates in a Second Screen Application. InProceedings of the 2017 ACM on Multimedia Con-ference (MM ’17). ACM, New York, NY, USA, 1259–1260. https: //doi.org/10.1145/3123266.3127929
[3] Carlos Chesnevar, Jarred McGinnis, Sanjay Modgil, Iyad Rahwan, Chris Reed, Guillermo Simari, Matthew South, Gerard Vreeswijk, and Steven Willmott. 2006. Towards an Argument Interchange Format. The Knowledge Engineering Review21, 4 (2006), 293–316. https://doi.org/ 10.1017/S0269888906001044
[4] Helen Clark. 2000.The Worm that Turned: New Zealand’s 1996 General Election and the Televised ‘Worm’ Debates. Palgrave Macmillan UK, London, 122–129. https://doi.org/10.1057/9780230379602_7 [5] Jeff Conklin. 2003.Dialog Mapping: Reflections on an Industrial Strength
Case Study. Springer London, London, 117–136. https://doi.org/10. 1007/978-1-4471-0037-9_6
[6] Cycling ’74. 2018. Max Software Tools for Media | Cycling ’74. https: //cycling74.com/products/max
[7] Tim Dwyer, Yehuda Koren, and Kim Marriott. 2006. IPSep-CoLa: An incremental procedure for separation constraint layout of graphs.IEEE Transactions on Visualization and Computer Graphics12, 5 (2006), 821– 828.
[8] Martin Erwig, Karl Smeltzer, and Xiangyu Wang. 2017. What is a visual language?Journal of Visual Languages & Computing38 (2017), 9 – 17. https://doi.org/10.1016/j.jvlc.2016.10.005 SI:In honor of Prof SK Chang.
[9] F. Galton. 1907. Vox populi.Nature75, 1949 (1907), 7. https://doi.org/ 10.1038/075450a0
[10] Kiran Garimella, Gianmarco De Francisci Morales, Aristides Gionis, and Michael Mathioudakis. 2017. The Effect of Collective Attention on Controversial Debates on Social Media. InProceedings of the 2017 ACM on Web Science Conference (WebSci ’17). ACM, New York, NY, USA, 43–52. https://doi.org/10.1145/3091478.3091486
[11] Katerina Gorkovenko and Nick Taylor. 2016. Politics at Home: Second Screen Behaviours and Motivations During TV Debates. InProceedings of the 9th Nordic Conference on Human-Computer Interaction (NordiCHI ’16). ACM, New York, NY, USA, Article 22, 10 pages. https://doi.org/ 10.1145/2971485.2971514
[12] Naeemul Hassan, Chengkai Li, and Mark Tremayne. 2015. Detecting Check-worthy Factual Claims in Presidential Debates. InProceedings of the 24th ACM International on Conference on Information and Knowledge Management (CIKM ’15). ACM, New York, NY, USA, 1835–1838. https: //doi.org/10.1145/2806416.2806652
[13] Michael H. G. Hoffmann. 2015. Changing Philosophy Through Tech-nology: Complexity and Computer-Supported Collaborative Argu-ment Mapping.Philosophy & Technology28, 2 (01 Jun 2015), 167–188. https://doi.org/10.1007/s13347-013-0143-6
[14] Bernd Huber, Sarah Tausch, and Heinrich Hu. 2014. Supporting De-bates with a Real-time Feedback System. InCHI ’14 Extended Abstracts on Human Factors in Computing Systems (CHI EA ’14). ACM, New York, NY, USA, 2257–2262. https://doi.org/10.1145/2559206.2581281 [15] IBM. [n. d.]. i2 Analyst’s Notebook. https://www.ibm.com/us-en/
marketplace/analysts-notebook.
[16] Mathilde Janier, John Lawrence, and Chris Reed. 2014. OVA+: An argument analysis interface. InProceedings of the Fifth International Conference on Computational Models of Argument, Vol. 266. IOS Press, 463–564.
[17] Wesley M. Johnston, J. R. Paul Hanna, and Richard J. Millar. 2004. Advances in Dataflow Programming Languages.ACM Comput. Surv. 36, 1 (March 2004), 1–34. https://doi.org/10.1145/1013208.1013209 [18] Werner Kunz and Horst Rittel. 1970.Issues as elements of information
systems. Working paper no. 131. Center for Planning and Development Research.
1167 1168 1169 1170 1171 1172 1173 1174 1175 1176 1177 1178 1179 1180 1181 1182 1183 1184 1185 1186 1187 1188 1189 1190 1191 1192 1193 1194 1195 1196 1197 1198 1199 1200 1201 1202 1203 1204 1205 1206 1207 1208 1209 1210 1211 1212 1213 1214 1215 1216 1217 1218
1220 1221 1222 1223 1224 1225 1226 1227 1228 1229 1230 1231 1232 1233 1234 1235 1236 1237 1238 1239 1240 1241 1242 1243 1244 1245 1246 1247 1248 1249 1250 1251 1252 1253 1254 1255 1256 1257 1258 1259 1260 1261 1262 1263 1264 1265 1266 1267 1268 1269 1270 1271
ACM, New York, NY, USA, 285–294. https://doi.org/10.1145/2757226. 2757251
[21] Anders Sundnes Løvlie. 2017. From Playground to Salon: Challenges in Designing a System for Online Public Debate. InProceedings of the 21st International Academic Mindtrek Conference (AcademicMindtrek ’17). ACM, New York, NY, USA, 164–173. https://doi.org/10.1145/3131085. 3131111
[22] Mattias Mano, Jean-Michel Dalle, and Joanna Tomasik. 2018. The Consent of the Crowd Detected in an Open Forum. InProceedings of the 14th International Symposium on Open Collaboration (OpenSym ’18). ACM, New York, NY, USA, Article 14, 9 pages. https://doi.org/10. 1145/3233391.3233538
[23] Rolando Medellin-Gasque, Chris Reed, and Vicki Hanson. 2014. Older Adults Interaction with Broadcast Debates. InProceedings of the 16th International ACM SIGACCESS Conference on Computers & Accessibility (ASSETS ’14). ACM, New York, NY, USA, 269–270. https://doi.org/10. 1145/2661334.2661394
[24] Gonzalo Gabriel Méndez, Uta Hinrichs, and Miguel A. Nacenta. 2017. Bottom-up vs. top-down: trade-offs in efficiency, understanding, free-dom and creativity with InfoVis tools. InProceedings of the 2017 CHI Conference on Human Factors in Computing Systems (CHI ’17). ACM, New York, NY, USA, 13. https://doi.org/10.1145/3025453.3025942 [25] Gonzalo Gabriel Méndez, Miguel A. Nacenta, and Uta Hinrichs. 2018.
Considering Agency and Data Granularity in the Design of Visual-ization Tools. InProceedings of the 2018 CHI Conference on Human Factors in Computing Systems (CHI ’18). ACM, New York, NY, USA, 13. https://doi.org/10.1145/3173574.3174
[26] Gonzalo Gabriel Méndez, Miguel A. Nacenta, and Sebastien Vanden-heste. 2016. iVoLVER: Interactive Visual Language for Visualization Extraction and Reconstruction. InProceedings of the 2016 CHI Confer-ence on Human Factors in Computing Systems (CHI ’16). ACM, New York, NY, USA, 4073–4085. https://doi.org/10.1145/2858036.2858435 [27] Alex F Osborn. 1953. Applied imagination, principles and procedures
of creative thinking. (1953).
[28] Ayush Patwari, Dan Goldwasser, and Saurabh Bagchi. 2017. TATHYA: A Multi-Classifier System for Detecting Check-Worthy Statements in Political Debates. InProceedings of the 2017 ACM on Conference on Information and Knowledge Management (CIKM ’17). ACM, New York, NY, USA, 2259–2262. https://doi.org/10.1145/3132847.3133150 [29] Brian Plüss and Anna De Liddo. 2015. Engaging Citizens with Televised
Election Debates Through Online Interactive Replays. InProceedings of the ACM International Conference on Interactive Experiences for TV and Online Video. 179–184. https://doi.org/10.1145/2745197.2755521 [30] Eric D. Ragan, Alex Endert, Jibonananda Sanyal, and Jian Chen. 2016.
Characterizing Provenance in Visualization and Data Analysis: An Organizational Framework of Provenance Types and Purposes.IEEE Transactions on Visualization and Computer Graphics22, 1 (Jan 2016), 31–40. https://doi.org/10.1109/TVCG.2015.2467551
[31] Iyad Rahwan, Mohammed I. Madakkatel, Jean-François Bonnefon, Ruqiyabi N. Awan, and Sherief Abdallah. 2010. Behavioral Experiments for Assessing the Abstract Argumentation Semantics of Reinstatement. Cognitive Science34, 8 (2010), 1483–1502. https://doi.org/10.1111/j. 1551-6709.2010.01123.x
[32] Patrick C. Shih, David H. Nguyen, Sen H. Hirano, David F. Redmiles, and Gillian R. Hayes. 2009. GroupMind: Supporting Idea Generation Through a Collaborative Mind-mapping Tool. InProceedings of the ACM 2009 International Conference on Supporting Group Work (GROUP ’09). ACM, New York, NY, USA, 139–148. https://doi.org/10.1145/ 1531674.1531696
[33] Ben Shneiderman. 2000. Creating Creativity: User Interfaces for Sup-porting Innovation.ACM Trans. Comput.-Hum. Interact.7, 1 (March 2000), 114–138. https://doi.org/10.1145/344949.345077
[34] Simon J. Buckingham Shum, Albert M. Selvin, Maarten Sierhuis, Jeff Conklin, Charles B. Haley, and Bashar Nuseibeh. 2006. Hyper-media Support for Argumentation-Based Rationale. Springer Berlin Heidelberg, Berlin, Heidelberg, 111–132. https://doi.org/10.1007/ 978-3-540-30998-7_5
[35] Z. Skrba, B. O’Mullane, B. R. Greene, C. N. Scanaill, C. W. Fan, A. Quigley, and P. Nixon. 2009. Objective real-time assessment of walking and turning in elderly adults. In2009 Annual International Conference of the IEEE Engineering in Medicine and Biology Society. 807–810. https: //doi.org/10.1109/IEMBS.2009.5333934
[36] Chenhao Tan, Hao Peng, and Noah A. Smith. 2018. "You Are No Jack Kennedy": On Media Selection of Highlights from Presidential Debates. InProceedings of the 2018 World Wide Web Conference (WWW ’18). International World Wide Web Conferences Steering Committee, Republic and Canton of Geneva, Switzerland, 945–954. https://doi. org/10.1145/3178876.3186142
[37] Anthony Tang, Melanie Tory, Barry Po, Petra Neumann, and Sheelagh Carpendale. 2006. Collaborative Coupling over Tabletop Displays. In Proceedings of the SIGCHI Conference on Human Factors in Computing Systems (CHI ’06). ACM, New York, NY, USA, 1181–1190. https://doi. org/10.1145/1124772.1124950
[38] Alice Toniolo, Timothy J. Norman, Anthony Etuk, Federico Cerutti, Robin Wentao Ouyang, Mani Srivastava, Nir Oren, Timothy Dropps, John A. Allen, and Paul Sullivan. 2015. Supporting reasoning with different types of evidence in intelligence analysis. InProceedings of the Fourteenth International Conference on Autonomous Agents and Multiagent Systems.
[39] Frank van Ham, Fernanda B. Viegas, Jesse Kriss, and Martin Wat-tenberg. 2007. Talk Before You Type: Coordination in Wikipedia. In 2007 40th Annual Hawaii International Conference on System Sciences (HICSS’07)(HICSS), Vol. 00. 78a. https://doi.org/10.1109/HICSS.2007. 511