This is a pre-print version of the article
G.Y.H. Choong, C.Y. Lew and D.S.A. De Focatiis (2015), The Role of Processing History on the Mechanical and Electrical Behaviour of Melt-Compounded Polycarbonate - Multi-walled Carbon Nanotube Nanocomposites, Journal of Applied Polymer Science 132(8), 42277.
DOI: 10.1002/app.42277
The post-print can be found at http://dx.doi.org/10.1002/app.42277
The Role of Processing History on the Mechanical and Electrical Behaviour of
Melt-Compounded Polycarbonate - Multi-walled Carbon Nanotube
Nanocomposites
Choong, Gabriel Yew Hong1; Lew, Chun Yee2; De Focatiis, Davide Stefano Antonio1
1
Division of Materials, Mechanics, and Structures, Faculty of Engineering, University Of Nottingham, Nottingham, NG7 2RD, UK
2
Nanocyl S.A., Sambreville, B-5060, Belgium
Correspondence to: Choong, Gabriel Yew Hong(E-mail: [email protected])
ABSTRACT
This work investigates the effects of primary compounding temperature and secondary melt processes on the mechanical response and electrical resistivity of polycarbonate filled with 3 wt% multi-walled carbon nanotubes (CNT). Nanocomposites were melt compounded in an industrial setting at a range of temperatures, and subsequently either injection moulded or compression moulded to produce specimens for the measurement of electrical resistivity, surface hardness, and uniaxial tensile properties. Secondary melt processing was found to be the dominant process in determining the final properties. The effects observed have been attributed to structural
arrangements of the CNT network as suggested by morphological evidence of optical microscopy and resistivity measurements. Properties were found to be relatively insensitive to compounding temperature. The measured elastic moduli were consistent with existing micromechanical models.
INTRODUCTION
The increasing miniaturization of electronic consumer products makes conductive polymers
attractive for mass production. One important application area is packaging of sensitive
nanotubes (CNTs) are important candidate fillers, as they can both reinforce and add new
functionalities to polymeric base matrices. The opportunity to exploit the high stiffness and
strength of CNTs, in addition to their electrical conductivity, has been a subject of many
industrial and academic studies. The solid-state properties of such filled thermoplastics are
dependent on the processing history. The most widely used technique to disperse the filler
industrially is melt processing, consisting of a primary process such as
compounding/extrusion, and a secondary or forming process such as injection moulding or
compression moulding.
Prior to melt mixing with a polymer, initial “as-produced” CNT agglomerates are called
primary agglomerates, and consist of linear dimensions ranging from 1 m through to in
excess of 675 m, depending on the CNT manufacturer.1 The shear stress generated during
mixing is used to decrease the size of these agglomerates and to disperse them into the
melt. The difficulty in turning these primary agglomerates into well dispersed nanotubes
comes from the physical entanglements and van der Waals forces between the individual
CNTs.2 Re-agglomeration can also take place during melt processes, when the nanotubes
flocculate due to the same forces, and these are known as secondary agglomerates.
When the addition of filler to the matrix reaches a critical loading content, a continuous
conductive path is formed, resulting in an abrupt change in the material behaviour. This
loading content is identified as the percolation threshold. Electrical resistivity has been
electrical conductivity of thermoplastic-CNT nanocomposites during melt deformations was
investigated by Alig et al. using simultaneous rheology and electrical resistivity
measurements,5 and they postulated that there is competition between the shear-induced
destruction and formation of a CNT network. The same group also highlighted that
secondary agglomeration of CNTs is a thermally activated process, also demonstrated by
Jamali et al.6 under quiescent conditions, which can be accelerated by shear flow. It is this
same network that can provide the mechanical reinforcement of a CNT-thermoplastic
system, as well as the necessary electrical conductivity. However, achieving uniform CNT
dispersion in the matrix through polymeric melt processes remains challenging. If specific
electrical properties are required, then the filler concentration must be above the
percolation threshold, but this in turn increases the likelihood of CNT agglomeration. Hence,
there is a need to investigate how existing processing methods can be tailored to control
the final properties of percolated CNT-thermoplastic systems for conductive packaging
applications.
Several detailed studies on the influence of small batch mixing conditions on
polycarbonate-multi-walled carbon nanotubes (PC-MWCNT) have been reported in the literature.2,3,5,7,8
These provide insights into the complex mixing taking place during commercial processes,
although batch mixers have different flow conditions (stresses and velocity fields) to
extruders. In a percolated system, Kasaliwal et al. observed that an increase in mixing speed
resulted in a significant increase in macrodispersion (i.e. dispersion of CNT agglomerates at
a macroscopic scale), but in only minor changes to the levels of resistivity, regardless of the
network, and (2) the process of dispersing CNT primary agglomerates may occur via
different mechanisms.7
Both Pegel et al. and Kasaliwal et al. reported that a lower melt temperature (and hence
higher matrix viscosity) improves CNT dispersion.2,7 This implies that rupture of
agglomerates necessary to disperse the CNTs in the matrix is primarily controlled by matrix
viscosity. On the other hand, CNT network formation is enhanced by a matrix of lower molar
mass and by processing at higher temperature.9 The generally agreed view is that a CNT
network consists of weakly bonded clusters that break up and re-agglomerate to form a
conductive pathway during the application of shear, which suggests that the destruction of
CNT-CNT bonds is reversible.
The evidence in the literature points to an increasing electrical conductivity in
CNT-polymeric systems with increasing CNT agglomeration.2,5,9 Kasaliwal et al. observed in
PC-MWCNT (1 wt%) that low electrical resistivity is achieved when the mean diameter of
undispersed agglomerates is less than 100 m, with most agglomerates in the range of
1 - 10 m.10 In contrast to this, the enhancement of mechanical properties of the same
systems arises from the presence of well dispersed individual CNTs, from their outstanding
tensile properties, and from the large surface to volume ratio of individual tubes. Isolated
nanotubes increase the CNT surface area available for wetting by the matrix, leading to an
increase in CNT-matrix interaction, and facilitates efficient load transfer from the matrix to
a CNT network structure, improvements in mechanical properties are achieved with good
dispersion of individual CNTs in the matrix.
Injection moulding (IM) is a conventional process used to produce high volumes of complex
parts, as required in the electronics packaging industry. Several studies have been
performed to understand the complex effects of IM parameters on the final properties of
percolated PC-CNT nanocomposites.11-14 These all agree that melt temperature and injection
velocity has a significant role in determining the electrical behaviour, and highlight the
effect of a skin layer in which oriented CNTs were observed and a disrupted filler network
could be inferred through an increase in electrical resistivity.5,11,13,15 Compression moulding
is generally a lower volume production method, but is preferred to enhance electrical
properties because the timescales involved promote the build-up of an isotropic CNT
network structure. This was observed by Kasaliwal et al. who studied and observed the
effects of pressing speed, pressing time and melt temperature on 1 wt% PC-MWCNT, but no
significant influence on percolated 2 wt% PC-MWCNT.7
The effect of compounding parameters in an industrial setting on CNT thermoplastic
systems have not been investigated in detail, perhaps understandably due to the
significance of thermal and shear history of secondary process on final properties of a
nanocomposite part. Commercially, nanocomposites are frequently delivered as
compounded granulated feedstock to manufacturers, who re-melt the granules using
secondary agglomerates from initially dispersed MWNTs can decrease electrical resistivity.2
However, in Jamali et al.’s study on a well dispersed MWCNT-filled polypropylene (PP)
system that was subsequently heated and re-processed, extensive re-agglomeration was
observed with particle analysis, that eventually led to a rise in electrical resistivity.6 Hence,
feedstock compounders play a role in the dispersion of the primary agglomerates that may
influence secondary agglomeration in the forming process. In 2010, Mack et al. varied
extrusion screw speed, throughput and screw configuration during compounding of
PC-MWCNT, and subsequently injection moulded specimens to shape.16 They found that the
extrusion parameters did not significantly affect either the electrical resistivity of PC filled
with >1 wt% CNT or the mechanical properties (tensile properties and impact strength) of
PC filled with <5 wt% CNT.
Most of the research on PC-MWCNT to date has been focused primarily on materials
produced in laboratory environments using small scale laboratory extruders. This work is
instead focused on materials produced using industrial scale equipment, and separately
explores the roles of compounding temperature, Tc (used to produce feedstock), and of the
type of the secondary moulding process (that dictates the final bulk properties) on a typical
percolated PC-CNT system. As will be shown, it is the type of secondary melt process that
dominates the final electrical and mechanical properties. The same properties are
somewhat insensitive to variations of temperature in the primary compounding process.
This suggests that there is flexibility in industrial process parameters for compounding the
feedstock to cater for the demands of products produced by different secondary melt
EXPERIMENTAL
Materials
The matrix polymer used was Makrolon 2205 (Bayer Material Science AG, Germany), a low
viscosity grade polycarbonate (PC) with a melt flow index (MFR) of 37 g 10 min-1 and glass
transition temperature (Tg) of ~146 °C.17 The nanotubes used were Nanocyl NC7000
multi-walled CNTs, manufactured by Nanocyl S.A., via a catalytic chemical vapour deposition
process. Nanotubes have a mean outer diameter of 10 ± 3 nm, a median length of
1300 nm and primary agglomerate sizes of 675 m and above.1,18
Specimen preparation
Nanocomposite compounding
A range of PC-MWCNTs were melt compounded by Nanocyl S.A. using an Industrial Leistritz
ZSK-27 MAXX co-rotating twin-screw extruder with a proprietary screw profile with a length
to diameter ratio of 48:1. MWCNTs were gravimetrically fed into the PC melt through a
twin-screw side feeder, at a nominal mass fraction of 3 wt% for all PC resins. The extrusion
screw speed was fixed at 300 rpm and Tc, determined at the barrel, varied between 230 °C
and 290 °C in 10 °C increments. The extrudate was pelletised using a standard industrial
rotary gear cutter adjusted to run at speed of 30 rpm to cut the extrudate into
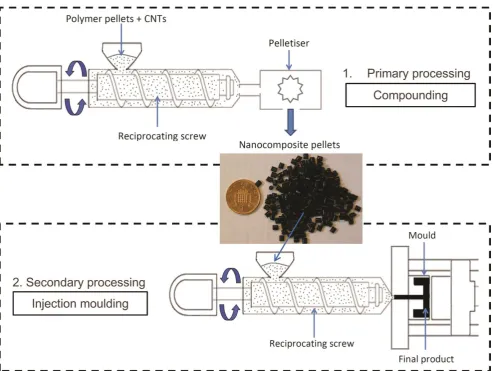
processes. Figure 1 illustrates the two stage process of compounding (primary process) and
of forming (secondary process) employed for the materials in this study.
FIGURE 1 Schematic diagram of the primary (compounding) and the secondary process (injection-moulding shown) applied to the polycarbonate filled with 3 wt% multi-walled carbon nanotubes used in this study. The other secondary process used was compression-moulding (not shown).
Compression moulding
Part of the compounded nanocomposite granules were dried in an air-circulating oven at
80 °C for a minimum of 8 h prior to compression moulding (CM). Dumb-bell shaped
specimens of dimensions 75 mm x 5 mm x 2 mm, corresponding to type 1BA of the British
Standard BS EN ISO 527-2:2012,19 were compression moulded using a Daniels heated press
[image:8.595.59.553.134.505.2]design of mould eliminates post-moulding specimen preparation. Moulding was performed
at 250 °C. The procedure consisted of a warm up period, a 5 minute stage where pressure
was applied and released repeatedly to dislodge any trapped air, holding for a further
5 minutes at the moulding temperature to allow relaxation of the polymer, and a cooling
stage where cold water is flushed through channels in the heated platens, producing a
repeatable cooling rate of ~20 °C min-1 through to a temperature sufficiently below Tg.
Injection moulding
Another part of the compounded granules was used in injection moulding, using an Engel
Victory 80 (after drying) with the parameters given in Table 1. Dumb-bell shaped specimen
moulds were employed in accordance with ASTM D638 (approximate dimensions 150 mm x
10 mm x 4 mm). The linear dimensions of the IM specimens are twice those of the CM
[image:9.595.79.292.497.646.2]specimens.
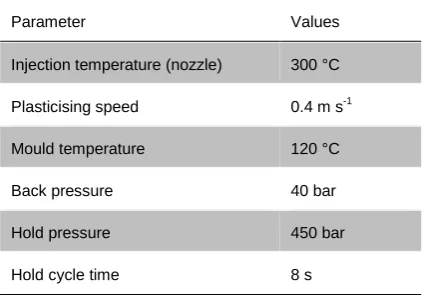
TABLE 1 Injection moulding conditions for PC-MWCNT (3 wt%)
Parameter Values
Injection temperature (nozzle) 300 °C
Plasticising speed 0.4 m s-1 Mould temperature 120 °C
Back pressure 40 bar
Hold pressure 450 bar
Hold cycle time 8 s
Optical microscopy
Macrodispersion of CNT agglomerates formed after primary and secondary processing was
a RMC PT-PC PowerTomes ultramicrotome with a glass knife. Representative sections from
both secondary processes were obtained from the cross-sections of the gauge lengths of the
tensile bars to study the core region morphology. Optical microscopy investigations were
conducted using an Olympus BX 51 transmission microscope fitted with a 10x objective and
a Q-imaging camera was used to record the images.
In order to quantify the morphology of the specimens, digital image processing was used to
apply background corrections and to decrease the influence of defects (e.g. scratches) from
sectioning. Image processing was performed with ImageJ software following the procedure
proposed by Pegel et al.21 In addition, sections of the images that included obvious artefacts
persisting after the binarisation and the application of a morphological filter were removed
manually. This process therefore allows particle identification of all agglomerates with areas
of 7.9 m2 and above, equivalent to perfectly circular particles with a diameter greater than
~3 m. ImageJ was also used to perform particle analysis. The cumulative area of images
evaluated for each secondary process was above 3 mm2, and a minimum of 5 sections were
taken along the length of each tensile bar.
Macrodispersion of the CNT agglomerates was calculated as an index based on a method
developed for the rubber industry, and previously employed for several MWCNT-filled
thermoplastic systems.7,22,23 The macrodispersion index D is expressed as
/ 0
1 A A 100%
D f
v
where A A/ 0 is the ratio of the accumulated area of agglomerates to the total micrograph
area, known as the agglomerate area fraction; f is the packing density of CNTs (a value of
0.25 is employed following literature for CNTs 7,22,23), and v is the volume fraction of the
filler (assuming a CNT density of 1.75 g cm-3). When A A/ 0surpasses 8.4% for a CNT loading
content of 3 wt% (2.1 vol%), then D becomes zero, implying the worst possible state of
dispersion. D = 100% implies that no agglomerates ≥7.9 m2 are visible, and hence
represents a state of well dispersed CNTs.
Electrical resistivity measurements
Volume resistivity of PC-MWCNT specimens were measured using an in-house two-terminal
fixture with spring-loaded terminal contacts.24 Contacts are made of conductive
carbon-filled silicone (Laird Technologies C5-9134) to promote intimate contact with the rigid
surfaces of the specimens. The spring-loaded contacts applied a constant pressure of 70 kPa
at each end of the specimen.
Contact resistivity, c, was determined by means of the extrapolation method using surface
terminal contacts.25 The method involves measuring the voltage distribution along a
constant cross section of a rectangular bar (100 mm x 6 mm x 1 mm) and determination of
the contact resistance,Rc, by extrapolation of the voltage to zero contact spacing, thus
In order to perform a comparative study between CM and IM specimens, the voltage per
unit length was fixed at 143 V m-1. A constant voltage was applied for 20 s using the built-in
voltage source of a Keithley 6517B electrometer, during which time the current was logged
using the same instrument. The volume resistivity, ρ, is obtained from the time-averaged
volume resistance, Rv, as ρ = RvA/d, where A is the specimen cross sectional area and d is the
distance between the terminals. Five specimens were measured for each forming method
and each Tc. All measurements were performed at ambient temperature and corrected for
contact resistance.
The Tietjen-Moore’s outlier test26 was used to detect and remove small numbers of outliers
in the experimental data at a 5% significance level. Error bars shown in the results represent
two standard errors. The same specimens were employed for electrical resistivity followed
by indentation and tensile testing.
Mechanical measurements
The Vickers hardness method (HV) was employed to determine the surface hardness of the
specimens. The procedure employs a diamond pyramidal indenter with a square base. A
minimum of four indentations were performed on the grip area of each dumb-bell shaped
specimen, giving a total of 20 measurements for each forming method and Tc. A load of
5 kgf was applied for 15 s, typically yielding a penetration of ~0.16 mm. The hardness was
calculated as the arithmetic mean of the diagonal lengths of the indentations measured
indentation diagonal lengths ld from the edge of each specimen, and the distance between
repeated indentations was at least 3ld.
Tensile testing was performed at room temperature using an Instron 5968 equipped with
5 kN load cell. Tests were performed to failure at a fixed strain rate of 5.56 x 10⁻⁴ s-1,
corresponding to cross head speeds of 1 mm min-1 and 2 mm min-1 for CM and IM
specimens respectively. Due to the difference in gauge lengths between CM and IM
specimens, strain was measured using either a 25 mm or a 50 mm gauge length clip-on
extensometer accordingly. Five specimens were tested for each forming method and Tc.
Young’s modulus, E,was determined by linear regression between 0.1-0.45% strain for
nanocomposites, and between 0.1-1.0% for CM unfilled PC. Unfilled IM PC bars were not
available for analysis.
RESULTS AND DISCUSSION
Morphology of specimen core region after secondary melt processing
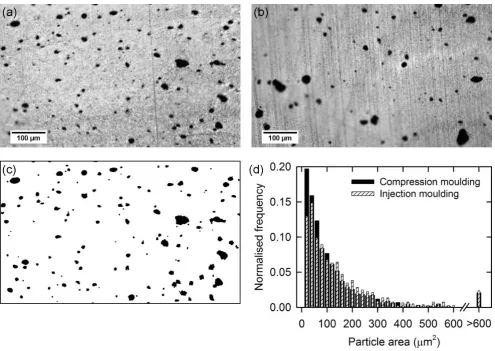
Figures 2(a) and 2(b) show representative optical micrographs of the cross-section of
PC-MWCNT (3 wt%) CM and IM tensile bars respectively. An example of the binary image
used for particle identification is shown in Figure 2(c), corresponding to the micrograph
from Figure 2(a). Agglomerates of various sizes can be seen in both micrographs. Figure 2(d)
shows a normalised frequency histogram of particle area. IM sections have generally a
higher number of particles with areas of more than 120 m2 compared to CM sections. The
mean particle areas are 130.3 ± 18.7 m2 and 150.8 ± 21.2 m2 for CM and IM sections
The average macrodispersion index D calculated using Equation 1 is 33% for CM sections,
whereas for IM sections it is 70%. This indicates that IM bars have a better state of CNT
agglomerate dispersion at a scale of <7.9 m2 when compared to CM specimens.
FIGURE2 Optical micrographs of PC-MWCNT (3 wt %) sections (t = 2 m) obtained from the gauge length of (a) compression moulded and (b) injection moulded tensile bars. Background correction and binarisation of (a) produces image (c). Normalised frequency histogram of particle area for all micrographs of CM and IM samples (d).
Electrical Resistivity
Figure 3 presents the volume resistivities of CM and IM bars as a function Tc. Two CM
specimen measurement outliers and three IM specimen outliers were rejected from the
[image:14.595.58.554.196.547.2]bars is consistently lower than that of IM bars by one order of magnitude. The overall
average ρ of CM and IM PC-MWCNT 2205 across Tc are 1.26 ± 0.28 Ω m and
12.20 ± 1.62 Ω m respectively.
FIGURE3 Electrical volume resistivity of PC-MWCNT 2205 (3 wt%) compounded at temperatures between 230 °C and 290 °C, and subsequently formed to shape by compression moulding and injection moulding.
The order of magnitude difference in resistivity between IM and CM specimens can be
explained by considering the timescales available for CNT re-agglomeration.7 Flocculation
experiments (oscillatory shear at fixed frequency under isothermal conditions) have shown
that the formation of the CNT network in PC melts evolves with time.27 The increased time
for relaxation in the flash mould at relatively high temperature allows the formation of a
more percolated network in the CM bars, resulting in lower resistivity levels relative to IM
bars. Polymer mobility was shown by the present authors to be the dominant relaxation
mechanism in these nanocomposites, and therefore can be associated with the greater
Kasaliwal et al. hypothesized three different percolated structure arrangements for low
electrical resistivity: (1) cluster-cluster percolation, (2) combination of small agglomerates
and dispersed CNTs, and (3) a network of well-dispersed CNTs.8 The systems in this work
exhibit morphology and properties indicative primarily of arrangement (2), but with
different degrees of agglomeration and dispersion. Figure 4 shows two such plausible
morphologies based on evidence from both the micrographs in Figure 2 and the electrical
measurements, with Figure 4(a) representing the IM morphology (D=70%) and Figure 4(b)
the CM morphology (D=33%). Although the IM morphology displays a better dispersion
index, its larger agglomerates are less well connected and give rise to a higher electrical
resistivity when compared to the CM morphology. To a lesser degree, within an IM process,
CNT orientation has been observed in transmission electron micrographs13,15, and the
conductive network was reported as disrupted.11,13,14 These effects lead to the formation of
a skin layer with increased resistivity relative to the bulk.
FIGURE4 An illustration of structural arrangements of CNT agglomerates with different levels of dispersion and percolation: (a) larger agglomerates with fewer inter-cluster connections (and hence a less conductive network); and (b) smaller agglomerates with more inter-cluster connections (and hence a more conductive network).
The resistivity values obtained in this work are consistent with those measured by Spikowski
and Kunzelman28 on CM specimens of a comparable nanocomposite system using a similar
reported by Mack et al. on similar IM specimens16, as shown in Table 2. It is worth noting,
however, that in IM specimens differences of up to 10 orders of magnitude in resistivities
[image:17.595.67.472.211.376.2]have also been reported in the literature on comparable PC-MWCNT (3 wt%) systems.
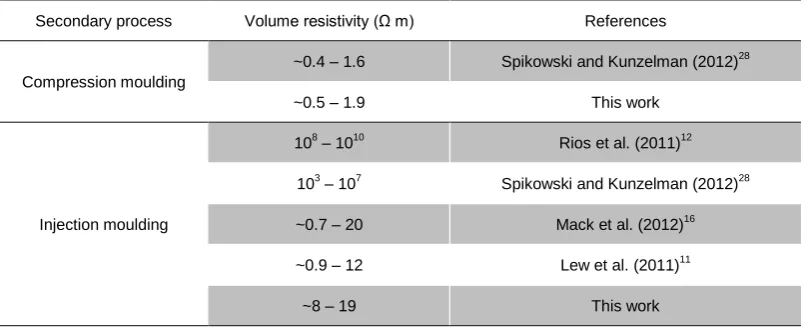
TABLE 2 Literature values of electrical resistivity of PC-MWCNT (3 wt%) determined with the two terminal method and comparison with this work
Secondary process Volume resistivity (Ω m) References
Compression moulding
~0.4 – 1.6 Spikowski and Kunzelman (2012)28
~0.5 – 1.9 This work
Injection moulding
108 – 1010
Rios et al. (2011)12 103 – 107 Spikowski and Kunzelman (2012)28 ~0.7 – 20 Mack et al. (2012)16 ~0.9 – 12 Lew et al. (2011)11
~8 – 19 This work
The same trend of an increase in resistivity with Tc followed by a decrease at 280 °C and an
increase at 290 °C was observed by Lew et al.29 on nanocomposite extrudate compounded
at identical temperatures as investigated here. The magnitudes of the resistivity values
measured by Lew et al. differ to those measured here, which could be due to differences in
the resistivity measurement techniques, and in the secondary processing. The same group
found that compounding at 280 °C and 290 °C yielded the highest and lowest shear
viscosities respectively, for the range of shear rates between 100 and 5000 s-1 (and hence
relevant to primary and secondary processing), although the variation was not very
significant.29 They reported that the lowest electrical resistivity occurs with the highest
shear viscosity, suggesting that at high shear viscosity the stress breaks-up the initial
primary MWCNT agglomerates into smaller agglomerates, most likely via a rupturing
Other studies have also found electrical resistivity to be relatively insensitive to
macrodispersion. Jamali et al. found that re-processing a PP-MWCNT (4 wt%) at a high
shear rate (3000 s-1) after a quiescent hold increased both CNT macrodispersion and
electrical conductivity independently of the initial compounding shear rate (100 and
3000 s-1).6 Here resistivity decreased to a plateau even when increasing re-processing
residence time that produced a higher macrodispersion. Similarly, Kasaliwal et al. observed
only small changes (one order of magnitude) in the volume resistivity with macrodispersion
indices D of ~30% and ~70% (for a percolated PC-MWCNT 1 wt % system).7 These
macrodispersion indices and changes in resistivity are consistent with those reported in this
work.
Overall, resistivity was not significantly affected by variation in the Tc, in both secondary
processes. This is in contrast with the work of Kasaliwal et al. who reported that high
temperatures are favourable for obtaining lower resistivity, when mixing in a laboratory
extruder.7 They observed a reduction of 10 orders of magnitude in ρ as Tc increased from
240 °C to 260 °C in CM PC-MWCNT (1 wt%). This suggests that their systems changed from
unpercolated to percolated as a consequence of the effect of Tc on the reduced CNT loading.
In our study, all systems are percolated independently of variations in Tc and in secondary
process, consistent with the reported percolation threshold of 0.5-2.0 wt%.3,4
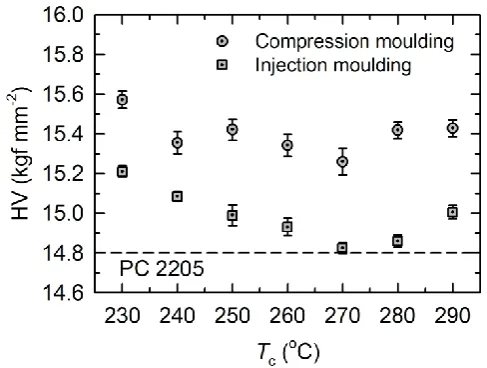
Figure 5 reports measurements of Vickers hardness as a function of Tc for both IM and CM
specimens. Hardness of CM specimens is systematically higher than that of
injection-moulded specimens, by 1-3%.
FIGURE 5 Vickers hardness of compression moulded and injection moulded PC-MWCNT 2205 compounded at temperatures between 230 °C and 290 °C. The dashed line represents the Vickers hardness of unfilled compression moulded PC 2205.
The overall average of HV for CM specimens is 15.4 ± 0.1 kgf mm−2, and for IM specimens is
15.0 ± 0.2 kgf mm−2. All IM bars recorded a lower hardness than the equivalent CM
nanocomposites. Although these differences are not highly significant, they are likely due to
the less well-established nanotube network in IM specimens near the surface (i.e. a skin
layer),, where other studies have observed oriented individual CNTs.13,15
All the nanocomposite bars, regardless of the type of secondary process, produced higher
HV than the unfilled CM PC 2205, measured as 14.8 ± 0.1 kgf mm−2; although this difference
is again minor (1-4%). This increase in HV is attributed to the presence of CNTs that stiffen
[image:19.595.178.422.167.351.2]PC-MWCNT (3wt %), relative to the unfilled material, in a similar but not identical material and
process.30 The smaller hardness difference in this study could be attributed to (1) poor
interfacial bonding between the CNTs and the polymer chains resulting in ineffective stress
transfer, and (2) agglomeration of the CNTs leading to soft matrix-rich regions. Such CNT
agglomerates are clearly visible in Figures 2(a) and 2(b).
Tensile Properties
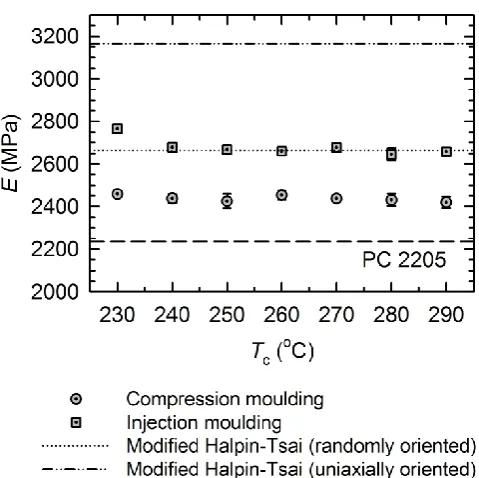
The effect of Tc on elastic modulus is presented in Figure 6 for both IM and CM specimens.
The moduli of IM specimens are consistently higher than those of CM specimens for the
range of Tc investigated. The moduli of CM specimens range between 2420 MPa and
2459 MPa, and those of IM specimens between 2645 MPa and 2765 MPa, corresponding to
a difference of 5% between minimum and maximum measured values within each set. The
modulus of unfilled CM PC was measured as 2236 ± 2 MPa. The addition of CNTs increased
FIGURE 6 Young’s moduli of compression moulded and injection moulded PC-MWCNTs 2205 compounded between 230 °C and 290 °C. The dashed line represents the unfilled compression moulded PC 2205. The dotted line represents Thostenson and Chou’s31 modified Halpin-Tsai equation for randomly oriented CNTs whereas the dot-dot-dash line represents Gojny et al.’s32 modified Halpin-Tsai equation for perfectly oriented CNTs.
The presence of stiff nanotubes within the nanocomposite contributes to the observed
increase in modulus. In IM specimens, the additional increase relative to CM specimens
could be attributed to (1) the frozen-in orientation of the polymer chains, (2) the orientation
of the CNTs and (3) a different macrodispersion index D. We rule out polymer chain
orientation as its effects on IM PC are small.33
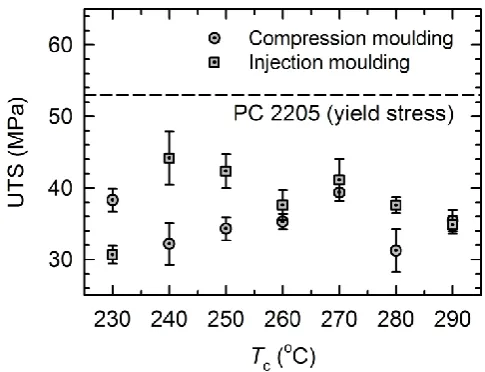
The effects of Tc on the ultimate tensile strength (UTS) are presented in Figure 7 for both IM
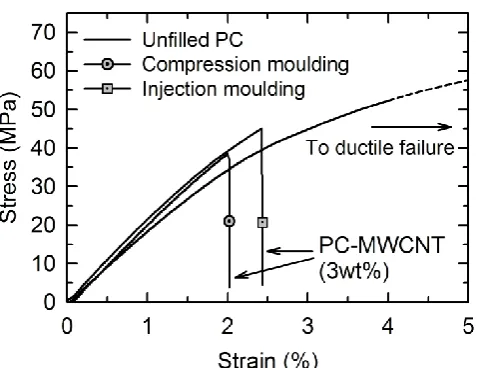
and CM specimens. All nanocomposite specimens failed by brittle fracture while the stress
was still rising, regardless of Tc or forming method, as shown in the representative
stress-strain curves in Figure 8. This is in sharp contrast to the unfilled PC which deforms in a
[image:21.595.178.418.65.304.2]failure at large strains.33 The micrographs in Figure 2 and those published by one of the
authors on identical PC-MWCNT (3 wt%)11 suggest that significant agglomeration is present
in these materials. The CNT agglomerates reduce the surface area of CNTs in contact with
the polymer matrix, thus decreasing stress transfer efficiency, and may act as stress
concentrators initiating fracture.
With the exception of the lowest and highest Tc, IM specimens failed at higher stresses than
CM specimens, although differences are not large. Average UTS of CM and IM samples are
35.2 ± 1.7 MPa and 38.3 ± 2.2 MPa respectively, whereas the average yield stress of unfilled
[image:22.595.175.418.391.577.2]CM PC is 53.0 ± 5.8 MPa.
FIGURE 8 Representative stress-strain curves of compression moulded and injection moulded PC-MWCNT 2205 and unfilled compression moulded PC 2205.
Correlation between Mechanical Response and Electrical Resistivity
To different degrees, solid-state properties of the nanocomposites were affected by both
the primary process (through Tc) and by the type of secondary process (IM or CM). The
effect of the secondary process is more apparent, and primarily due to the different
timescales involved for the formation of the nanotube network. The effect of the primary
process can appear to be overshadowed by the secondary process. For this reason, linear
correlations between pairs of solid-state properties were investigated separately for IM and
CM specimens.
The correlation coefficient, R, was determined between sets of pairs of measurements of
resistivity, hardness, modulus and UTS carried out on the same test specimens. Although
none of the correlations are particularly strong, the most significant are between resistivity
(considered on a logarithmic scale) and hardness for CM specimens, and between elastic
modulus and hardness for IM specimens. These correlation plots and correlation regression
lines are shown in Figures 9 and 10 respectively. All other variables yielded weaker
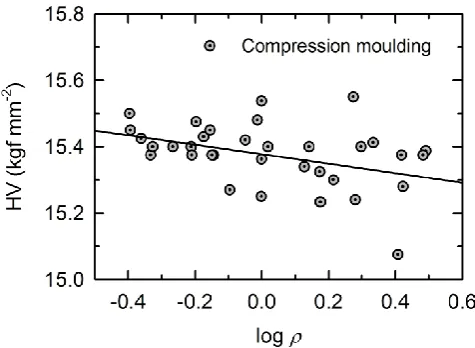
FIGURE 9 Relationship between surface hardness and log electrical resistivity for compression moulded specimens, with linear regression, giving a correlation coefficient R = -0.40
FIGURE 10 Relationship between Young’s modulus and surface hardness for injection moulded specimens, with linear regression, giving a correlation coefficient R = 0.52
Figure 9 shows a slightly negative correlation between hardness and log resistivity in CM
specimens, with R = -0.40. During CM, the extended relaxation times promote not only the
formation of CNT agglomerates, but also a wider distribution of agglomerate size. The
nature of this distribution will depend somewhat on the initial state of dispersion; since our
PC-MWCNT systems are percolated, it is more favourable for the agglomerate size to
matrix rich regions (i.e. lower hardness) and less conductive pathways (i.e. greater
resistivity).
There is a small positive correlation between elastic modulus and surface hardness in IM
specimens (R = 0.52), as shown in Figure 10. As observed in the literature for similar
nanocomposites, the highest degree of CNT orientation during IM occurs on the surfaces of
the moulded part.13,15 Hardness can be interpreted as a measure of the residual plastic
deformation after indentation, whereas modulus refers to the recoverable elastic stiffness.
A nanocomposite system with a greater degree of CNT alignment near the surface
contributes to a higher stiffness in the flow direction. Consider an indentation perpendicular
to an individual CNT aligned along the flow direction: the CNT will appear more compliant
since it is subjected to bending perpendicular to its axis. Surprisingly, Figure 9 shows the
opposite effect: a positive correlation between E and HV. This could be explained since
hardness is a record of only the plastic deformation: a greater hardness may be a sign of a
greater elastic recovery for a given maximum indenter position. It is plausible to assume
that bending CNTs will produce lower stress concentrations in the matrix than axially
loading CNTs, and thus lead to a more elastic indentation that produces a smaller indent (i.e.
greater hardness). Therefore increasing orientation in the flow direction could produce a
material with both a stiffer axial modulus and a greater hardness in the perpendicular
direction. Separate analysis of the indent diagonals in perpendicular directions was not able
to resolve anisotropy of hardness, as might have been produced from flow-induced
orientation of the nanofiller. At present no other explanation is offered for this weak
Application of models for the prediction of elastic modulus
Micromechanical modelling is a commonly used technique to predict the modulus of
traditional fiber reinforced composite systems. Several studies have approached
nanocomposites in a similar manner, considering both randomly oriented and perfectly
oriented nanotubes. Typically the filler particles are treated as solid cylinders or rods in
macrofiber models. Since multi-walled CNTs are hollow structures consisting of concentric
cylinders of graphene, Thostenson and Chou modified the classical Halpin-Tsai equation for
unidirectional fiber-reinforced composites to account for this by assuming that the outer
CNT wall alone supports stress.31 They expressed the modulus of a nanocomposite with
perfectly aligned CNTs as
CNT L CNT CNT matrix L CNT CNT CNT matrix L CNT CNT matrix 2 1 1 4 2 l V d E E V E d E t E l E t (2)where the CNT outer diameter is dCNT, the length is lCNT, the thickness of the outer wall is t,
the volume fraction of CNTs is VCNT, and ECNT and Ematrix are the moduli of the nanotube
and matrix respectively. Thostenson and Chou showed that this equation was in agreement
with experimental measurements of modulus in stretched polystyrene-MWCNT films at
both 5 wt% and 10 wt% loading, and that the elastic modulus was particularly sensitive to
CNT diameter.
The modified Halpin-Tsai equation was applied to obtain an estimate of modulus for the
from CM PC 2205), ECNT= 450 GPa,34 lCNT = 418 nm and dCNT = 10 nm;18 and VCNT = 0.021
(determined using CNT= 1.75 g cm−3). Using these values in Equation 2 produces a modulus
of 3166 MPa. This is indicated by a dot-dot-dash in Figure 6 for comparison with IM
materials. The average modulus for IM specimens was 2679 ± 17 MPa. The model
overestimates the modulus by ∼18%. Other systems have been compared to the modified
Halpin-Tsai, which was found to either agree with or to overestimate the experimentally
measured modulus.35 An overestimation is to be expected since it is nearly impossible to
obtain an injection-moulded specimen with perfectly aligned nanotubes.
Another possible explanation for the discrepancy is an overestimate of nanotube length – it
is well known that a reduction in length (i.e. damage) occurs during melt compounding.
Keeping other parameters constant, a length of 94.4 nm would produce the experimentally
measured modulus – this would represent a decrease of ∼77% relative to the original length
value reported by Krause et al.18 after extrusion. This is plausible considering different
extruders and extrusion parameters were employed in the two studies. An alternative
explanation is that the worm-like nature of CNTs results in shorter effective lengths when
applied to a model that accounts for straight rod-like reinforcement. Finally, the model
assumes perfect adhesion between polymer and filler. This is also unlikely since no CNT
surface modification was employed in this work.
Gojny and co-workers32 adapted Thostenson and Chou’s approach to predict the modulus of
CNT L CNT T CNT CNT matrixL CNT T CNT
CNT CNT matrix T CNT CNT matrix 2 1 1 2 3 5
8 1 8 1
4 2 l V V d E E V V E d E t E d E t (3)
where Lis as in Equation 2. They reported good agreement between predicted and
experimentally measured modulus for epoxy-CNT nanocomposites 0.1 wt%, but an
overestimation with 1.0 wt%.
Equation 3 is employed on the materials used in this study, producing a modulus of
2664 MPa. This is shown as a dotted line in Figure 6. The value is ∼10% higher than the
average experimentally measured modulus of CM specimens, of 2412 ± 24 MPa. The
discrepancy is likely due to invalid assumptions of uniformly dispersed fillers and perfect
filler-matrix interface. In addition, the presence of small voids was identified in polished
surface micrographs of both IM and CM specimens (not shown here).
Since IM specimens have a combination of aligned CNTs near the surface and more
randomly oriented CNTs in the core, one may consider Thostenson and Chou’s equation as
an upper bound and Gojny’s equation as a lower bound for the prediction of elastic modulus
in IM specimens. The measured modulus of IM specimens is within this range, although the
close proximity of the measured modulus to the lower bound suggests that, in the absence
CONCLUSIONS
This work has investigated the effect of primary Tc and of secondary process on solid-state
properties of percolated PC-MWCNT (3 wt%) nanocomposite systems, compounded and
injection-moulded in a commercial setting.
Resistivity of CM specimens was found to be an order of magnitude lower than that of IM
specimens. This is consistent with a time-dependent build-up of a CNT network, most likely
driven by polymer mobility, that forms structural arrangements of connected CNT
agglomerates with varying degrees of conductive pathways. The influence of the secondary
process on the morphology of PC-MWCNT was evidenced by the quantification the state of
CNT dispersion from optical micrographs, using particle size analysis leading to a
macrodispersion index D. From this, it was determined that CM produced smaller
agglomerates with greater inter-cluster interactions than IM, and hence a greater number of
conductive pathways. The presence of these multiple pathways, expected in percolated CNT
systems, contributes to the lack of a significant change in resistivity as a function of Tc.
Young’s moduli of IM specimens were consistently higher than those of CM specimens. No
significant changes in modulus were observed with variations in Tc. The presence of CNTs
stiffened the base matrix and changed the mode of failure from ductile in unfilled PC to
brittle. The modulus of IM PC-MWCNT is within the range predicted by the modified
Halpin-Tsai equations assuming randomly oriented and perfectly oriented CNTs. The modulus of
CM PC-MWCNT is 10% lower than that predicted due to the greater degree of CNT
Variations in both surface hardness and tensile strength with secondary processes and Tc
were minor. The addition of CNTs to unfilled PC increases hardness by up to 4%. Hardness of
IM specimens was ~3% lower than of CM specimens, likely due to the less established CNT
network achieved in IM specimen surfaces. The moderate increases in hardness are
attributed to ineffective filler-matrix stress transfer and matrix-rich regions. These same
factors lead to the change in failure mechanism from ductile to brittle relative to unfilled PC,
since CNT agglomerates may act as stress concentrations.
Examination of linear correlations between the solid-state properties generally yielded weak
correlations. The most significant were: between hardness and resistivity for CM materials
(negative), and between modulus and hardness (positive) for IM materials. The first was
attributed to the distribution of filler agglomerates, with a greater number of matrix-rich
regions giving rise to a lower hardness and conductivity. The second may be due to
flow-induced orientation of nanotubes near the surface, as observed by other authors.
In summary, the findings suggest that the secondary process plays the crucial role in
tailoring the final properties. The difference is primarily due to the timescales available for
CNT agglomeration experienced in the secondary processes. High electrical conductivity is
achieved with a time-dependent build-up of a CNT network, rendering fast industrial
production of conductive nanocomposites a challenge. The changes in Tc had only a limited
effect on the final properties, and this is widely attributed to the percolated nature of the
materials studied here. Although this may be a useful lack of sensitivity for industrial
processes, it is worth bearing in mind that primary processes play a greater role in
REFERENCES
1. Krause, B., Mende, M., Pötschke, P. and Petzold, G. Carbon2010, 48, 2746-2754.
2. Pegel, S., Pötschke, P., Petzold, G., Alig, I., Dudkin, S. M. and Lellinger, D. Polymer2008, 49, 974-984.
3. Pötschke, P., Bhattacharyya, A. R., Janke, A., Pegel, S., Leonhardt, A., Täschner, C., Ritschel, M., Roth, S., Hornbostel, B. and Cech, J. Fullerenes, Nanotubes, Carbon Nanostruct.2005, 13, 211-224.
4. Bauhofer, W. and Kovacs, J. Z. Compos. Sci. Technol.2009, 69, 1486-1498.
5. Alig, I., Pötschke, P., Lellinger, D., Skipa, T., Pegel, S., Kasaliwal, G. R. and Villmow, T. Polymer
2012, 53, 4-28.
6. Jamali, S., Paiva, M. C. and Covas, J. A. Polym. Test.2013, 32, 701-707.
7. Kasaliwal, G., Göldel, A. and Pötschke, P. J. Appl. Polym. Sci.2009, 112, 3494-3509. 8. Kasaliwal, G. R., Villmow, T., Pegel, S. and Potschke, P. InPolymer - carbon nanotube
composites: preparation, properties and applications; McNally, T.; Potschke, P., Eds.; Woolhead publishings Cambridge, 2011; p 92 - 132.
9. Zeiler, R., Handge, U. A., Dijkstra, D. J., Meyer, H. and Altstädt, V. Polymer2010, 52, 430-442. 10. Kasaliwal, G. R., Pegel, S., Göldel, A., Pötschke, P. and Heinrich, G. Polymer2010, 51,
2708-2720.
11. Lew, C. Y., Dewaghe, C. and Claes, M. InPolymer - Carbon Nanotube Composites: Preparation, Properties and Applications; McNally, T.; Ptschke, P., Eds.; Woolhead publishings Cambridge, 2011; p 155-192.
12. Rios, P. F., Ophir, A., Kenig, S., Efrati, R., Zonder, L. and Popovitz-Biro, R. J. Appl. Polym. Sci.
2011, 120, 70-78.
13. Villmow, T., Pegel, S., Pötschke, P. and Wagenknecht, U. Compos. Sci. Technol.2008, 68, 777-789.
14. Lellinger, D., Xu, D., Ohneiser, A., Skipa, T. and Alig, I. physica status solidi (b)2008, 245, 2268-2271.
15. Pegel, S., Pötschke, P., Villmow, T., Stoyan, D. and Heinrich, G. Polymer2009, 50, 2123-2132. 16. Mack, C., Sathyanarayana, S., Weiss, P., Mikonsaari, I., Hübner, C., Henning, F. and Elsner, P.
IOP Conf. Ser.: Mater. Sci. Eng.2012, 40, 012020.
17. Choong, G. Y. H., De Focatiis, D. S. A. and Hassell, D. G. Rheol. Acta2013, 52, 801-814. 18. Krause, B., Boldt, R. and Pötschke, P. Carbon2011, 49, 1243-1247.
19. British Standards Institution, EN ISO 527-2:2012, Plastics - Determination of tensile
properties In Part 2: Test conditions for moulding and extrusion plastics, BSI, London, 2012. 20. De Focatiis, D. S. A. Polym. Test.2012, 31, 550-556.
21. Pegel, S., Villmow, T. and Pötschke, P. InPolymer - carbon nanotube composites: preparation, properties and applications; McNally, T.; Ptschke, P., Eds.; Woolhead publishings Cambridge, 2011; p 265-294.
22. Krause, B., Pötschke, P. and Häußler, L. Compos. Sci. Technol.2009, 69, 1505-1515.
23. Villmow, T., Pötschke, P., Pegel, S., Häussler, L. and Kretzschmar, B. Polymer2008, 49, 3500-3509.
24. Choong, G. Y. H. A study of melt-compounded nanocomposites of polycarbonate and carbon nanotubes in the melt and solid states. Ph.D. Thesis, University of Nottingham, Nottingham, July 2014.
25. Berger, H. H. J. Electrochem. Soc.1972, 119, 507-514. 26. Tietjen, G. L. and Roger, M. H. Technometrics1972, 14, 16.
27. Richter, S., Saphiannikova, M., Jehnichen, D., Bierdel, M. and Heinrich, G. eXPRESS Polym. Lett.2009, 3, 753 - 768.
29. Lew, C. Y., Xia, H., McNally, T., Fei, G., Vargas, J., Millar, B., Douglas, P., Claes, M. and Luizi, F. In Polymer Processing Society Europe/Africa Region Meeting, Larnaca, Cyprus, 2009;
Polymer Processing Society.
30. Liu, S.-P., Hwang, S.-s., Yeh, J.-M. and Pan, K.-W. Int. Commun. Heat Mass2010, 37, 809-814. 31. Thostenson, E. T. and Chou, T.-W. J. Phys. D: Appl. Phys.2003, 36, 573.
32. Gojny, F. H., Wichmann, M. H. G., Köpke, U., Fiedler, B. and Schulte, K. Compos. Sci. Technol.
2004, 64, 2363-2371.
33. Engels, T. A., Govaert, L. E. and Meijer, H. E. Macromol. Mater. Eng.2009, 294, 821-828. 34. Pan, Z. W., Xie, S. S., Lu, L., Chang, B. H., Sun, L. F., Zhou, W. Y., Wang, G. and Zhang, D. L.
Appl. Phys. Lett.1999, 74, 3152-3154.
35. Bhuiyan, M. A., Pucha, R. V., Worthy, J., Karevan, M. and Kalaitzidou, K. Compos. Struct.2013,