Peter M. Steinberg1 Jeffrey S. Ross Michael T. Modic Jean Tkach Thomas J. Masaryk E. Mark Haacke
Received January 19. 1989; revision requested March 13, 1989; revision received June 2, 1989;
accepted June 12. 1989.
' All authors: Department of Radiology, Univer -sity Hospitals of Cleveland/Case Western Reserve University, 2074 Abington Rd., Cleveland, OH 44106. Address reprint requests toP. M. Steinberg.
0195-6108/90/1101-059
© American Society of Neuroradiology
The Value of Fast Gradient-Echo
MR Sequences in the Evaluation
of Brain Disease
59
One hundred fifteen patients thought to have intracranial disease were studied with various two-dimensional short repetition time, partial-flip-angle gradient-echo t ech-niques: at 1.0 T, fast low-angle short (FLASH) at 10° and 30° and fast imaging with steady-state precession (FISP) at 60°; at 1.5 T, FLASH 10°, 30°, and 60°, FISP 60°, and contrast-enhanced fast steady state at 60°. These sequences were compared with a T2-weighted spin-echo sequence to determine the relative sensitivities of these tech-niques in detecting parenchymal lesions. Except for hemorrhagic lesions a substantial number of abnormalities were either not visible or poorly seen on the partial-flip-angle gradient-echo sequences. Minimizing echo time (6-9 msec) to decrease magnetic susceptibility effects did not improve lesion detection.
Current usage of two-dimensional gradient-echo techniques for lesion detection is limited, except when calcification or hemorrhage is involved. Their utility may be expanded via the incorporation of three-dimensional techniques and IV contrast agents.
AJNR 11:59-67, January/February 1990
The introduction of short repetition time (TR), gradient-echo (GRE) imaging with partial flip angles has stimulated numerous reports regarding its potential clinical utility [1-11]. The major advantages anticipated with implementation of these techniques include (1) a reduction in scan time and (2) the potential for volume imaging. Inherent in these fast scan techniques is the capability to adjust not only echo time (TE) and TR, but also the flip angle for control of contrast. However, for fast imaging to be both useful and clinically effective, it must demonstrate pathologic processes with the same degree of accuracy as conventional spin-echo (SE) sequences do. Toward this end, this study was designed to address two major questions regarding the detectability of intracranial disease with GRE images with various TEs and flip angles compared with detectability afforded by conventional SE sequences: (1) Do GRE sequences display intracranial disease with the same degree of accuracy as conventional SE sequences do? and (2) Do GRE sequences with ultrashort TEs (i.e., 6 or 9 msec) minimize magnetic susceptibility effects and, therefore, improve image quality and lesion detection owing to increased contrast to noise?
Subjects and Methods
This study was divided into two parts. In part 1, two-dimensional (20) GRE scans with
TEs of 13 or 25 msec were compared with T2-weighted SE scans; a 1.0-T Siemens Magnetom was used. In part 2, 20 GRE scans with TEs of 6 or 9 msec were compared with T2-weighted SE scans; a 1.5-T Siemens Magnetom unit was used.
Part 1: TE = 13 or 25 msec; 1. 0-T Unit
60 STEINBERG ET AL. AJNR:11, January/February 1990
14, 15]. These techniques use GRE rephasing to form an echo in the
transverse plane. The FLASH sequence, in addition, uses large
dephasing or spoiler gradients to dephase residual transverse mag-netization before the start of each RF cycle (13]. Depending on the TR, spin-density contrast is obtained at flip angles of less than about 1 0°; the exact angle varies with the TR [5]. As the TR increases, the flip angle (alpha) must also increase to maintain spin-density contrast. T1 contrast is recognized at angles greater than 30° in most cases (1 0]. With FISP, the objective is to maintain the residual transverse magnetization between RF pulses. As with FLASH, spin-density contrast is obtained using low flip angles of less than 15°. The ratio T1 /T2 contrast is recognized at larger angles (1 0, 14, 15].
T1, T2, and T2* values of gray matter, white matter, and CSF
were measured at 1.0 T. They were then substituted into the following
equations to generate theoretical contrast curves (see Figs. 1 and 2). For FISP (14],
Signal intensity = 1
+
T1 /T2 - cos a(T1 /T2 - 1] , (1)for FLASH (2],
. . . Masin a(1 - eTRfT•>eTEfT2 • S1gnal 1ntens1ty = _TAfT
1 -cos ae ' (2)
where Mo is the equilibrium value of the magnetization and a is the
flip angle.
The optimal set of imaging parameters was selected on the basis
of these contrast curves, in which maximum signal and contrast between these components occurred at roughly 60° for FISP 50/25/
8 (TR/TE excitations) and 30° for FLASH 50/13/8. Because optimal
signal depends on tissue type, slice profiles, and other factors (e.g., behavior of gradients), only a global choice was made for the selection of appropriate imaging parameters TR, TE, and flip angle.
Typically, intracranial lesions are characterized by a significant increase in T2 (i.e., decreased T1/T2 ratio). However, positively
correlated changes in spin density and T1 occur also, but are usually less dramatic. By selecting imaging parameters to optimize spin density, T1, and T1/T2 contrast, we hoped to maximize lesion detection. The sequence protocol included FLASH 10° for spin-density contrast, FLASH 30° for T1 contrast, and FISP 60° for T1
1
T2 contrast.Patient population.-Fifty-four patients suspected of harboring in-tracranial disease were scanned on a Siemens·1.0-T Magnetom unit
""
J50 300 250""
!50 !DO ' 50 .,," 00 10 20 )0
..
50Angle
... Gray Matter
- CSF White Matter
..
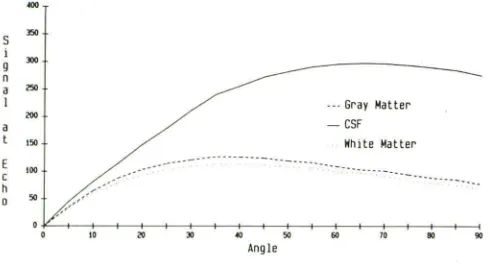
10 110 00Fig. 1.-Relative signal intensity vs flip angle for FISP sequence, 50/13.
Theoretical contrast curves are given for intracranial components: CSF, gray matter, and white matter. Tissue parameters (T1 /T2/T2* in msecf relative spin density): CSF, 3000/1500/200/1; gray matter, 955/105/50/1;
and white matter, 585/65/50/0.9.
200
1110
160
uo
120
-
..
100 110
..
20 ·· ... ··· ... ··· ...... Gray Matter
- CSF
White Matter
·· ... ···· .
0~0~~+10--~+20--~+)0--~+.,--~+50--+-+,.--+-+10~+-+110~+-+00
Angle
Fig. 2.-Relative signal intensity vs flip angle for FLASH sequence, 50/ 13. Theoretical contrast curves are given for CSF, gray matter, and white
matter. Tissue parameters (T1/T2/T2* in msecfrelative spin density): CSF, 3000/1500/200/1; gray matter, 955/105/50/1; and white matter, 585/65/ 50/0.9.
with surface-coil imaging. A T2-weighted SE sequence, 2500/90/2, was obtained axially through the cranial vault after localization with a sagittal scout sequence. By using the above sequence protocol, we obtained single-slice, two-dimensional Fourier transform (20FT) GRE scans (FLASH 10°, FLASH 30°, and FISP 60°), 50/13,25/8, through the intracranial lesion or, in a normal study, at the level of the lateral ventricles. Each GRE image was compared with the T2-weighted SE
scan of the same image slice.
Part 2: TE = 6 or 9 msec; 1.5-T Unit
Rationa/e.-Unlike SE, GRE techniques do not incorporate 180° refocussing pulses and thus are unable to correct for transverse dephasing effects caused by local field inhomogeneities ( 16, 17]. The local field variations can be induced by the presence of metal implants, local gradients associated with changes in magnetic susceptibility, as well as from chemical shift within a given pixel (9]. Independent of the source, these field inhomogeneities increase transverse magne-tization decay and decrease signal and resolution.
[image:2.612.318.559.76.217.2] [image:2.612.53.298.550.682.2]AJNR:11, January/February 1990 FAST GRADIENT-ECHO IMAGING OF BRAIN DISEASE 61
Selection of appropriate flip angles was again based on theoretical contrast curves, taking into account inaccuracies of slice profile and nonidealized behavior of gradients. Maximum signal and maximum contrast between CSF, white matter, and gray matter occurred at roughly 30° and 60° on the FLASH 50/6 and 60° on FISP 50/6 and contrast-enhanced FAST 40/9 (which is only scaled differently from
FISP). The GRE sequence for part 2 included FLASH 10° (50/6,9) for spin-density contrast; FLASH 30° and 60° (50/6,9) for T1 contrast; and a FISP 60° (50/6,9) for T1 jT2 contrast with an additional T2 component provided by contrast-enhanced FAST 60° (40/9).
Patient population.-A second group of 61 patients with suspected
intracranial lesions were scanned on a Siemens 1.5-T Magnetom unit. Similar to part 1 , a T2-weighted SE sequence (2000/90) was performed axially following sagittal scout localization. GRE images using the above protocol were obtained at levels as described in part 1. Comparisons were made between SE and GRE scans obtained at
the same slice positions.
In both parts of the study, 20FT rather than three-dimensional
Fourier transform imaging was performed to maintain consistent methodology. Scans from parts 1 and 2 were reviewed, assessing
image quality and lesion detectability. A ranking system was devised to judge the conspicuity of the intracranial lesions. A lesion that was delineated better on a fast scan compared with the T2-weighted SE image was given a score of 4. If pathology was detected with equal conspicuity on the fast and SE sequences, the former received a score of 3. A score of 2 was assigned to those GRE scans that demonstrated the lesion with less conspicuity than the SE image did.
Finally, fast scans received a score of 1 if the lesion was not detected.
This comparison study was performed independently by three neu-roradiologists. Scores for each GRE scan were then averaged and the results tabulated.
Results
Part 1: TE = 13 or 25 msec; 1.0-T Unit
Thirty-one of the 54 patients demonstrated intracranial pathology grouped into five disease categories (see Table 1 ). These include neoplasms (1 0), infarcts (six), focal white-mat-ter changes (eight), hemorrhagic lesions (five), and others (two). A cystic lesion of the thalamus and a frontal sinus mucocele were in the last category. On the majority of GRE scans, lesions were either not seen or poorly visualized compared with the T2-weighted SE images. Average scores of 1 or 2 occurred in 25 (83%) of the 30 neoplastic processes,
14 (78%) of the 18 infarcts, 24 (1 00%) of the 24 focal white-matter changes, and four (67%) of the six scans of the miscellaneous group.
Hemorrhagic lesions were visualized with equal or greater conspicuity on GRE compared with SE in 14 (93%) of 15 scans. In this category, the three GRE s~ans given average scores of 4 were from the same patien:. The lesion was a subdural hematoma overlying the cerebral convexities bilat-erally. It was seen as a band of low signal intensity surrounded by intermediate signal intensity on FLASH 1 0°, FLASH 30°,
and FISP 60° scans. The extent of the hematoma was not as well delineated on comparable SE scans. The remaining GRE scans demonstrating hemorrhage were all given scores of 3. They included three arteriovenous malformations meas-uring 2-4 em in diameter that bled intraparenchymally and another subdural hematoma. Arteriovenous malformations
were seen as areas of low signal intensity on the GRE and SE scans. The subdural hematoma was identified as a band of bright signal on all of these sequences.
Three of four GRE scans with average scores of 4 were from a single patient within the infarct category. A 1-cm lesion was clearly delineated on FLASH 1 0°, FLASH 30°, and FISP 60° within the right caudate nucleus. The other GRE image
with an average score of 4 was from a FLASH 30° sequence.
A left parietal lacunar infarct was identified on this scan.
Neither lesion was detected on theSE sequence.
In comparing the three GRE sequences, there were no substantial differences among them in defining and detecting intracranial disease. Lesions went undetected on 13 (42%) of 31 FLASH 10°, nine (29%) of 31 FLASH 30°, and 12 (39%) of 31 FISP 60° scans. Abnormalities were less well defined than on T2-weighted SE sequences on 11 (35%) of 31 FLASH 10°, 12 (39%) of 31 FLASH 30°, and 11 (35%) of 31 FISP 60° scans. Equivalent lesion conspicuity between SE and GRE images was noted on five (16%) of 31 FLASH 10°,
seven (23%) of 31 FLASH 30°, and six (19%) of 31 FISP 60° scans. Finally, intracranial disease was defined with greater conspicuity than on SE images on two (7%) of 31 FLASH 10°, three (10%) of 31 FLASH 30°, and two (7%) of 31 FISP 60° scans.
Part 2: TE = 6 or 9 msec; 1. 5-T Unit
Eleven neoplasms, seven infarcts, 11 focal white-matter changes, five hemorrhagic lesions, and five miscellaneous abnormalities for a total of 391esions were found in 61 patients (see Table 2). The miscellaneous group comprised three patients with postoperative edema, one with an arachnoid cyst, and another with generalized parenchymal volume loss.
Lesions were either not detected or defined less well than on SE scans with the following GRE images: 36 (71%) of 51 GRE scans with neoplasms, 14 (50%) of 28 with infarcts, 43 (88%) of 49 with focal white-matter changes, nine (38%) of 24 with hemorrhage, and nine (39%) of 23 with miscellaneous abnormalities. A moderate-size (4-cm) left hemispheric infarct and focal white-matter changes within the right thalamus were seen with greater conspicuity on two separate contrast
-enhanced FAST images compared with comparable SE scans.
The different GRE sequences in part 2 varied in their ability to detect abnormalities. Lesions went undetected in 16 (44%)
of 36 FLASH 10° scans compared with 10 (26%) of 38 FLASH 30°, nine (24%) of 37 FLASH 60°, 12 (32%) of 38 FISP 60°, and four (16%) of 25 contrast-enhanced FAST 60° scans. Conversely, lesions were seen with equal or greater conspi-cuity compared with SE on three (8%) of 36 FLASH 1
oo
,
15(39%) of 38 FLASH 30°, 13 (35%) of 37 FLASH 60°, 17 (45%) of 38 FISP 60°, and 16 (64%) of 25 contrast-enhanced
FAST 60° scans.
Comparing FLASH 10°, FLASH 30°, and FISP 60° GRE
sequences from part 1 to part 2 demonstrated increased
lesion detectability in four of five disease categories. Only hemorrhagic lesions decreased in lesion detection between
62
STEINBERG ET AL. AJNR:11, January/February 1990TABLE 1: Gradient-Echo Scans (TE
=
13 or 25 msec) vs T2-Weighted Spin-Echo Scans on 1.0-T UnitRanking/ Neoplasms Infarct Focal White-Matter Hemorrhagic Miscellaneous
Sequence (n = 10) (n = 6) Abnormal(n = 8) ity L(n es= ions (n = 2) 5)
1 , Lesions not detected
FLASH 10° 1 3 8 0 1
FLASH 30° 1 1 7 0 0
FISP 60° 2 3 7 0 0
2, Gradient echo inferior to spin echo
FLASH 10° 7 2 0 1
FLASH 30° 7 3 1 0
FISP 60° 7 2 1 0
3, Gradient echo equal to spin echo
FLASH 10° 2 0 0 3 0
FLASH 30° 2 0 0 4 1
FISP 60° 1 0 0 4 1
4, Gradient echo superior to spin echo
FLASH 10° 0 1 0 0
FLASH 30° 0 2 0 0
FISP 60° 0 1 0 0
Note.-FLASH = fast low-angle shot; FISP = fast imaging with steady-state precession.
TABLE 2: Gradient-Echo Scans (TE
=
6 or 9 msec) vs T2-Weighted Spin-Echo Scans on 1.5-T UnitRanking/ Neoplasms Infarct Focal White-Matter Hemorrhagic Miscellaneous Sequence (n = 11) (n = 7) Abnormality Lesions (n = 5)
(n = 11) (n = 5)
1 , Lesions not detected
FLASH 10° 3 3 9 1 1
FLASH 30° 1 2 7 0 0
FLASH 60° 1 2 6 0 0
FISP 60° 1 2 8 0 1
CE FAST 60° 0 0 4 0 0
2, Gradient echo inferior to spin echo
FLASH 10° 8 3 1 3 2
FLASH 30° 6 1 2 2 2
FLASH 60° 6 1 4 2 2
FISP 60° 6 0 1 1 1
CE FAST 60° 4 0 1 0 0
3, Gradient echo equal to spin echo
FLASH 10° 0 0 0 1 2
FLASH 30° 4 3 2 3 3
FLASH 60° 4 3 0 3 3
FISP 60° 4 5 1 4 3
CE FAST 60° 3 2 2 4 3
4, Gradient echo superior to spin echo
FLASH 10° 0 0 0 0 0
FLASH 30° 0 0 0 0 0
FLASH 60° 0 0 0 0 0
FISP 60° 0 0 0 0 0
CE FAST 60° 0 1 1 0 0
Note.-FLASH = fast low-angle shot; FISP = fast imaging with steady-state precession; CE FAST =
contrast-enhanced fast steady state.
percentages of FLASH 1 0°, FLASH 30°, and FISP 60° scans
in which lesions were depicted with equivalent or greater
conspicuity than on comparable SE scans (see Figs. 3 and
4).
ease. Except for hemorrhagic lesions in part 1 of the study, a significant number of abnormalities were either not visible or poorly seen on the partial-flip-angle GRE scans. Use of the same GRE sequences with short TE times of 6 or 9 msec did not alter lesion detection appreciably. In fact, hemorrhagic lesions in part 2 of the study were visualized less frequently
than in part 1 with the lower magnetic field (1.0 vs 1.5 T) and longer TE sequences (13 or 25 msec). In comparing the.
various GRE sequences (FLASH 1 0° and 30° and FISP 60°
Discussion
The study demonstrates that 2D GRE techniques including
FISP, FLASH, and contrast-enhanced FAST are less effective
[image:4.612.127.493.100.285.2] [image:4.612.126.490.337.596.2]dis-AJNR:11, January/February 1990 FAST GRADIENT-ECHO IMAGING OF BRAIN DISEASE 63
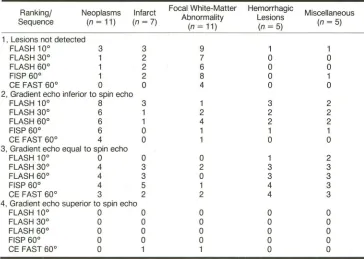
TABLE 3: FLASH 10°, FLASH 30°, and FISP 60° Gradient-Echo Images That Showed Equivalent or Greater Conspicuity Compared with Corresponding Spin-Echo Images
No.(%)
Type of Lesion TE = 13 or 25 msec;
1.0-T Unit
TE = 6 or 9 msec;
1.5-T Unit
Neoplasm Ischemic infarct
Focal white-matter changes
Hemorrhagic lesion Miscellaneous
!n part 1 and FLASH 1 0°, 30°, and 60°, FISP 60°, and contrast-enhanced FAST 60° in part 2), no particular se-quence was substantially better than another in defining or detecting intracranial disease.
The ability to detect intracranial lesions on MR depends primarily on contrast between lesion and adjacent brain mat-ter. Contrast, in turn, is determined by intrinsic factors (i.e.,
proton density, T1 and T2 relaxation time constants) and extrinsic factors (i.e., TR, TE, and flip angle of the RF pulse). Ideally, RF pulses of infinite duration produce rectangular slice profiles such that all protons within the imaging slice experi-ence the same flip angle. In this study, the RF pulses were truncated sine pulses resulting in nonuniform slice profiles. Such profiles reduce contrast between tissues. In addition, the imperfections increase as the RF duration decreases.
Short RF pulses are essential if short TEs are to be achieved. In a voxel of homogeneous tissue, the nonuniform distribution in flip angle across the slice leads to variation in signal
intensities within the voxel as a function of its position with
respect to the slice-select direction [1]. This is true for all GRE and SE techniques. Since the observed signal is the integration of the differential signal intensities across the voxel, a reduction in contrast results.
As equation 2 indicates, with the exception of the T2*-weighting at the echo, FLASH contrast is determined primarily by T1 differences among tissues. T2* contrast may be intro-duced by increasing TE. However, this technique compro-mises image quality since resulting signal to noise is often insufficient to detect small differences in contrast. Alterna-tively, FISP signal behavior (equation 1) is determined by T1 over T2, assuming that TR is much less than T2. For those diseases in which the increase in T2 is most dramatic (i.e., T1 remains the same; T1 over T2 is small and signal peaks at large angles, e.g., 60°), a single FISP 60° image may be sufficient for lesion detection. However. in those instances
where T1 and T2 increase proportionally so that T1 over T2 remains approximately the same, the lesion will be isointense relative to surrounding brain tissue. Similar to FLASH, T2*-weighting in FISP is introduced by increasing the TE value.
However, this adjustment in TE compromises overall image
quality; and again, signal to noise may not be sufficient for detecting small contrast differences.
Contrast-enhanced FAST provides additional T2 contrast
(not T2* contrast), while TE remains short [15]. It is similar to
FISP in that TR is less than T2 and general signal behavior is
5/30 (17)
4/18 (22)
0/24
14/15 (93)
2/6 (33)
8/33 (24) 8/19 (42) 3/31 (1 0) 8/15 (53) 8/15 (53)
determined by T1 over T2. The additional T2 contrast, which is approximately e-2
(TRfT2) [15], reflects the fact that the echo
is obtained just before the next RF pulse. This is in
contradis-tinction to FISP, where the FID is obtained immediately after
the RF pulse. Both contrast-enhanced FAST and FISP require that TR is much less than T2 and that the gradient structure
remains constant from cycle to cycle. Failure to satisfy these
criteria leads to a less than satisfactory build-up of transverse
coherence from cycle to cycle. Overall, signal intensity is
reduced and in extreme cases, a "FLASH-like" image results.
Motion from such sources as CSF flow leads to similar loss in transverse coherence and signal. The affected tissues
exhibit a FLASH-like behavior at a TR shorter than that
predicted by T2 alone [20]. Recently, it has been shown to
be possible to increase this motion problem and obtain the
correct contrast [11].
Image quality on GRE scans is further hampered by the
effects of local gradients induced by changes in magnetic
susceptibility such as those occurring at air-bone and
bone-soft tissue boundaries [9]. The local gradients associated with
these interfaces produce spin dephasing. Unlike SE, GRE
sequences do not incorporate 180° refocusing pulses;
there-fore they cannot compensate for spin dephasing (T2*) effects.
Signal loss from the affected tissue results. Signal to noise in the resulting images is often insufficient for detection of small
differences in signal often required for lesion detection.
For-tunately, the vast majority of lesions in this study were
sep-arate from sources of field inhomogeneity. Signal loss
oc-curred around paranasal sinus regions; however, its effect on
lesion detection and image interpretation was negligible.
While susceptibility effects are often thought of as
disad-vantages of GRE imaging, they may be useful in the diagnosis
of hemorrhage. The magnetic susceptibility effects of
dena-tured hemoglobin create local field inhomogeneities induced
by the external magnetic field [6]. The amount of spin de
-phasing and signal loss is directly proportional to the applied
magnetic field [21]. As pointed out by Edelman et al. [22],
GRE imaging is acutely sensitive to these magnetic
suscep-tibility effects. This is illustrated in Figure 5, where the
dimen-sions of the hemorrhagic lesion are exaggerated with increas
-ing TE. These effects may explain why hemorrhagic lesions were seen more often and better defined on GRE images in
part 1 than in part 2. The use of ultrashort TE times of 6 and
9 msec minimized the T2* effects and thus decreased
[image:5.614.125.490.102.192.2]64
A
8
c
D
E
F
STEINBERG ET AL. AJNR:11, January/February 1990
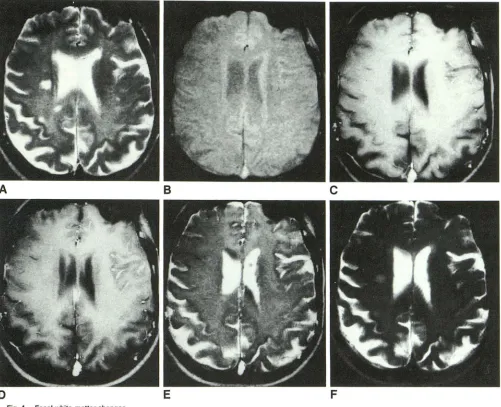
Fig. 3.-Extensive infarct involving left middle cerebral artery distribution.
A, T2-weighted SE image, 2000/90, clearly delineates extent of lesion as high signal inten-sity.
8-D, FLASH 10° (8), 30° (C), 60° (0) scans, 50/6, poorly delineate abnormality, which is seen as indistinct area of decreased signal intensity within left cerebral hemisphere.
E and F, FISP 60°, 50/6 (E), and
contrast-enhanced FAST 60°, 40/9 (F), images show
ab-normally increased signal within left cerebral hemisphere. However, extent of involvement is
underestimated when compared with
[image:6.617.55.394.72.685.2]AJNR:11, January/February 1990 FAST GRADIENT-ECHO IMAGING OF BRAIN DISEASE 65
B
c
D
E
F
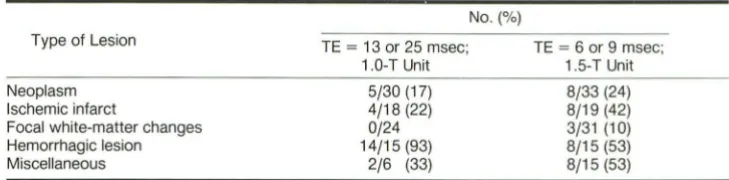
Fig. 4.-Focal white-matter changes.
A, T2-weighted SE sequence, 2000/90, shows small and punctated areas of increased signal intensity within periventricular white matter. B, FLASH 10° image, 50/6, poorly delineates lesions owing to lack of contrast.
C, FLASH 30° image, 50/6, shows single lesion within periventricular white matter on right. This is seen as focus of slightly decreased signal intensity
compared with surrounding white matter. Focal posterior hemispheric white-matter changes visible on SE sequence (A) are not visualized on GRE
sequence.
D and E, FLASH 60°, 50/6 (D), and FISP 60°, 50/6 (E), images fail to show white-matter lesions.
F, Contrast-enhanced FAST 60° image, 40/9, reveals larger, focal white-matter abnormalities, but with less definition compared with theSE sequence.
In the brain, the primary role of partial-flip-angle GRE
im-aging is in the diagnosis of hemorrhage [9]. Although, in theory, most brain disease should be detected by a
T1-weighted FLASH and T1 jT2 FISP image set, signal to noise in the GRE images is often insufficient to detect small differ-ences in contrast associated with this pathology. The clinical
applications of GRE imaging will expand with improvements
in lesion detectability. This may occur through the use of
paramagnetic contrast agents [23, 24).
Improvement in image quality with reduction of
susceptibil-ity artifacts may be realized through three-dimensional (3D)
volume imaging [16). It must be emphasized that only 2D images were acquired in this study. This was done to maintain
consistent methodology in scanning patients with various
GRE and SE sequences. With 3D volume imaging, thin con
-tiguous slices can be obtained in which the signal to noise
increases as the square root of the number of partitions; 2D imaging does not offer this advantage. In addition, it allows one to reformat images in multiple planes from a single data set. Short TR GRE techniques are particularly well suited to volume acquisition. T2* signal loss in the slice-select direction is reduced, leading to overall improvement in signal to noise and image quality [16). The improvement in image quality is
[image:7.612.56.557.76.483.2]66
STEINBERG ET AL. AJNR:11, January/February 1990A
8
c
D
E
Fig. 5.-lntraparenchymal hemorrhage.
A, T2-weighted SE sequence, 2000/90, shows focus of decreased signal intensity within anterior portion of left temporal lobe.
B, Nonenhanced CT scan substantiates presence of focal hemorrhage within left anterior temporal lobe as high attenuation.
C-E, FISP 60° GRE scans (TE = 6 msec, C; TE = 14 msec, E; TE = 22 msec, F) show hemorrhage within anterior left temporal lobe as low signal intensity. Contrast and size of lesion increase with lengthening TE values.
poor detection may be secondary to TRs that are not short
enough to obtain true FISP contrast, and to T2* effects.
Future improvements in obtaining expected contrast are likely
to be possible using "ideal" FISP sequences [11] and 3D
imaging. The latter allows for improved signal to noise, no
integration over slice profile, and reduced T2* effects. This type of GRE imaging can be done in a few minutes with short
TRs (e.g., 20 msec) and is a direction to be pursued.
REFERENCES
1. Vander Muelen P, Grown JP, Cuppan JJM. Very fast MR imaging by field
echoes and small angle excitation. Magn Reson Imaging 1985;3:297-299
2. Frahm J, Haase A, Matthier D. Rapid three-dimensional MR imaging using
the FLASH technique. J Comput Assist Tomogr 1986;10(2):363-368
3. Mills TC, Ortendahl DA, Hylton NM, Crooks LE, Carlson JW, Kaufman L. Partial flip angle MR imaging. Radiology 1987;162:531-539
4. Hendrick RE, Kneeland JB, Stark DO. Maximizing signal to noise and contrast to noise ratios in FLASH imaging. Magn Reson Imaging 1987;5:
117-127
5. Buxton RB, Edelman RR, Rosen BR, Wismer GL, Brady T J. Contrast in
rapid MR imaging: T1 and T2 weighted imaging. J Comput Assist Tomogr
1987;11(1):7-16
6. Winkler ML, Olsen WL, Mills· TC, Kaufman L. Hemorrhagic and nonhem-orrhagic brain lesion: evaluation with 0.35 T fast MR imaging. Radiology
1987;165:203-207
7. Utz JA, Herfkens RJ, Johnson CD, et al. Two-second MR images: com-parison with spin echo images in 29 patients. AJR 1987;148:629-633 8. Bydder GM, Payne JA, Collins AG, et al. Clinical use of rapid T2-weighted
partial saturation sequences in MR imaging. J Comput Assist Tomogr
1987;11 :17-23
[image:8.612.58.564.70.495.2]AJNR:11, January/February 1990 FAST GRADIENT-ECHO IMAGING OF BRAIN DISEASE
67
10. Tkach JA, Haacke EM. A comparison of fast spin echo and gradient field echo sequences. Magn Reson Imaging 1989;6:373-389
11. Wielopolski P, Haacke EM. CSFjcord contrast enhancement with steady state free precession imaging. Radiology 1988;169[P]:325
12. Haase A, Frahm J, Matthaei 0, Hameki W, Merboldt KO. FLASH imaging: rapid NMR imaging using low flip angle pulses. J Magn Reson 1986;67:
258-266
13. Frahm J, Hanicke W, Merboldt KO. Transverse coherence in rapid FLASH NMR imaging. J Magn Reson 1987;72:307-314
14. Oppelt A, Graumann L, Bareud H, Fischer H. FISP: a new fast MRI sequence. Electromed 1986;54:15-17
15. Gyngell ML. Steady state free precession sequences (abstr). Presented at the Topical Conference on Fast Magnetic Resonance Imaging Techniques,
Cleveland, May 1987
16. Haacke EM, Tkach JA, Parrish TB. Reduction of T2' dephasing in gradient field-echo imaging. Radiology 1989;170:457-462
17. Ohtendahl OA, Posin JP, Hylton NM, Mills CM. Optimal visualization of the cerebrospinal fluid in MRI. AJNR 1986;7:403-407
18. Graumann R, Fischer H, Barfuss H, Bruder H, Oppelt A, Oeimling M. Contrast behavior of steady state sequences in inhomogeneous fields.
Presented as a poster at the annual meeting of the Society of Magnetic Resonance in Medicine, New York City, August 1987
19. Lee SY, Cho ZH. Full utilization of the echo and FlO signal in SSFP fast NMR imaging. Presented at the annual meeting of the Society of Magnetic
Resonance in Medicine, New York City, August 1987
20. Patz S, Hawaks RC. The application of steady state free precession to the study of very slow fluid flow. Magn Reson Med 1986;3: 140-145
21. Gomori JM, Grossman Rl, Goldberg HI, et al. Intracranial hematomas: imaging by high field MR. Radiology 1985;157:87-92
22. Edelman RR, Johnson K, Buxton R, et al. MR of hemorrhage: a new approach. AJNR 1986;7:751-756
23. Runge VM, Clayton JA, Lukehart CM, Partian CL, James AE Jr. Paramag-netic agents for contrast enhanced NMR imaging: a review. AJR 1983; 141:1209-1215
24. Grail M, Bydder GM, Steiner RE, Niendorf P, Thomas OG, Young IR.
Contrast-enhanced MR imaging of malignant brain tumors. AJNR 1985;
6:855-862
25. Carlson JC, Crooks LE, Ortendahl OA, Kramer OM, Kaufman L. Signal to noise ratio and section thickness in two-dimensional versus three-dim