Gradient-Echo MR Images of a Phantom Simulating Enhancing
Brain Lesions
Daniel A. Finelli
PURPOSE: To develop a simple tissue phantom to study the effects of various imaging parameters and gadolinium concentrations on magnetization transfer (MT) and lesion-to-background ratios. METHODS: A commercial egg product was doped with gadolinium in concentrations of 0.0 to 1.0 mmol/L and cooked. The T1 and T2 values were determined for the phantom materials and for the white and gray matter of a healthy volunteer subject. The gadolinium-doped egg phantom and human brain were studied using a short-repetition-time three-dimensional gradient-echo MT se-quence with various effective MT powers, frequency offsets, and section-select flip angles. The normalized signal intensities, MT ratios (MTRs), and simulated lesion-to-background normal white matter contrast ratios were determined for a variety of experimental conditions. RESULTS: The MTR and lesion-to-background contrast ratios for all materials were greatest at the highest effective MT power (270 Hz, root-mean-square of amplitude) and the narrowest MT pulse frequency offset (1000 Hz). There was an inverse relationship between gadolinium concentration and MTR, and a positive relationship between the gadolinium concentration and lesion-to-background contrast. MTR was greatest at low flip angles, where there was little T1 weighting. The simulated lesion-to-background contrast showed a complex, gadolinium concentration-dependent relationship with section excitation flip angle. CONCLUSIONS: The tissue phantom has relaxation properties and MT behavior close to that expected for enhancing brain lesions, allowing a rigorous analysis of simulated lesion-to-background contrast for high MT power, short-repetition-time, three-dimen-sional gradient-echo sequences.
Index terms: Magnetic resonance, magnetization transfer; Magnetic resonance, phantom
AJNR Am J Neuroradiol18:147–159, January 1997
Several studies have shown that use of the magnetization transfer (MT) technique im-proves contrast between lesions and back-ground white matter on contrast-enhanced T1-weighted magnetic resonance (MR) images (1–9). The temporal enhancement pattern of lesions with variable vascularity and pathologic blood-brain barrier kinetics is an important con-sideration in clinical studies exploring lesion-to-background contrast using various sequence techniques or gadolinium-based compounds
(10 –14). This pathophysiologic factor limits the ability to analyze rigorously specific sequence parameters, because the intralesional gadolin-ium concentration varies among lesions and re-gionally within the same lesion and changes over the course of obtaining multiple measure-ments. Simple aqueous dilutions of gadolinium can be used to provide a range of T1 values that mimic the T1 relaxation parameters of en-hanced lesions, but these aqueous solutions have no MT effect.
Hard-boiled egg whites, agar gels, and cross-linked bovine serum albumin have been used as phantom materials for MT experiments (15–22). Gadolinium solutions are immiscible in raw egg white, and whipping the egg whites suspends air bubbles that cause magnetic sus-ceptibility artifacts. Eggbeaters (Nabisco, East Hanover, NJ) is 99% egg white in a liquid form Received February 26, 1996; accepted after revision July 21.
From the Department of Radiology, MetroHealth Medical Center, Case Western Reserve University School of Medicine, 2500 MetroHealth Dr, Cleveland, Ohio 44109. Address reprint requests to Daniel A. Finelli, MD.
AJNR 18:147–159, Jan 1997 0195-6108/97/1801–0147 ©American Society of Neuroradiology
that readily mixes with gadolinium. Cooked ga-dolinium-doped Eggbeaters was used as a sim-ple, inexpensive, readily available tissue phan-tom with T1 relaxation and MT behavior that emulate contrast-enhanced brain lesions. This phantom, coupled with brain data from a healthy volunteer, provided a model of simu-lated lesion-to-background contrast. The phan-tom model was then used to explore the effects of several MT pulse and sequence parameters on the MT ratio (MTR) and on the simulated lesion-to-background contrast over a range of known tissue gadolinium concentrations.
Materials and Methods
Egg Material Phantom
Solutions of Eggbeaters doped with gadodiamide (Om-niscan, Nycomed, Princeton NJ) were prepared in 0.0, 0.1, 0.2, 0.3, 0.5, and 1.0 mmol/L concentrations. This range of concentrations encompasses the majority of those used in previous experimental studies conducted with T1-weighted spin-echo methods (23–25). Each sam-ple was 100 mL in volume. The solutions were placed in small metal containers, covered with foil, and cooked in a bath of boiling water for 10 to 12 minutes, resulting in small patties of gadolinium-doped hard-boiled egg white. The patties were stacked between sheets of waxed paper and placed in a sealed, plastic container. The phantom keeps well in the refrigerator for approximately 1 week. The cost of materials for the six patties (assuming one gets a few milliliters of discarded gadolinium for free from the bottom of a bottle) was less than $3.
Phantom aqueous solutions of distilled water, 0.4 mmol/L MnCl2, and 0.1 mmol/L gadodiamide in plastic
syringes were placed alongside the egg phantom to pro-vide an assessment of direct saturation and spin-locking contributions to the observed MT effects.
General Phantom and Volunteer Measurements
Data were gathered from six different egg phantoms and 12 healthy volunteers from July to December 1995. Studies were performed on a 1.5-T imager equipped with a circularly polarized head coil. The research was con-ducted with institutional review board approval, and in-formed consent was obtained from the volunteers (healthy men and women, 20 to 35 years old). The same three phantom aqueous solutions were used as references for the egg measurements and for the brain measurements in the volunteers.
T1 and T2 Measurements
T1 and T2 measurements of the different gadolinium-doped egg solutions, the aqueous phantom solutions, and the volunteers’ white and gray matter were obtained. The
T1 values were acquired using a nine-point inversion re-covery spin-echo method with single sections, repetition time/echo time (TR/TE) of 4000/20, and inversion time (TI) of 50 to 2200. The T2 values were obtained using a four-echo spin-echo sequence with single sections (4000/ 20,40,60,80). The data were processed on a workstation (Vistar XL, Picker, Highland Heights, Ohio) equipped with dedicated software that calculates T1 and T2 for manually placed regions of interest (ROIs) on a reference image. T1 and T2 measurements were obtained for each of the six different batches of gadolinium-doped egg materials. Four different ROIs were placed in each patty, and mean values were obtained. Two ROIs were positioned for each volun-teer: in the genu of the corpus callosum and in the head of the caudate nuclei. A mean value and a standard deviation (SD) were then obtained by entering the values from the 24 samples into a PC-based statistics software package (StatMost for Windows, 2.5, DataMost, Salt Lake City, Utah). The mean T1 and T2 values are given in Table 1.
Sequence Techniques
[image:2.587.307.547.107.240.2]A three-dimensional, radio frequency (RF)-spoiled, gradient-echo sequence (25/4.4) was used for all mea-surements. The MT pulse used was 10 milliseconds in duration, with the pulse shape defined mathematically as (12cos x), from 0 to 2p. The bandwidth of the MT pulse was 200 Hz. The transverse magnetization was RF-spoiled after application of the MT pulse and at the end of every TR (immediately before the MT pulse was applied). The peak amplitude of the MT pulse could be selected in the range of 0 to 1000 Hz. With the peak amplitude equal to 700 Hz, the continuous wave-equivalent power (26) (root-mean-square [RMS] of amplitude, or effective MT power) was 270 Hz, and the specific absorption rate (SAR) was ap-proximately 4.0 W/kg. The frequency offset of the MT pulse varied from 1000 to 6000 Hz off resonance; 1000 Hz was the minimum frequency offset used. All measure-ments were performed with exactly the same sampling parameters (20-cm field of view, 1283256 matrix, 243 4 mm sections, 1.43 section dimension oversampling, and 2:08 measurement time).
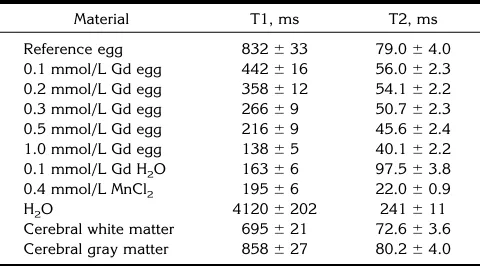
TABLE 1: T1 and T2 relaxation constants for the phantom materi-als and normal brain
Material T1, ms T2, ms
Reference egg 832633 79.064.0 0.1 mmol/L Gd egg 442616 56.062.3 0.2 mmol/L Gd egg 358612 54.162.2 0.3 mmol/L Gd egg 26669 50.762.3 0.5 mmol/L Gd egg 21669 45.662.4 1.0 mmol/L Gd egg 13865 40.162.2 0.1 mmol/L Gd H2O 16366 97.563.8
0.4 mmol/L MnCl2 19566 22.060.9
H2O 41206202 241611
Cerebral white matter 695621 72.663.6 Cerebral gray matter 858627 80.264.0
Data Analysis
Reference and MT data sets for the egg phantoms and the volunteers were processed on a workstation (Vistar, Picker) using two prototype software programs developed for quantitative MT analysis. In the first program, reference (non-MT) and test (MT) 3-D data sets were loaded into the program and an output calculated MTR image was created on a pixel-by-pixel basis using the formula MTR5SIref2
SItest/SIref(27). ROIs (circular or irregular, minimum
num-ber of pixels5 32) were hand drawn and placed on the calculated MTR image, and mean MTR values61 SD for the selected pixels were displayed. An identical region was superimposed on the reference and test images, and mean normalized signal intensity values61 SD were generated. The second program allows one to load multiple 3-D data sets, draw multiple ROIs on a reference image, superim-pose the ROIs on all the loaded data sets, and calculate and plot mean normalized signal intensity values or MTRs. These programs normalize the signal intensity by a factor that incorporates the receiver gain and scale factors and an image scale factor.
The reference egg material was also used to normalize the signal intensity measurements of the volunteers’ brains to that of the egg phantom. With different loading of the head coil, the coil’s Q value and impedance were altered, and a preamplifier was adjusted to compensate. This pre-amplifier adjustment was not accounted for by the normal-ization factor described above. It did not affect MTR cal-culations for an individual material; however, it did affect the lesion-to-background normal white matter calcula-tions when comparing the egg materials with callosal white matter. The ratio of the signal intensity obtained when the reference egg patty was placed alongside a volunteer’s head divided by the signal intensity measured on the stacked egg patty phantom was used to normalize the callosal white matter signal intensity measurements from the volunteer.
For the 12 volunteer examinations (performed at vari-ous MT powers, frequency offsets, and flip angles), two to four ROIs were generally placed in the genu of the corpus callosum. The genu of the corpus callosum was used be-cause it is the region that has the greatest MTR (28) and it is easy to place ROIs within it on the axial data sets. For each gadolinium-egg dilution, four samples were obtained. The normalized signal intensity values and MTR values were then entered into the StatMost statistical analysis and graphics program. All mean values in Tables 1, 2, and 3 and all data points on the graphs (Figs 1–5) reflect grand mean values of 24 samples (n524). A statistical analysis of mean values was performed using paired or unpaired two-tailed Student’st tests. Trends were analyzed using Pearson’s product-moment correlations, Spearman’s rank correlations, or linear regression analysis.
MT Power Analysis
The relationship between effective MT power and the MTR of normal callosal white matter was evaluated. The
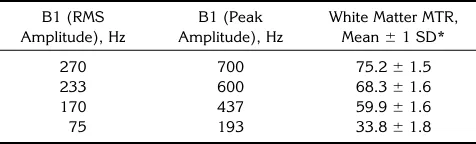
3-D gradient-echo sequence with TR of 25 was used for all measurements, with a 6° section excitation flip angle and a standard MT pulse frequency offset of 1000 Hz. Data sets were obtained with various peak MT pulse amplitudes corresponding to a range of RMS amplitudes from 75 to 270 Hz, as detailed in the first and second columns of Table 2. MTR values (n524 samples) for callosal white matter were recorded at each effective MT power, and mean values and SDs were calculated (Table 2).
MT Pulse Frequency Offset Analysis
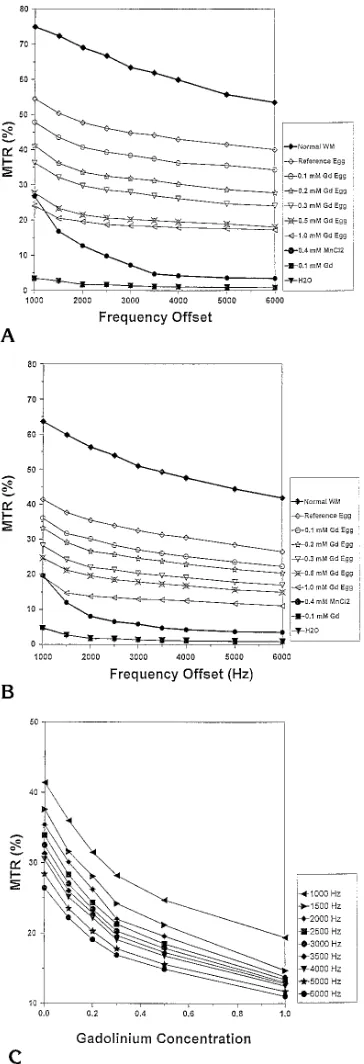
The relationship between the frequency offset of the MT pulse and the MTR of the different gadolinium-doped egg solutions, the aqueous solutions, and normal callosal white matter were analyzed at high effective MT power (270 Hz). The range of frequency offsets studied was from 1000 to 6000 Hz. Z-spectra, which display the relationship be-tween MTR and MT pulse power and frequency offset, were obtained at section excitation flip angles of 6° and 22°, reflecting two previously described relevant MT imaging scenarios (28): low flip angles, in which there is little inherent T1 or T2 weighting but the MTRs are greatest, and moderate flip angles, in which scans are strongly T1-weighted but MTRs are somewhat reduced. The mean MTR values (n524 samples for each material and frequency offset data point) are plotted in Figure 1A and B.
The relationship between the gadolinium concentration in the egg materials and the MTR was explored by means of the data obtained at a section excitation flip angle of 22° and an RMS B1 amplitude of 270 Hz, and is plotted in Figure 1C. A quasilinear regression analysis using a first-order exponential model (Y5 AeBX, with Y5MTR, X5
gadolinium concentration, A 5 linear constant, and B5 exponential rate constant) was applied to the experimental data to model the MTR as a function of gadolinium con-centration for MT pulse frequency offsets ranging from 1000 to 6000 Hz.
Section Excitation Flip Angle
[image:3.587.309.547.108.180.2]The effect of alterations in section excitation flip angle on the observed MTR of the gadolinium-doped egg solu-tions, the aqueous phantoms, and normal callosal white matter was studied at high power and narrow frequency
TABLE 2: Effect of MT power on the magnetization transfer ratio (MTR) of white matter
B1 (RMS Amplitude), Hz
B1 (Peak Amplitude), Hz
White Matter MTR, Mean61 SD*
270 700 75.261.5
233 600 68.361.6
170 437 59.961.6
75 193 33.861.8
Note.—All images were acquired with 1000 hz offset and a 6° flip angle.
offset (B1RMS5270 Hz, 1000 Hz frequency offset), the MT
pulse parameters that had resulted in the highest MTRs. Reference (B150) and MT data sets were acquired at flip angles of 3°, 6°, 9°, 12°, 15°, 18°, 20°, 22°, 24°, 26°, 28°, and 30° (n 5 24 samples for each material at each flip angle). The mean MTR values for the egg materials, the phantom aqueous solutions, and normal callosal white matter were plotted as a function of flip angle (Fig 2).
Signal Intensity Analysis
The mean normalized signal intensities of the egg ma-terials and normal callosal white matter were obtained for both the reference (B1 5 0) and MT data sets (n5 24 samples for each material and flip angle). A plot of nor-malized, mean signal intensity as a function of section excitation flip angle is shown in Figure 3. On this and all subsequent figures, each different phantom material has a unique symbol, with the open symbol representing the mean value on the reference data sets and the filled sym-bol representing the mean value on the MT data sets.
The relationship between the experimental signal inten-sity data and that theoretically predicted by the Ernst equation (29), defined as a 5 cos21 [e2TR/T1], was
ex-plored for the phantom materials on both the non-MT and MT sequences by noting the flip angle that experimentally produced the greatest signal intensity and comparing it with that predicted by using the T1 values from Table 1, with statistical analysis (Pearson’s correlations) and linear regression analysis. These results are listed in Table 3. The Ernst angle relationship was then used to estimate the T1sat(the T1 observed in a tissue under conditions of MT
saturation) and pseudo–first-order rate constant,k, for MT in the egg material and normal white matter.
Lesion-to-Background Ratio
Using the gadolinium-doped egg materials as a model reflecting the various degrees of enhancement of brain
tumors, we analyzed the impact of gadolinium concentra-tion and the secconcentra-tion excitaconcentra-tion flip angle on the simulated lesion-to-background white matter contrast. In the rele-vant literature (1–14), the most frequently used parame-ters to describe lesion contrast are the contrast-to-noise ratio (C/N) and lesion-to-background ratio. A dominant portion of this investigation was to be the analysis of the impact of section excitation flip angle on MTR and lesion contrast. The section excitation flip angle range of 3° to 30° produces great changes in the signal-to-noise ratio (S/N) and contrast on the images, proceeding from an essentially proton density–weighted image to a heavily T1-weighted image. Although sequence sampling factors are identical, there was concern about the complexity in-volved in performing a valid normalization of the data for the S/N impact owing to changes in section excitation flip angle, which would otherwise influence C/N data. Also, since the number of primary measurements obtained was large, the individual measurements are relatively short for 3-D techniques (2 minutes); the goal was not to evaluate sequence parameters affecting S/N or to create high S/N images but to evaluate multiple parameters affecting le-sion contrast. Therefore, the parameter chosen to describe the contrast between the gadolinium-doped egg solutions and normal callosal white matter was the simple lesion-to-background ratio. The mean lesion-to-lesion-to-background values were obtained by dividing the normalized mean signal intensities of the different egg materials by the mean signal intensities of normal callosal white matter, consistent with respect to MT application, at the various section ex-citation flip angles. The plot of lesion-to-background con-trast as a function of section excitation flip angle is shown in Figure 4.
Contrast Enhancement Ratio
[image:4.587.56.546.97.257.2]The ability of the conventional and MT gradient-echo techniques to depict the change in signal intensity of a simulated enhancing lesion after contrast administration
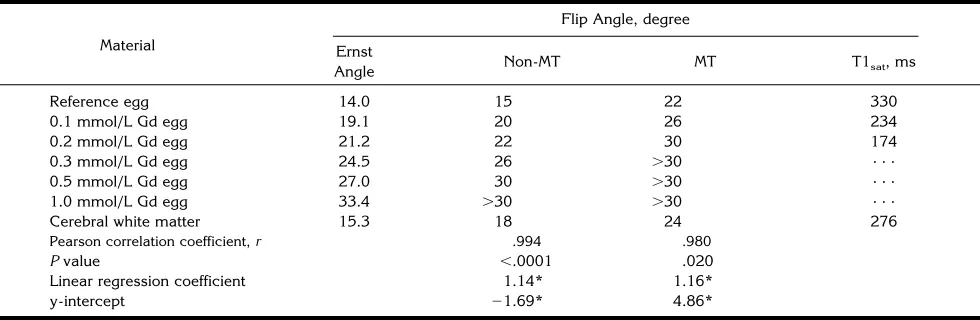
TABLE 3: Estimation of T1satfrom the curves of signal intensity as a function of flip angle (Fig 3) using the Ernst equation relationships
Material
Flip Angle, degree
Ernst
Angle Non-MT MT T1sat, ms
Reference egg 14.0 15 22 330
0.1 mmol/L Gd egg 19.1 20 26 234
0.2 mmol/L Gd egg 21.2 22 30 174
0.3 mmol/L Gd egg 24.5 26 .30 . . .
0.5 mmol/L Gd egg 27.0 30 .30 . . .
1.0 mmol/L Gd egg 33.4 .30 .30 . . .
Cerebral white matter 15.3 18 24 276
Pearson correlation coefficient,r .994 .980
Pvalue ,.0001 .020
Linear regression coefficient 1.14* 1.16*
y-intercept 21.69* 4.86*
Note.—Gd egg indicates gadolinium-doped Eggbeaters.
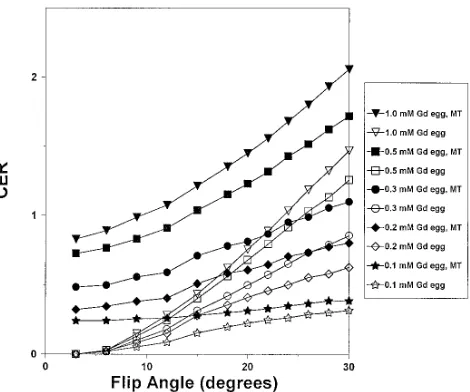
was explored using a parameter called the contrast en-hancement ratio(CER), defined as CER5[(SIgad2SIref)/
SIref], where SIgadis the normalized mean signal intensity
of the gadolinium-doped egg materials and SIref is the
[image:5.587.79.261.83.615.2]normalized mean signal intensity of the reference, gado-linium-free, egg material. This parameter was developed to assess the importance of the degree of T1 weighting of the imaging sequence in determining that a given bright lesion on an MT image has actually enhanced. The CER on conventional and MT gradient-echo sequences was plot-ted as a function of section excitation flip angle for the various concentrations of gadolinium in Figure 5.
[image:5.587.321.534.83.280.2]Fig 3. Plot of normalized signal intensity as a function of sec-tion-select flip angle for phantom materials without (open sym-bols) and with (filled symbols) MT. There is a complex, gadolin-ium-dependent behavior of the signal intensity of the egg materials as a function of the section-select flip angle.
Fig 1. Z-spectra show the relationship between the MTR of tissues and the frequency offset of the MT pulse.
AandB, These Z-spectra are obtained at high MT power (RMS B1 amplitude5270 Hz), at a 6° section-select flip angle (A) and a 22° section-select flip angle (B). The Z-spectra are influenced by the T1 weighting of the imaging sequence; although the curve shapes are congruent, there are higher MTR values at low flip angles.
C, Plot of MTR as a function of gadolinium concentration for the egg materials at multiple MT pulse frequency offsets shows a negative correlation between MTR and gadolinium concentration, well modeled by a first-order exponential function.
[image:5.587.307.545.337.530.2]Results
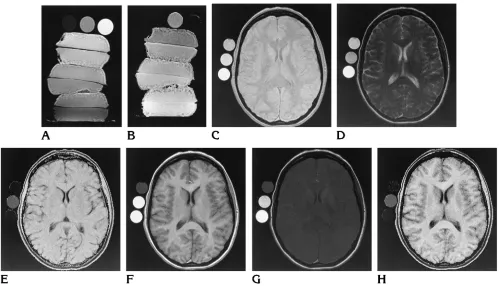
The egg phantom with aqueous solutions is shown on a T1-weighted image in Figure 6A and in a calculated MTR image in Figure 6B. The reference egg patty is at the bottom, and successively higher stacked patties are in in-creasing gadolinium concentrations. The three aqueous solutions, seen as the circles of varying signal intensity on top of the egg materials, are as follows: the aqueous solution on the phan-tom’s right is distilled water, in the middle is 0.4 mmol/L MnCl2, and on the phantom’s left is 0.1 mmol/L gadolinium solution. Images of the brain of a healthy volunteer without (Fig 6C) and with (Fig 6D) MT, obtained with identical window and level settings, show the high MTR achieved with the high MT power technique. A calculated MTR image at a 6° flip angle is shown in Fig 6E. The mean MTRs for normal callosal
white matter and gray matter were 75.2% 6
1.5% and 67.9%61.1%, respectively (P,.01, unpaired two-tailed Student’s t test). Note that with low section excitation flip angles, there is a fairly uniform MTR map of the brain. The refer-ence (non-MT), MT, and calculated MTR im-ages from data acquired with a 22° flip angle are
shown in Figure 6F through H, respectively. Note that when T1-weighted primary data are acquired, the calculated MTR map shows a more prominent difference in the MTRs of gray matter and white matter, with mean MTRs of
61.2% 6 1.8% for white matter and 47.5% 6
1.3% for gray matter (P , .01, unpaired two-tailed Student’s t test).
T1 and T2 Measurements
The T1 and T2 measurements are listed in Table 1. The reference egg material (gadolini-um free) has T1 and T2 values similar to cere-bral gray matter. With increasing concentration of gadolinium in the egg materials, there is pro-gressive shortening of T1 and T2. The range of values for T1 (138 to 832 milliseconds) and T2 (40 to 79 milliseconds) displayed by the egg phantom covers a substantial portion of the ex-pected range of values for most enhancing brain lesions seen in the clinical setting.
MT Power Analysis
[image:6.587.311.546.83.279.2] [image:6.587.50.293.84.283.2]There was a strong positive correlation be-tween effective MT power and the MTR for nor-mal callosal white matter (Pearson’s correlation coefficient, r 5 .988; P , .01), as shown in Table 2. The highest effective MT power (RMS Fig 5. The contrast enhancement ratio simulates the ability of the MT sequence to show that a bright lesion has actually en-hanced after administration of contrast material. As expected, there is a positive relationship between the CER and the degree of T1 weighting of the imaging sequence, as modulated by the section-select flip angle.
amplitude, 270 Hz) produced an MTR of 75.26 1.5% when the frequency offset was 1000 Hz and a low (6°) section excitation flip angle was used. Although higher effective powers were at-tainable, the SAR values became substantially higher than our institutional review board–proved level of 4 W/kg. Virtually all of the ap-plied RF energy accounted for in the SAR value was from the MT pulse; the SAR on the non-MT 3-D gradient-echo images was less than 0.05 W/kg.
MT Pulse Frequency Offset Analysis
The relationships between the frequency off-set of the MT pulse and the MTR of the phantom materials and normal callosal white matter are shown in Figure 1A and B. The plots shown in Figure 1A are mean MTR measurements at a low (6°) section excitation flip angle; it is at these low flip angles that the mean MTR values are greatest. The plots in Figure 1B are mean MTR measurements at a 22° flip angle, which is Fig 6.A, The gadolinium-doped egg material phantom is shown in a T1-weighted spin-echo image (500/16/2). The egg patties are stacked in descending gadolinium concentrations from the top (top patty, 1.0 mmol/L gadolinium; bottom patty, no gadolinium). The three aqueous solutions are above the egg patties (to the right of the phantom is distilled water, in the middle is the 0.4 mmol/L MnCl2
solution, and to the left is the 0.1 mmol/L gadolinium solution).
B, Calculated MTR image of the egg patties, with the highest MTR shown in the reference egg material and the lowest MTR in the 1.0 mmol/L gadolinium egg solution. Note that the aqueous gadolinium solution and distilled water have MTRs near zero, but the MnCl2
solution has a moderately low MTR, near that of the 1.0 mmol/L gadolinium egg material.
C, Reference (non-MT) image of the brain obtained with the RF-spoiled, 3-D gradient-echo sequence (25/4.5) at a 6° section excitation flip angle. The three aqueous solutions are adjacent to the volunteer’s head (at top is distilled water, in the middle is the 0.4 mmol/L MnCl2solution, on the bottom is the 0.1 mmol/L gadolinium solution).
D, Image with MT, at an effective power of 270 Hz (RMS B1 amplitude), with a frequency offset of 1000 Hz, obtained at identical window and level settings as inC.
E, Calculated MTR image shows mean MTRs of 75.2%61.5% for white matter and 67.9%61.1% for gray matter, with a fairly uniform MTR map of the brain. Again note that the aqueous gadolinium solution and distilled water have MTRs near zero, but the MnCl2solution
has a moderately low MTR.
F, Reference (non-MT) image of the brain with a section excitation flip angle of 22° shows strong T1 weighting.
G, Image with MT, at an effective power of 270 Hz (RMS B1 amplitude), with a frequency offset of 1000 Hz, obtained at identical window and level settings as inF.
[image:7.587.49.548.82.368.2]a strongly T1-weighted flip angle for this (TR5 25) sequence. There is a progressive decrease in MTR with increasing frequency offset for white matter and all phantom egg materials (Pearson’s correlation coefficients ranged from
r5 2.823 to2.989; allPvalues were,.006). Note that the curves are steepest in the narrow frequency offset range of less than 2000 Hz. This is also the range in which there is a sub-stantial MTR for the aqueous solution of MnCl2; since this solution has no macromolecular con-stituents, this is not due to MT but most likely to a combination of direct saturation and spin locking. These findings are consistent with those previously described by Ulmer et al (9). Note that the difference between the MTR of normal callosal white matter and all the egg materials is greatest at the narrowest frequency offset (1000 Hz); this is true at both section excitation flip angle conditions. It is at this nar-row frequency offset that the greatest impact on simulated lesion-to-background white matter contrast is demonstrated; therefore, a 1000-Hz frequency offset was used for the lesion-to-background simulations.
There was a progressive reduction in MTR of the egg materials with increasing gadolinium concentration over the entire frequency offset range (Pearson’s correlation coefficients ranged from r 5 2.974 to 2.997; all P values were
,.0001). The reference egg material (gadolin-ium free) displayed an MTR of approximately 70% to 80% that of normal callosal white matter. Note that the curve for the reference egg mate-rial is not identical in shape to that for white matter; this reflects a difference in the semisolid line-shape functions between the egg material and white matter. Note that the Z-spectra for the various concentrations of gadolinium-doped egg material are nearly identical parallel curves (Spearman’s rank correlation coefficient, r 5
.876; P, .001).
The relationship between MTR and gadolin-ium concentration in the egg materials is shown in Figure 1C. The quasilinear regression analy-sis using a first-order exponential model (Y 5
AeBX) was applied to the curves at the various MT pulse frequency offsets. Goodness of fit sta-tistics showed a high correlation coefficient be-tween the first-order exponential model and the experimental data (for all curves the r values were .963 to .982). The exponential rate con-stants (B) were quite close for MT pulse fre-quency offsets from 2000 to 6000 Hz, with a
mean of2.856 and a range of2.825 to2.888, independent of the MT pulse frequency offset. For the narrow MT pulse frequency offsets, the constant, B, was reduced, down to a value of
2.725 at 1000 Hz. The linear constants (A) ranged from 37.8 (1000 Hz offset) to 23.6 (6000 Hz offset), with a strong negative corre-lation betweenAand MT pulse frequency offset (Pearson’s correlation coefficient, r 5 2.965;
P,.0001).
Effect of Section Excitation Flip Angle on MTR
The effect of alterations in section excitation flip angle on mean MTR is shown in Figure 2,
with measurements made at B1RMS 5 270 Hz,
1000-Hz frequency offset. For white matter and all egg materials, the MTR was greatest at the lowest section excitation flip angle, and there was a progressive reduction in MTR with in-creasing flip angle (Pearson’s correlation coef-ficients ranged fromr 5 2.987 to2.998; all P
values were ,.0001). The degree of reduction in MTR over the section excitation flip angle range of 3° to 30° was 25% for callosal white matter and varied from 25% to 35% for the egg materials. For the egg materials, the relation-ship between flip angle and MTR was dependent on gadolinium concentration. A negative corre-lation between gadolinium concentration and the magnitude of the flip angle– dependent re-duction in MTR was shown (Pearson’s
correla-tion coefficients ranged from r 5 2826 to
2.904; all Pvalues were ,.05).
Signal Intensity Analysis
based on the experimentally determined T1 val-ues in Table 1 (Pearson’s correlation coefficient,
r5.994;P,.0001). Linear regression analysis of the theoretical (Ernst equation– derived) ver-sus experimental flip angle for maximum signal amplitude of the egg materials yielded a coeffi-cient of 1.14, with y-intercept 5 21.69. Note that the maximum signal intensity was not ex-perimentally achieved for the 0.5 mmol/L and 1.0 mmol/L gadolinium egg materials within the 3° to 30° flip angle range.
On the MT sequences, the signal intensity of all egg materials and normal white matter was less than on the non-MT sequences over the entire flip angle range (allPvalues,.01, paired two-tailed Student’sttest). Note that the curves for the egg materials show a shift to the right; that is, the peak signal intensity occurs at a higher flip angle than on the non-MT sequences and at a higher flip angle than that predicted by the Ernst equation. This is experimental confir-mation of the apparent shortening of the T1 relaxation constant of tissue in MT experiments, which has been described and modeled by Wolff and Balaban (30) and others (31, 32). The methods used in those studies for obtaining T1 values under the conditions of saturation (T1sat) (that is, multiple inversion recovery measure-ments) are not particularly well suited to this method of high MT power, short-TR, 3-D gradi-ent-echo imaging. However, since the experi-mental, non-MT signal intensity data for the egg materials follow very closely the relationship between T1, TR, and flip angle described in the Ernst equation (29), we may use the same re-lationship to estimate T1sat from the MT signal intensity data of Figure 3. Although the peaks are broader on the MT data, and the flip angle sampling somewhat coarse, one can still esti-mate the flip angle at which peak signal ampli-tude is achieved. The reference egg material had a peak signal intensity at 22° with MT sat-uration, which corresponds to a T1sat of 330 milliseconds under our exact experimental con-ditions (by the inversion recovery method in Table 1, T1 5832 milliseconds). The gadolin-ium-doped egg materials showed a concentra-tion-dependent reduction in T1sat. The pseudo– first-order rate constant for MT for the reference egg material can then be determined by the
method of Wolff and Balaban (30), k 5 (1/
T1sat)(1 2Ms/Mo). Since (1 2 Ms/Mo) equals the MTR, the equivalent expression isk5MTR/ T1sat51.25 sec21for the reference egg
mate-rial. Thekvalue for the 0.1 mmol/L gadolinium egg material is 1.54 sec21; for the 0.2 mmol/L gadolinium egg material, the k value is 1.81 sec21. For normal callosal white matter, T1satis experimentally found to be 276 milliseconds, and the pseudo–first-order rate constant k 5
2.28 sec21.
Lesion-to-Background Ratio
The lesion-to-background curves, as shown in Figure 4, demonstrate complex relationships of lesion-to-background contrast with gadolin-ium concentration, section excitation flip angle, and the presence or absence of MT. The appli-cation of MT resulted in a statistically significant increase in lesion-to-background contrast for all gadolinium concentrations (allPvalues were, .005, by paired two-tailed Student’sttest, for all pairs of MT and non-MT data points at each gadolinium concentration and flip angle).
On the non-MT sequences at low flip angles (9° or less), where there was little inherent T1 weighting, the lesion-to-background ratio was near unity, and there was not much difference between different gadolinium concentrations. At moderate section excitation flip angles, there was a positive relationship between lesion-to-background ratio and gadolinium concentra-tion. Note that the curves have not peaked by the 30° flip angle point; there are further gains to be made in lesion-to-background contrast, es-pecially for lesions with higher gadolinium con-centrations. However, as shown in Figure 3, at these higher flip angles, the less concentrated gadolinium egg materials are losing signal with further increases in flip angle due to saturation by the section excitation pulse.
The MT sequences show a positive relation-ship between gadolinium concentration and le-sion-to-background contrast over the entire flip angle range (Pearson’s correlation coefficient,
r 5 .992; P , .001). The relationship between lesion-to-background contrast and flip angle is complex; the reference egg material (no gado-linium) shows a weak negative correlation of lesion-to-background contrast with flip angle (Spearman’s correlation coefficient,r5 2.587;
lesion-to-background contrast and flip angle
(Spearman’s correlation coefficient, r 5
2.5175; P 5 .085), with the lesion-to-back-ground ratio between 1.86 and 1.73 over the 3° to 30° flip angle range. This probably reflects a relative balance between the negative effect on lesion-to-background contrast from loss of MT weighting (actually, proton-density weighting), and positive effects on lesion-to-background contrast from gains in T1 weighting. For gado-linium concentrations of 0.2 mmol/L to 1.0 mmol/L, there was a statistically significant, positive correlation between lesion-to-back-ground contrast and flip angle (Pearson’s cor-relation coefficients ranged from r 5 .962 to .974; allPvalues were,.001). Again, note that the peak in lesion-to-background contrast was not achieved on the MT sequences within the flip angle range of 3° to 30°, and for the more concentrated gadolinium materials there are further gains in contrast to be made at higher section excitation flip angles.
In general, the higher the gadolinium concen-tration the greater the degree of lesion-to-back-ground improvement made by implementing MT (Pearson’s correlation coefficients for 0.1 to 1.0 mmol/L gadolinium egg materials ranged fromr5.753 to .975; allPvalues were,.005). A negative correlation between the relative le-sion-to-background improvement with MT and flip angle was seen for the gadolinium-doped egg materials (Pearson’s correlation coeffi-cients for 0.1 to 1.0 mmol/L gadolinium egg materials ranged fromr5 2.973 to2.995; allP
values were , .001). For example, at a flip
angle of 3°, the relative lesion-to-background improvement ranged from 2.07 (0.1 mmol/L gadolinium) to 3.15 (1.0 mmol/L gadolinium). At a flip angle of 30°, the relative lesion-to-background improvement ranged from 1.53 (0.1 mmol/L gadolinium) to 1.80 (1.0 mmol/L gadolinium).
Contrast Enhancement Ratio
The CER was formulated to give an assess-ment of the change in signal intensity of a sim-ulated enhancing lesion with gadolinium admin-istration. CER was plotted as a function of flip angle for the 0.1 to 1.0 mmol/L gadolinium concentrations in Figure 5. The application of MT resulted in a statistically significant increase in CER for all gadolinium concentrations and at
all flip angles (allPvalues were,.01, by paired two-tailed Student’s t-test, for all pairs of MT and non-MT data points at each gadolinium concentration and flip angle).
As expected, there was a strong positive cor-relation between gadolinium concentration and CER for both the MT and non-MT techniques. Pearson’s correlation coefficients ranged from
r 5 .765 (0.1 mmol/L gadolinium, non-MT) to
r 5 .989 (1.0 mmol/L gadolinium, MT); all P
values were less than .005. There was also a strong positive correlation between CER and section excitation flip angle on both the MT and non-MT techniques (Pearson’s correlation coef-ficients ranged from r 5 .978 to .994; all P
values were , .001); in other words, the more T1-weighted the sequence, the greater the CER. The higher gadolinium concentrations (0.2 to 1.0 mmol/L) did not attain a peak CER in the flip angle range of 3° to 30°. On the MT scans, the CER curve for the lowest gadolinium con-centration (0.1 mmol/L) was fairly flat, but there was a plateau in CER at 28° to 30°.
Discussion
Several clinical investigations have shown an improved lesion-to-background ratio on con-trast-enhanced T1-weighted images obtained with the use of MT (1–9); however, rigorous analysis of the relevant MT and sequence pa-rameters has not been possible. In clinical stud-ies, there are temporal changes in signal inten-sity of enhancing lesions, and the intralesional gadolinium concentration is variable and not known. The gadolinium-doped egg materials represent a simple tissue phantom in which the gadolinium concentrations are known and in a relevant range, and the T1 and T2 relaxation constants are known. One can determine the effects of three important parameters of T1-weighted, short-TR, RF-spoiled, 3-D gradient-echo MT sequences—namely, effective MT power, MT pulse frequency offset, and section excitation flip angle—in a stable experimental system. By acquiring normal white matter data from measurements in healthy volunteers with the use of identical MT pulse and sequence parameters, and by performing a valid normal-ization of data, one can simulate enhancing le-sion-to-background white matter contrast un-der a wide variety of experimental conditions.
greatest lesion-to-background contrast for T1-weighted, 3-D gradient-echo images are high effective MT power and narrow MT pulse fre-quency offset; these are the same general rules that apply to T1-weighted spin-echo MT imag-ing. Ulmer et al (9) showed that one could take advantage of indirect (MT) saturation, direct saturation, and spin-locking effects to augment the enhancing lesion-to-background contrast on T1-weighted spin-echo MT sequences by us-ing small MT pulse frequency offsets. The ex-perimental data in Figure 1 confirms this for the T1-weighted 3-D gradient-echo technique as well; the difference between the curve for white matter and that for the gadolinium-doped egg materials is greatest at the narrowest frequency offset. Ulmer et al (3), in their experimental MT protocol, rightly suggested that further in-creases in contrast could be gained by using MT pulse frequency offsets of less than 1000 Hz. Frequency offsets less than 1000 Hz were not explored in the present experiment; in this range, one expects that different MT pulse shapes and bandwidths will significantly affect the degree of direct saturation and spin locking (26). The 3-D gradient-echo MT sequence used in this experiment produced a substantially greater MT effect than that reported in previous studies using spin-echo techniques (1–9), fun-damentally as a result of a higher effective MT power.
The egg materials have an innate MT behav-ior that is different from normal white matter; the MTR is less than that of normal white matter at constant power and offset, and the MT fre-quency offset response of the egg materials is also different from white matter. Note that the Z-spectra of the gadolinium-doped egg materi-als, as shown in Figure 1, are highly congruent, especially when one gets out of the range of significant direct saturation and spin-locking ef-fects. For formal semisolid line-shape analysis, MTR values at a much larger range of MT pow-ers and frequency offsets are required (G. C. Hurst, J. L. Duerk, “A Method for Discrete Nu-merical Estimation of Semisolid Lineshape from MT Z-Spectra and Initial Application to Phan-tom, in Vitro, and Human in Vivo Samples,” presented at the annual meeting of the Society of Magnetic Resonance, Nice, France, August 1995). Although no formal line-shape analyses of in vivo brain tumors have been published, it is not unexpected that there will be differences in the MT behavior between various brain tumors
and normal white matter. Lundbom (33) showed that astrocytomas had reduced MT contrast (MTR), and that high-grade astrocyto-mas had greater MT contrast than low-grade tumors, most likely relating to the amount of nuclear material in the tumors. Lundbom also found a correlation between collagen content and MT contrast in meningiomas (33). Other investigators have quantified MT system pa-rameters for in vivo tissues, ex vivo tissues, and various phantom materials (15–22).
The relationship between gadolinium con-centration and MT behavior of an enhancing lesion has not been precisely described. En-hancing lesions experience some indirect (MT) saturation, direct saturation, and spin locking, but to a lesser degree than the rest of the brain. The experimental evidence from the egg phan-tom clearly shows an inverse relationship be-tween the gadolinium concentration and these off-resonance RF effects. Although not compre-hensive, the experimental data support a math-ematical model of a first-order exponential
de-cline in MTR with increasing gadolinium
concentration, with varying linear and exponen-tial constants depending on the MT parameters. It is postulated that the addition of gadolinium, with resultant shortening of the T1 and T2 of the free water protons, will shift or scale the semi-solid line shape of a given material, but not significantly alter the shape. The crux of the issue on a biochemical level is whether the gad-olinium is only influencing the relaxation pa-rameters of the free-water proton pool, whether it can effect the relaxation parameters of the bound-water proton pool, or whether it can somehow alter the association or relaxation ki-netics of water protons in the boundary layer. These are valid concerns, not only for the egg model but also for in vivo brain lesions. Formal semisolid line-shape analysis of data from these egg materials is the subject of a current inves-tigation.
The simple estimation of T1sat used in this report— obtained by exploiting the experimen-tally determined strong correlation of T1, TR, and flip angle as described by the Ernst equa-tion—is both novel and valid, because one de-rives the T1sat values under the exact experi-mental conditions being used for the lesion-to-background contrast analysis. The sequence is well spoiled, with RF spoiling of residual trans-verse magnetization twice per TR. The T1satand
white matter data of Hajnal et al (31) and to the values of other tissues detailed by Wolff and Balaban (30) and Eng et al (32). This is largely related to the fact that in all these experimental works, data are obtained at a high enough ef-fective MT power to assume essentially com-plete saturation of the bound-water proton pool. There is a minor experimental error in the spe-cific values of T1sat obtained in this work; namely, that the data of Figure 4 were obtained with a 1000-Hz frequency offset of the MT pulse, a range in which there was significant direct saturation and spin-locking effects. For a more precise estimation of T1sat and k, addi-tional data need to be obtained at frequency offsets of approximately 4000 to 5000 Hz, where these second-order effects are minimal. Preliminary data also suggest an inverse rela-tionship between gadolinium concentration in the egg materials and T1sat and a positive rela-tionship between gadolinium concentration and
k. Further experimental studies are necessary at the higher gadolinium concentrations and at different MT powers and frequency offsets to fully substantiate these relationships.
The prominent flip angle– dependent effects on image contrast for short-TR, RF-spoiled, 3-D gradient-echo sequences (34 –36) make it an interesting parameter to explore. The section excitation flip angle impact on the gadolinium-enhanced lesion-to-background contrast has not been systematically analyzed for MT im-ages. The section excitation flip angle effects have been shown in this study to have two basic ranges: at low flip angles (3° to 12°), there is little T1-weighting, the MT effect is numerically greatest, and nonenhancing lesions have great-est contrast. At moderately high flip angles (15° to 30°), the MT effect has decreased by 25% to 35%, but there is more T1 weighting, and en-hancing lesions show variable, gadolinium con-centration– dependent increases in lesion-to-background contrast. Note that in Figure 4, the peak lesion-to-background ratio for the higher gadolinium concentrations was not experimen-tally found. This suggests a third regime, high flip angles (.30°), which are outside the range of what is usually considered “good” T1
weight-ing for these short-TR gradient-echo
se-quences, where further direct saturation by the section excitation flip angle augments lesion-to-background contrast for lesions with high gadolinium concentration. Thus, there is a
complex, gadolinium concentration– dependent, contrast optimization task.
Using MT to further increase the contrast of an already avidly enhancing lesion was not the goal of this study. It is perhaps more clinically relevant to analyze the MT and sequence pa-rameters that affect the contrast for the most faintly enhancing lesions. In Figure 4, the curve of lesion-to-background contrast as a function of flip angle for the lowest-concentration gado-linium egg material (0.1 mmol/L) is essentially flat, with no statistical correlation to the flip angle. Reference egg material showed a very mild decrease in lesion-to-background contrast with increasing flip angle. Here we have an ex-perimental condition of MT system parameters and sequence technique in which the negative effect on lesion-to-background contrast caused by a loss of MT saturation appears to be bal-anced by the positive effect resulting from greater T1 weighting. These preliminary data point to an intriguing paradox: for the detection of the most faintly enhancing lesions using these high-powered MT gradient-echo se-quences, the T1 weighting of the sequence does not appear to be critically important. Egg ma-terials with very low gadolinium concentrations (between reference egg and 0.1 mmol/L gado-linium) will lie between these two respective curves (Fig 4); they, too, would be expected to show greater lesion-to-background contrast on the MT images than on non-MT images. Of course, the determination of whether the faint lesion has actually enhanced after gadolinium administration still requires a rigorous compar-ison with the normalized signal intensity of the lesion on a precontrast MT image. The CER data show that the ability to detect whether a given lesion has enhanced is improved by using T1-weighted flip angles, even for low intrale-sional gadolinium concentrations.
contrast-enhanced images of patients in the clinical set-ting.
Acknowledgments
I thank Gregory C. Hurst and Jeffrey L. Duerk for their helpful discussions on portions of this work and Holly Frank for her diligent help in acquiring the MR data.
References
1. Elster AD, King JC, Mathews VP, Hamilton CA. Cranial tissues: appearance at gadolinium-enhanced and nonenhanced MR imag-ing with magnetization transfer contrast.Radiology 1994;190: 541–546
2. Tanttu JI, Sepponen RE, Lipton MJ, Kuusela T. Synergistic en-hancement of MRI with Gd-DTPA and magnetization transfer.
J Comput Assist Tomogr1992;16:19 –24
3. Kurki TJ, Niemi PT, Lundbom N. Gadolinium-enhanced magne-tization transfer contrast imaging of intracranial tumors.J Magn Reson Imaging1992;2:401– 406
4. Finelli DA, Hurst GC, Gullapali RP, Bellon EM. Improved contrast of enhancing brain lesions on post-gadolinium, T1-weighted spin-echo images with use of magnetization transfer.Radiology1994; 190:553–559
5. Mathews VP, King JC, Elster AD, Hamilton CA. Cerebral infarc-tion: effects of dose and magnetization transfer at gadolinium-enhanced MR imaging.Radiology1994;190:547–552
6. Mathews VP, Elster AD, King JC, et al. Combined effects of mag-netization transfer and gadolinium in cranial MR imaging and MR angiography.AJR Am J Roentgenol1995;164:169 –172 7. Runge VM, Wells JW, Kirsch JE. Magnetization transfer and high
dose contrast in early brain infection on magnetic resonance.
Invest Radiol1995;30:135–143
8. Mehta RC, Pike GB, Haros SP. Enzmann DR. Central nervous system tumor, infection, and infarction: detection with gadolini-um-enhanced magnetization transfer imaging.Radiology1995; 195:41– 46
9. Ulmer JL, Mathews VP, Hamilton CA, Elster AD, Moran PR. Mag-netization transfer or spin-lock? An investigation of off-resonance saturation pulse imaging with varying frequency offsets.AJNR Am J Neuroradiol1996;17:805– 819
10. Schmiedl UP, Kenney J, Maravilla KR. Kinetics of blood-brain-barrier permeability in an astrocytic glioma using contrast-en-hanced MR.AJNR Am J Neuroradiol1992;13:5–14
11. Yuh WTC, Nguyen HD, Tali ET, et al. Delineation of gliomas with various doses of MR contrast material.AJNR Am J Neuroradiol
1994;15:983–989
12. Haustein J, Laniado M, Niendorf HP, et al. Administration of gadopentetate dimeglumine in MR imaging of intracranial tumors: dosage and field strength. AJNR Am J Neuroradiol 1992;13: 1199 –1206
13. Haustein J, Laniado M, Niendorf HP, et al. Triple dose versus standard dose gadopentetate dimeglumine: randomized study in 199 patients.Radiology1993;186:855– 860
14. Yuh WTC, Tali ET, Nguyen HD, et al. Effect of contrast dose, imaging time, and lesion size in the MR detection of intracerebral metastases.AJNR Am J Neuroradiol1995;16:373–380 15. Koenig SH, Brown RD III. A molecular theory of relaxation and
magnetization transfer: application to cross-linked BSA, a model for tissue.Magn Reson Med1993;30:685– 695
16. Koenig SH, Brown RD III, Ugolini R. Magnetization transfer in cross-linked bovine serum albumin solutions at 200 MHz: model for tissue.Magn Res Med1993;29:311–316
17. Brooks D, Kuwata K, Schleich T. Determination of proton mag-netization transfer rate constants in heterogeneous biological sys-tems.Magn Reson Med1994;31:331–336
18. Hua J, Hurst GC. Measurement of T 2r via magnetization transfer Z-spectra.J Magn Reson1994;107:220 –224
19. Zhou D, Bryant RG. Magnetization transfer, cross-relaxation, and chemical exchange in rotationally immobilized protein gels.Magn Reson Med1994;32:725–732
20. Henkelman RM, Huang X, Xiang QS, Stanisz GJ, Swanson SD, Bronskill MJ. Quantitative interpretation of magnetization trans-fer.Magn Reson Med1993;29:759 –766
21. Holt RW, Duerk JL, Hua J, et al. Estimation of Bloch model MT spin system parameters from Z-spectral data.Magn Reson Med
1994;31:122–130
22. Morrison C, Henkelman RM. A Model for magnetization transfer in tissues.Magn Reson Med1995;33:475– 482
23. Brasch RC, Weinmann HJ, Wesbey GE. Contrast-enhanced NMR imaging: animal studies using gadolinium-DTPA complex.AJR Am J Roentgenol1984;142:625– 630
24. Nelson KL, Runge VM. Basic principles. In: Runge VM, ed. En-hanced Magnetic Resonance Imaging. St Louis, Mo: Mosby; 1989:63
25. Hendrick RE, Haacke EM. Basic physics of MR contrast agents and maximization of image contrast. J Magn Reson Imaging
1993;3:137–148
26. Hua J, Hurst GC. Analysis of on- and off-resonance magnetization transfer techniques.J Magn Reson Imaging1995;5:113–120 27. Dousset V, Grossman RI, Ramer KN, et al. Experimental allergic
encephalo-myelitis and multiple sclerosis: lesion characterization with magnetization transfer.Radiology1992;182:483– 491 28. Finelli DA, Hurst GC, Amantia P, Gullapali RP, Apicella A.
Cere-bral white matter: technical development and clinical applications of effective MT power concepts for high power, thin section, quantitative MT examinations.Radiology1996;199 :219 –226 29. Ernst RR, Anderson WA. Application of Fourier transform
spec-troscopy to magnetic resonance.Rev Sci Instr1966;37:93–102 30. Wolff SD, Balaban RS. Magnetization transfer contrast (MTC) and
tissue water proton relaxation in vivo.Magn Reson Med1989;10: 135–144
31. Hajnal JV, Baudouin CJ, Oatridge A, et al. Design and implemen-tation of magnetization transfer pulse sequences for clinical use.
J Comput Assist Tomogr1992;16:7–18
32. Eng J, Ceckler TL, Balaban RS. Quantitative 1H magnetization
transfer imaging in vivo.Magn Reson Med1991;17:304 –314 33. Lundbom N. Determination of magnetization transfer contrast in
tissue: MR imaging study of brain tumors.AJR Am J Roentgenol
1992;159:1279
34. Chappell PM, Pelc NJ, Foo TKF, Glover GH, Haros SP, Enzmann DR. Comparison of lesion enhancement on spin-echo and gradi-ent-echo images.AJNR Am J Neuroradiol1994;15:37– 44 35. Rand S, Maravilla KR, Schmiedl U. Lesion enhancement in
radio-frequency spoiled gradient echo imaging: theory, experimental evaluation, and clinical implications. AJNR Am J Neuroradiol
1994;15:27–35