With 15 text-figures Printed in Great Britain
FROG FAST MUSCLE
III. TWITCHES WITH ISOMETRIC AND INERTIAL LOAD
BY C. J. PENNYCUICK
Department of Zoology, University of Cambridge
{Received 31 July 1963)
INTRODUCTION
The experiments described in this paper were designed to determine the time course of the mechanical power output (tension x speed of shortening of contractile com-ponent) of frog fast muscle during twitches, and to see whether this is affected by loading the muscle in ways which allow different combinations of shortening and tension change to occur during the twitch.
The material was the fast component of the iliofibularis of the frog, and the experi-mental arrangement was the same as described previously (Pennycuick, 1963 a). Basically, the method used was to prepare a set of curves of power output against tension at different times after the stimulus, under isotonic conditions, and then to produce similar curves from (1) isometric twitches, and (2) twitches against an inertial load.
COMPARISON OF ISOMETRIC AND ISOTONIC TWITCHES
Object
It has been assumed by most authors since Hill (1938) that the mechanical power output of the contractile component of a fast muscle during a twitch is a function only of the tension and the time after stimulus. If this assumption were correct a set of curves of power output against tension, with time after stimulus as parameter, taken under isometric conditions, should be identical with a similar set prepared from isotonic twitches as described by Pennycuick (1963 a). In the present paper isometric and isotonic curves from the same muscle are presented side by side for comparison. As the method of preparing the isometric curves suffers from certain defects, which will be pointed out, the analysis is limited to noting the major differences between the two sets.
Power in an isometric twitch
As an isometric twitch is one in which the length of the muscle does not change, no work is done in moving the external load, and consequently all the work done by the contractile component is expended in stretching the series elastic component. If the compliance of the latter is C, the rate of doing work, or mechanical power output is
P = CF(dF/dt),
where F is the tension.
In practice the compliance of the apparatus was appreciable in comparison with that of the series elastic component of the muscle, and the total (internal + external)
series compliance was used to compute the power output. This compliance was estimated from the transition from isotonic to isometric contraction as described by Pennycuick (19636), at a tension well above the resting tension.
Method
Ordinary isometric twitches, starting from the same resting tension, being repeat-able, always pass through the same tension at a particular time after the stimulus, so that an estimate of power output (deduced from rate of change of tension) can only be obtained for that one tension at that time. To construct curves corresponding to fig. 7 of Pennycuick (1963 a), estimates of power at several different tensions are required at each time. Hence the initial conditions must be altered so that successive isometric twitches pass through different tensions at the same time after the stimulus, and this was achieved in the following way.
Fig. 1. Upper trace (at start): tension, increasing downwards. Lower trace: shortening speed, increasing upwards. Isotonic contractions, all starting at the same length, interrupted by stop after progressively shorter distance. Scale: x, 10 msec./div.; y, 0144 cm./sec./div.; 3-3 g.wt./div.
One drawback of this method is that each isometric observation is made at a different length, but the muscle was, as has been explained (Pennycuick, 1963 a), shortening through its optimum working range of length, so the effects of this should be small.
All observations were made on the last of a series of 3 stimuli at 50 msec, intervals. A set of isotonic observations was made first at a series of different tensions: the isotonic tension was then kept constant while the short stop was progressively moved up for the isometric series. A set of records is shown in Fig. 1.
Analysis of records
The tension was measured off the isometric records at intervals of 5 msec. If the tension increases from Fx to F2 against a compliance C, the work done is
W=\C{F\-F\).
The average power output over the period in which this tension increase takes place is then W\t. Power output for successive periods of 5 msec, was calculated in this way, but owing to the limited accuracy with which the records could be measured, these power figures produced a rather irregular set of lines when plotted, as before, against tension with time as parameter.
The power was therefore plotted against time for each recording and a curve was drawn though the points by eye; a set of such smoothed curves is shown in Fig. 2. In order to plot a curve of power against force, for a given time, a point corresponding to the time in question was taken off each of the smoothed curves.
Fig. 3 b shows a set of such power against tension curves, and Fig. 3 a is a set of similar curves obtained by the isotonic method on the same muscle. The isometric set only covers the right-hand (high tension) side of the diagram, since all observations were necessarily made above the isotonic tension prevailing before the transition, and this tension was considerably higher than the resting tension.
It can be seen that the curves of the isometric set are more widely spread apart vertically at the top of the diagram than the isotonic ones, meaning that soon after the stimulus power is falling more quickly than under isotonic conditions. At the bottom, i.e. at late times, the isometric power falls more slowly than the isotonic, and at the end of an isometric twitch it continues to fall at a decreasing rate, giving the approxi-mately exponential decay of tension—there is no analogue of the velocity 'break' of the isotonic twitch.
The straight lines radiating from the origin in Fig. 3 b show various rates of change of tension in the isometric case, and it can be seen in a general way that the more rapidly tension is increasing the more widely spaced are the isometric lines relative to the isotonic ones.
It would not be justifiable to compare the two sets of curves in detail, as the con-ditions under which the observations were obtained differed in the following respects: (1) The history of tension change preceding each observation was always the same in the isotonic set, but variable for the isometric observations.
- 1 1 0 - 1 3 2 1 0
I -1
•2- 4
CL. O v
I
1
s
-a -b c ; \ " dV
>•+H
50 100 SO 100
Time (msec)
Fig. 2. Smoothed curves of power output against time, from stepwise graphical differentiation of the tension records of the last twitch in each record of Fig. 1, used for plotting Fig. 36. Lettering corresponds to Fig. 1.
Two further limitations are that both sets of observations were made at a variety of different muscle lengths, and that the compliance was assumed constant, whereas in practice it would have varied somewhat with tension.
TWITCH AGAINST AN INERTIAL LOAD
Isometric twitches differ from isotonic in that the mechanical power output rises too slowly while tension is increasing, and falls too slowly while tension is decreasing, leading ultimately to the exponential decay of tension, which continues for long after activity has ceased in the isotonic case. The results so far put forward suggest that the differences could be accounted for by a relation between rate of change of power and rate of change of tension, mediated by a feedback system. This would be a very powerful simplifying hypothesis, and would allow the performance against other types of load to be readily predicted.
A further simple type of load, an inertia, will now be considered. In life a muscle used in locomotion is called upon to shift objects of considerable mass, such as a limb, or the whole animal. The two types of load so far considered may be regarded as extreme cases: in an isometric contraction the muscle is presented with an infinite mass, which will not accelerate, however much force is applied to it, whereas an isotonic contraction is an approximation to zero mass, the aim being to keep the tension constant however rapidly the muscle accelerates.
A real load will have finite mass. If the speed of shortening is initially zero, tension will first of all build up, and as it does so the speed of shortening will increase at an acceleration proportional to the force. The mechanical power output at any moment will therefore have two components; Pt, the power expended in moving the external
load, and Pc, that expended in stretching the series compliance, so that
P = P1+Pc
= F[v + C(dFldt)],
where F is the tension, v the speed of shortening, and C the total series compliance.
METHOD
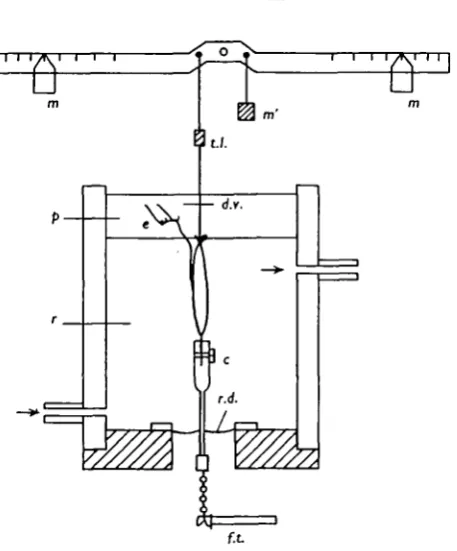
Fig. 4. is a diagram of the apparatus used to provide a variable mass. Length was still measured by connecting the muscle to a lever (transducer lever) the other end of which interrupted a beam of light focused on a photo-transistor, but instead of being connected to a source of constant tension (elastic), the end of the transducer lever was connected to a point near the fulcrum of a second lever (inertia lever). The inertia lever had two weights at equal distances on either side of the fulcrum, and the contribution of these weights to the moment of inertia of the whole assembly varied as the square of their distance from the fulcrum. Notches were cut on the inertia lever enabling the weights to be set at such distances as to give an effective mass at the muscle attach-ment variable between o-6 and 2-0 kg., in steps of 0-2 kg. A 5 g.wt. resting tension was established by hanging a 5 g. weight on the opposite side of the fulcrum from the muscle attachment.
Stimulation was by a single impulse to the nerve.
RESULTS
Twitch against inertia
starting to increase further. This shows that the load was not a pure mass, and there was appreciable compliance in the connexion between the transducer lever and the inertia lever. Although the phase relationship between force and tension here differed from that appropriate to a pure mass, the rate at which external work is being done by the muscle is still given by the tension times the speed of shortening, and the division of power into P{ and Pe is still valid.
5 0 1
-Isotonic
2 0
-30 35 40 45 50
Tension (g.wt.)
Fig. 3 a. Power output against tension in isotonic twitches, time after stimulus as parameter. The tension record looks like an isometric twitch with an abbreviated 'tail', and the speed record follows from the tension, the load being given. Fig. 6 shows tension records for o-6 and 2-0 kg. superimposed. With the smaller mass the tension reaches an earlier and lower peak and falls to zero sooner: since tension is a factor in both P, and
Pc the power falls to zero at the same time as the tension, although the muscle is still
shortening.
To determine the time course of mechanical power output, Pt and Pc must be added
(1) Up to 25 msec, the power is too low. This is also found in isometric twitches but the discrepancy is much reduced in the second and subsequent twitches of a series. The greater part of this difference may be ascribed to the fact that the twitch with inertial load was a single one, whereas the isotonic records were made on the last of a series of three twitches at 50 msec, intervals.
10 x
5-0 x 1 0s
dynes/sec.
2-5 x 10⁵
- 1 - 0
-25 30 35 40
Tension (g.wt.)
Fig. 36. Power output against tension in isometric twitches in the same muscle. Rate of change of tension is shown by the straight lines radiating from the origin,
(2) Actual and predicted powers agree closely until about 75 msec., when there is a 'corner' in the actual curve. The predicted curve dips downwards at the approach of the velocity break, while the actual curve shows a sharp decrease of slope (flattens out). The tension thereafter decays gradually, instead of disappearing in sudden relaxation, as would be predicted from the isotonic results. The decay of tension is, however, not exponential: if the logarithm of the tension i3 plotted against time, the curve 13 everywhere convex upwards, and instead of becoming straight as in an isometric contraction it curves ever more steeply downwards (Fig. 9).
The change in behaviour is more clearly seen if the contributions P, and Pc of the
twitch against 2 kg. mass are plotted separately (Fig. 10). After descending through zero power (at the tension- peak) Pe continues steeply downwards for about another
curves for 0 6 kg., from which it can be seen that the change of slope occurs sooner at the lower mass, and the ascent to zero power is thereafter steeper.
Fig. 11 shows superimposed curves of Pc against time for three intermediate masses,
o-8, i-2, and i-6 kg., and it can be seen that as the mass is reduced the turning point comes earlier, although at about the same (negative) power. If the mass is increased to infinity, as in the isometric twitch of which the earlier part is shown on the same diagram, the 'corner' in the curve becomes less sharp and the residual tension takes longer to decay.
Fig. 4. Diagram of apparatus for loading the muscle with a simulated inertia, c, Clamp; d.v., damping vane; e, electrodes;/./., force transducer;«./., inertia lever; m, moveable masses; m', biasing weight; p, paraffin; r, Ringer's solution; r.d., rubber diaphragm; t./., length trans-ducer lever, seen end on.
These experiments do not allow one to decide what triggers off the change on behaviour marked by the 'corner' in the Pe curves. It might, for instance, be related
to a particular combination of rate of change of tension and total power. It may or may not be fortuitous that integration of the speed records shows that the change occurs in each case after about o-6 mm. shortening: alternatively, it might be a function of Pc and time, and other correlations could doubtless be unearthed.
Fig. 5. Upper trace: tension, increasing downwards. Lower trace, shortening speed, increasing upwards, (a-h) Twitches against an inetria. Effective masses of load, in kg.: a, o-6; b, o-8; c, 1 -o; d, 1-a; e, 1-4;/, i-6;£, i-8; h, 2-0. (i-j) Isometric contractions of 1 and 2 stimuli, in the same muscle.
Time (msec)
[image:9.451.65.387.383.584.2]Another possibility is that instead of such a feedback system, the muscle suddenly turns into a viscous resistance having the dimensions of force over velocity ( = MT~X).
We would then have the arrangement shown in Fig. 12, in which the differential equation for the decay of tension is
d*F j_dF 1
dt
i+RC dt
+MC ~
(0
where F is the force, M the mass and R the viscous resistance, and C the series compliance. If
F = Ae
31,
then
/ / _ _ \
(2)
150 Time (msec.)
Fig. 7. Crosses: total power output against time in a twitch against 2-0 kg. inertia (from Fig. 5). Circles: power output predicted from the isotonic data of Fig. 8.
If M is infinite (isometric contraction) then (2) reduces to
B = o (trivial) or - i/RC,
so that
(3)
decayed from 36-0 x io3 to 12-9 x io3 dynes, which, combined with a series compliance of i-o x io"6 cm./dyne, gives a viscous resistance of i-o x io8 g./sec.
Applying this in the isotonic case it is found that at 20 g.wt. the muscle would lengthen at 0-2 cm./sec., which is shown by the horizontal line in Fig. 14, and is obviously far too slow. The hypothesis is, however, in less violent disagreement with the decay of tension under an inertial load. With masses of o-6, i-o and 2-0 kg., ijMC in each case exceeds 1/4J?2 C2, so that a damped oscillation is predicted of frequency/, where
in
V
\MC4R
2c
(4)10 20 30 40 50 60 70
[image:11.451.93.365.172.500.2]Tension (g.wt.)
Fig. 8. Power against tension in isotonic twitches, same muscle as Fig. 5. Muscle wt.: 00 mg. Resting length: 26 mm.
Frequencies of oscillation with the three masses mentioned would be respectively 6-5, 4-9 and 3-5 c./s. As a crude estimate of the frequency of oscillation, the time from
dFjdt = o to F = o may be regarded as a quarter of a cycle, whence the observed
behaving as a simple viscous resistance during the 'tail' of an isometric twitch, the time constant of tension decay should be proportional to the total compliance, but in fact the increase of time constant caused by adding the spring was much less than would be predicted on this hypothesis.
100
Time (msec)
Fig. 9. Log. tension against time during decline of tension in twitches under isometric and inertial load. The decline ia not exponential under inertial load. From Fig. 5.
To summarize the behaviour under inertial load, it may be said that the twitch comprises two phases. In the first ('active phase') the power output agrees well with that predicted from isotonic observations on the assumption that power is a function of time and tension only. In the second (' tail') the muscle behaves like something similar to, but not identical with, a large viscous resistance; this behaviour begins suddenly, and cannot be reconciled with isotonic observations without additional assumptions.
Isometric twitch
285
o X
i 2
1
- 1
- 2
150
0 50 100
[image:13.451.69.367.37.339.2]Time (msec)
Fig. 10. Two twitches against inertial loads, from Fig. 5. Crosses: power expended in moving external load. Circles: power expended in stretching series compliance. Solid lines: effective mass 2-0 kg. Broken lines: effective mass p-6 kg.
0 SO 100 150 Time (msec.)
[image:13.451.66.372.379.634.2]an inertial load. Fig. 15 shows observed and predicted power for the isometric twitch of Fig. 5 i. It can be seen that although the peak power is about right, the power is too low during the time it is falling to zero (tension still rising while power remains positive). Shortly after becoming negative (i.e. passing the tension peak) the power turns and remains relatively constant for some time, before finally decaying to zero. The onset of the tail is less abrupt than with the inertial load.
A M (load)
C (series compliance)
[image:14.451.178.281.159.336.2]R (muscle)
Fig. 12. Arrangement during the 'tail' of a twitch against inertia, supposing the muscle to behave ae a viscous resistance (dashpot) connected through a compliance to the inertia.
501-250 300 350
Time (msec.)
400 450
[image:14.451.99.354.377.621.2]The discrepancy at the beginning of the twitch, before peak power, also occurs in the twitches under inertial load, and may probably be attributed to the fact that these are first twitches, whereas the isotonic data refer to the last of a series of three twitches. The initial power in the second isometric twitch of Fig. 5j agrees closely with pre-diction, although the tension is thereafter above the range covered by the isotonic data.
3 1 - 1 -— -I \
V_
-\
I I 1 1 I
20 30 SO 60 70 80 90 100 110
Time (msec)
Fig. 14. Isotonic twitch at 20 g.wt. from the same muscle as Fig. 5. Horizontal broken line shows how 'tail' of twitch would look if muscle behaved like a viscous resistance of 10* g./sec.
Confining attention to the discrepancy during the period between peak and zero power, comparison of isometric twitches with those under inertial load shows that if the mass is made small enough to allow shortening to occur, the power Pc expended
in stretching the series compliance does not decrease very much; the power Pt expended
in moving the external load is now sufficient to bring the total power up to the predicted value, although tension is rising nearly as fast as before.
The fact that power drops to zero too soon in an isometric twitch is thus not readily attributed to the feedback system suggested above. Perhaps the simplest way to account for the discrepancy would be to assume that there is a limit to the rate at which tension can be developed, excluding forcible lengthening. This is nothing to do with the limited rate of tension build-up in an isometric contraction, due to the time needed to stretch the series compliance; the assumption is that if the contractile component were attached to a non-compliant structure, so that it could not shorten at all, the rate of increase of tension upon stimulation would still be finite. A 'ceiling' to the rate of increase of tension would impose a corresponding limit on the power which can be developed under isometric conditions, since
= CF(dFjdt)n
The power would thus be limited at (i) low tensions and (2) high rates of increase of tension, but the deficit could be made up by allowing shortening. (1) may be a con-tributory reason why the power is too low at the beginning of a first isometric twitch, when the tension is low (Fig. 15).
fit-Time (msec)
Fig. 15. Crosses: power output in an isometric twitch (Fig. 51)- Circles: power output predicted from isotonic curves of Fig. 8.
SUMMARY
1. A method is described for producing a family of curves of mechanical power output against tension, with time as parameter, in an isometric twitch. It is found that these differ from corresponding curves produced from the same muscle under isotonic conditions.
2. A method is described of simulating a variable mass against which the muscle can contract. The time course during a twitch of the power expended in moving this mass, and of that expended in stretching the series compliance, is determined.
3. In the early ('active') part of the twitch the total power agrees well with that predicted from isotonic measurements, but in the latter part ('tail') the muscle's behaviour abruptly changes: it then resembles, with some differences, a large viscous resistance, in a manner which is compatible with the form of isometric twitches, but has no parallel under isotonic conditions.
4. The power developed in certain phases of the isometric twitch falls short of that predicted from isotonic measurements. It is shown that this can be explained by postulating an upper limit to the rate at which the contractile component can develop tension, and supposing that this limit declines as the twitch proceeds.
It is a great pleasure to thank my supervisor, Prof. J. W. S. Pringle, F.R.S., for his help and encouragement during this work. I am also deeply indebted to Dr K. E. Machin, in particular, for discussion and advice, and to Messrs J. A. Popple and D. M. Unwin for assistance with the design and construction of apparatus. The work was carried out under a D.S.I.R. Research Studentship, and I am most grateful to that organization for their support.
REFERENCES
HILL, A. V. (1938). The heat of shortening and the dynamic constants of muscle. Proc. Roy. Soc. B, 136,
136-95-JEWELL, B. R. & WILKIE, D. R. (i960). The mechanical properties of relaxing muscle. J. Pkytiol. IS*.
3C-47-PENNYCUICK, C. J. (1964a). Frog fast muscle I. Mechanical power output in isotonic twitches. J. Exp. Biol. 41, 81-111.
PENNYCUICK, C. J. (19646). Frog fast muscle II. A method of measuring internal series compliance. J. Exp. Biol. 41, 113-18.