Integration of Analytical Hierarchy Process (AHP)
and Technique for Order Preference by Similarity
to Ideal Solution (TOPSIS) for Supplier Selection
Tanmay Sharma1, Zaeem Khan2, Josy George3, Pushkal Badoniya4 1, 2
Students, Department of Mechanical Engineering, Lakshmi Narain College of Technology Excellence, Bhopal (MP), India
3
Assistant Professor, Department of Mechanical Engineering, Lakshmi Narain College of Technology, Bhopal (MP), India
4
Assistant Professor, Department of Mechanical Engineering, Lakshmi Narain College of Technology Excellence, Bhopal (MP), India
Abstract: Supplier selection, the process of determining the suitable suppliers who are able to provide the buyer with the right quality products and/or services at the right price, at the right time and in the right quantities, is one of the most critical activities for establishing an effective supply chain. In other words, supplier selection is a multi-criteria decision-making problem which includes both qualitative and quantitative factors. In order to choose the best suppliers, it is essential to make a trade-off between these tangible and intangible factors, some of which may conflict. This study aims to build decision support system to help problems solving prioritization improved management of government assets with AHP and TOPSIS methods. Integration of AHP and TOPSIS methods are used to perform weighting and ranking alternatives. Weights are obtained by comparison of the level of interest criteria carried out by experts ranked, while alternative methods produced are based on the calculation method in which the best alternative has the shortest distance from the positive ideal solution and the farthest from the negative ideal solution.
Keywords: Supplier Selection, Multi Criteria Decision Making (MCDM), Technique for Order Preferences by Similarity to the Ideal Solution (TOPSIS), Analytical Hierarchy Process (AHP)
I. INTRODUCTION
For many years, the traditional approach to supplier selection has been to select suppliers solely on the basis of price. However, as companies have learned that the sole emphasis on price as a single criterion for supplier selection is not efficient, they have turned into to a more comprehensive multi-criteria approach. Recently, these criteria have become increasingly complex as environmental, social, political, and customer satisfaction concerns have been added to the traditional factors of quality, delivery, cost, and service. The realization that a well-selected set of suppliers can make a strategic difference to an organization's ability to provide continuous improvement in customer satisfaction drives the search for new and better ways to evaluate and select suppliers. The use of multiple suppliers provides greater flexibility due to the diversification of the firm's total requirements and fosters competitiveness among alternative suppliers. Keeping in view the strategic importance of the supplier’s role in the functioning of supply chains the researchers have developed number of criteria, methods and models for supplier selection. The relevant literature has been thoroughly reviewed and presented below.
In this paper presents a framework that integrates the analytical hierarchy process (AHP) and the technique for order preference by similarity to ideal solution (TOPSIS) to assist designers in identifying customer requirements and design characteristic and help achieve an effective evaluation of the final design solution. The proposed approach starts with applying the AHP method to evaluate the relative overall importance of customer requirements and design characteristics. The TOPSIS method is then used to perform competitive benchmarking. Finally, a search strategy is employed to set target values for design characteristics of the recommended design alternative.
II. LITERATURE REVIEW
decision makers to check the quality of the results in the comparison matrix. Consistency is concerned with the compatibility of a matrix of the ratios constructed from a principal right eigenvector with the matrix of judgments from which it is derived. The consistency ratio is calculated for the maximum eigenvalue and is required to be less than 0.1 for acceptable consistency.
The Technique for Order Preference by Similarity to Ideal Solution (TOPSIS) method is used to solve problems using multi-criteria decision-making process. According to survey and research the recognized variables and effective criteria in supplier selection, with regards to this point that, considering all criteria has been extracted by expert judgment. Thereafter, we will evaluate and determine weight of each supplier and finally, by implementing (TOPSIS) method, the rank of each supplier is determined. TOPSIS has been a favorable technique for solving multi criteria problems. This is mainly for two reasons, 1.) Its concept is reasonable and easy to understand. And 2.) In comparison with other MCDM methods, like AHP, it requires less computational efforts, and therefore can be applied easily. TOPSIS is based on the concept that the optimal alternative should have the shortest distance from the positive ideal solution (PIS) and the farthest distance from the negative ideal solution (NIS).
III. METHODOLOGY ADOPTED
A. Analytic Hierarchy Process (AHP)
Analytic hierarchy process (AHP) was developed in the 1970s by Thomas Saaty is a highly outstanding management tool for complex multi-criteria decision problems. The approach can be used to help decision-makers for prioritizing alternatives and determining the optimal alternative using pair-wise comparison judgments. Weighting the criteria by multiple experts avoids the bias decision making and provides impartiality. In this paper, we have used the following steps of AHP (Saaty, 1980) to help us to measure the relative importance or the weighted values of several criteria.
Fig. 1 AHP Flow Chart
TABLE I
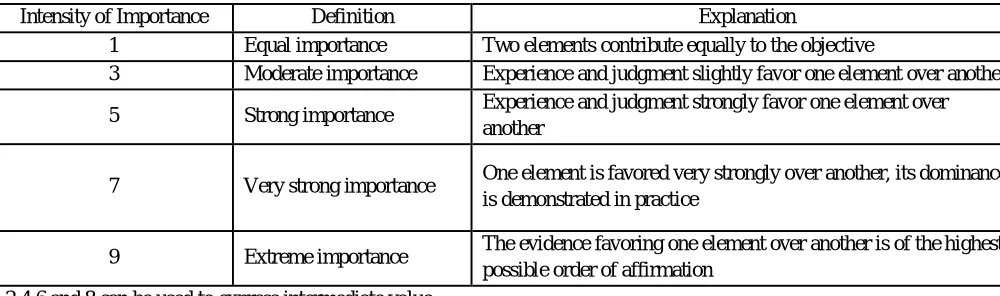
THE FUNDAMENTAL SCALE FOR PAIRWISE COMPARISONS
Intensity of Importance Definition Explanation
1 Equal importance Two elements contribute equally to the objective
3 Moderate importance Experience and judgment slightly favor one element over another
5 Strong importance Experience and judgment strongly favor one element over
another
7 Very strong importance One element is favored very strongly over another, its dominance
is demonstrated in practice
9 Extreme importance The evidence favoring one element over another is of the highest
possible order of affirmation 2,4,6 and 8 can be used to express intermediate value
The steps to follow in using the:
1) Define the problem and determine the objective.
2) Structure the hierarchy from the top through the intermediate levels to the lowest level.
3) Construct a set of pair-wise comparison matrices for each of the lower levels. The numerical value for the element depends on
Saaty Nine Point Scale shown in Table 1. There is n (n-1) / 2 judgments required to develop the set of matrices.
4) Having done all the pair-wise comparisons and entered the data, the consistency is determined using the Eigen value. Steps 3
and 5 are performed to have relative importance of each attribute for all levels and clusters in the hierarchy.
5) To do so, normalize the column of numbers by dividing each entry by the sum of all entries. Then sum each row of the normalized values and take the average. This provides Principal Vector [PV].
6) Find the consistency Index, CI, as follows:
7) CI = (ʎmax – n)/(n-1) Where n is the matrix size
[image:3.612.35.568.501.618.2]Judgment consistency can be checked by taking the consistency ratio (CR) of CI with the appropriate value in Table 2. The CR is acceptable, if it does not exceed 0.10. If it is more, the judgment matrix is inconsistent. To obtain a consistent matrix, judgments should be reviewed and improved.
TABLE II RANDOM INDEX TABLE
N 1 2 3 4 5
RCI 0 0 0.58 0.9 1.12
N 6 7 8 9 10
RCI 1.24 1.32 1.41 1.45 1.51
B. Technique for Order Preference by Similarity to Ideal Solution (TOPSIS)
1) Step 1: The structure of matrix
X1 X2 … Xj
A1 X11 X12 … X1j
A2 X21 X22 … X2j
D = . . . … .
. . . … .
Ai Xi1 Xi2 … Xij
2) Step 2: Calculate the Normalized the matrix D by using the following formula:
=
∑
3) Step 3: Construct the weighted normalized decision matrix by multiplying:
= .
4) Step 4: Determine the positive ideal solution and negative ideal solution
∗= | ∈ , ∈ ′)
= | ∈ , ∈ ′)
5) Step 5: Calculate the separation measure
∗= − ∗
= −
6) Step 6: Calculate the relative closeness to the ideal Solution
∗=
∗+ , 0 ≤ ∗≤ 1
7) Step 7: Calculate the total score and select the alternative closest to 1.
IV. IMPLEMENTATION WITH NUMERICAL EXAMPLE
In this section, to implement the methodology, we have solved simulated numerical example the management of a manufacturing company wants to choose their best suppliers based on proposed methodology.
A manufacturing firm wants to choose their best supplier for their hardware division. The evaluation is between ten suppliers, the evaluation objectives and choose the best of them. The evaluation group determines the value of each criterion which is based on the 10-pointer scale as shown in the table 1.
[image:4.612.81.581.89.167.2]The selection criterions are Product Quality (PQ), Service Quality (SQ), Delivery Time (DT) and Price (Pr). TABLE III
RATING OF FOUR CRITERIONS OF THE SUPPLIER Selection Criteria →
PQ SQ DT Pr Abbreviation
Rating ↓
4 Extremely Low EL
5 Very Low VL
6 Low L
7 High H
8 Very High VH
TABLE IV
CRITERION RELATIONSHIP MATRIX
PQ SQ DT Pr
PQ 1 3 7 5
SQ 1/3 1 5 3
DT 1/7 1/5 1 1/3
Pr 1/5 1/3 3 1
TABLE V
SHOWING SUPPLIERS AND THEIR ATTRIBUTES Criteria →
PQ SQ DT Pr
Alternatives ↓
Supplier 1 EH VL L VL
Supplier 2 VL VL H VL
Supplier 3 EH H H L
Supplier 4 H EH EH EH
Supplier 5 VL H VL EH
Supplier 6 EH L VL H
Supplier 7 H EH EH L
Supplier 8 H EH EH H
Supplier 9 EH VH VL L
Supplier 10 VL VH EH VH
TABLE VI
DECISION MATRIX WITH CRITERION PARAMETRIC VALUES Criteria →
PQ SQ DT Pr
Alternatives ↓
Supplier 1 9 5 6 5
Supplier 2 5 5 7 5
Supplier 3 9 7 7 6
Supplier 4 7 9 9 9
Supplier 5 5 7 5 9
Supplier 6 9 6 5 7
Supplier 7 7 9 9 6
Supplier 8 7 9 9 7
Supplier 9 9 8 5 6
Supplier 10 5 8 9 8
72 73 71 68
23.37 21.7 23.09 21.95
Calculate the Normalized the matrix D by using the following formula:
=
TABLE 7 NORMALIZED MATRIX Criteria →
PQ SQ DT Pr
Alternatives ↓
Supplier 1 0.39 0.23 0.26 0.23
Supplier 2 0.21 0.23 0.30 0.23
Supplier 3 0.39 0.32 0.30 0.27
Supplier 4 0.30 0.41 0.39 0.41
Supplier 5 0.21 0.32 0.22 0.41
Supplier 6 0.39 0.28 0.22 0.32
Supplier 7 0.30 0.41 0.39 0.27
Supplier 8 0.30 0.41 0.39 0.32
Supplier 9 0.39 0.37 0.22 0.27
Supplier 10 0.21 0.37 0.39 0.36
Using AHP for weight calculation of each criterions.
A pair-wise comparison matrix developed as shown in Table V. In constructing the matrix, the question to be asked as each factor comparison is being made is “how much more strongly does this element (or activity) possess – or contribute to, dominate, influence, satisfy, or benefit – the property than does the element with which it is being compared?” (Saaty, 1990).
TABLE VIII
PAIRWISE COMPARISON MATRIX
PQ SQ DT Pr
PQ 1 3 7 5
SQ 1/3 1 5 3
DT 1/7 1/5 1 1/3
[image:6.612.39.579.539.644.2]Pr 1/5 1/3 3 1
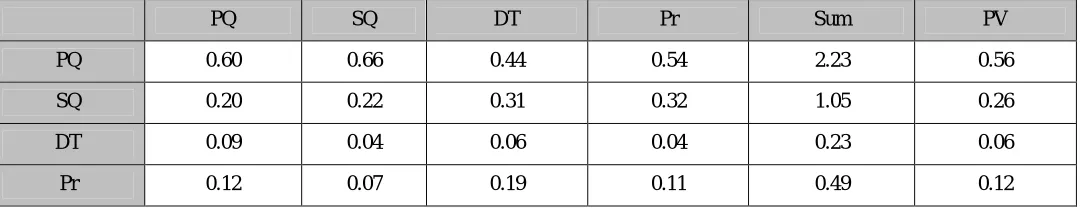
TABLE IX
NORMALIZED MATRIX WITH PRINCIPAL VECTOR OR WEIGHT
PQ SQ DT Pr Sum PV
PQ 0.60 0.66 0.44 0.54 2.23 0.56
SQ 0.20 0.22 0.31 0.32 1.05 0.26
DT 0.09 0.04 0.06 0.04 0.23 0.06
Pr 0.12 0.07 0.19 0.11 0.49 0.12
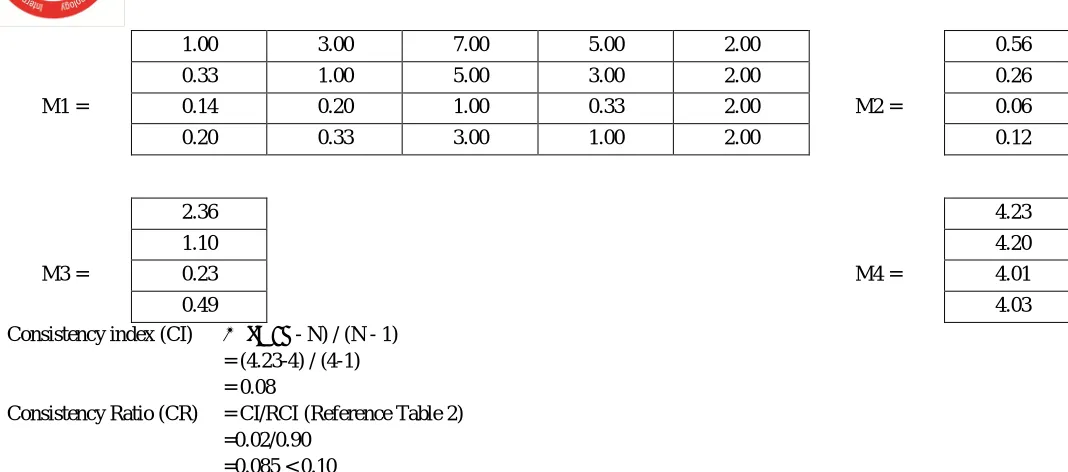
A. Test of consistency
Let the pair-wise comparison matrix be denoted M1 and principal vector be denoted M2.
Then define M3 = M1*M2; and M4 =M3/M2. λmax = average of the elements of M4. Consistency index (CI) = (λmax - N) / (N - 1)
Consistency Ratio (CR) = CI/RCI corresponding to N.
1.00 3.00 7.00 5.00 2.00 0.56
0.33 1.00 5.00 3.00 2.00 0.26
M1 = 0.14 0.20 1.00 0.33 2.00 M2 = 0.06
0.20 0.33 3.00 1.00 2.00 0.12
2.36 4.23
1.10 4.20
M3 = 0.23 M4 = 4.01
0.49 4.03
Consistency index (CI) = (λmax - N) / (N - 1)
= (4.23-4) / (4-1) = 0.08
Consistency Ratio (CR) = CI/RCI (Reference Table 2)
=0.02/0.90 =0.085 < 0.10
The consistency Rate calculated was 0.085 that is less than 0.1, indicating sufficient consistency. The calculated weights are satisfactory.
Construct the weighted normalized decision matrix by multiplying:
[image:7.612.37.571.62.298.2]= .
TABLE X
WEIGHTED NORMALIZED MATRIX
Selection Criteria →
PQ SQ DT Pr
Alternatives ↓
Supplier 1 0.21 0.06 0.01 0.03
Supplier 2 0.12 0.06 0.02 0.03
Supplier 3 0.21 0.08 0.02 0.03
Supplier 4 0.17 0.11 0.02 0.05
Supplier 5 0.12 0.08 0.01 0.05
Supplier 6 0.21 0.07 0.01 0.04
Supplier 7 0.17 0.11 0.02 0.03
Supplier 8 0.17 0.11 0.02 0.04
Supplier 9 0.21 0.10 0.01 0.03
Supplier 10 0.12 0.10 0.02 0.04
Determine the positive ideal solution and negative ideal solution
∗= | ∈ , ∈ ′)
Table XI
Positive and Negative Ideal Solution
PQ SQ DT Pr
S* 0.10 0.14 0.15 0.10
S- 0.15 0.11 0.11 0.15
Calculate the separation measure
∗= − ∗
= −
Calculate the relative closeness to the ideal Solution
∗=
[image:8.612.33.585.340.501.2]∗+ , 0 ≤ ∗≤ 1
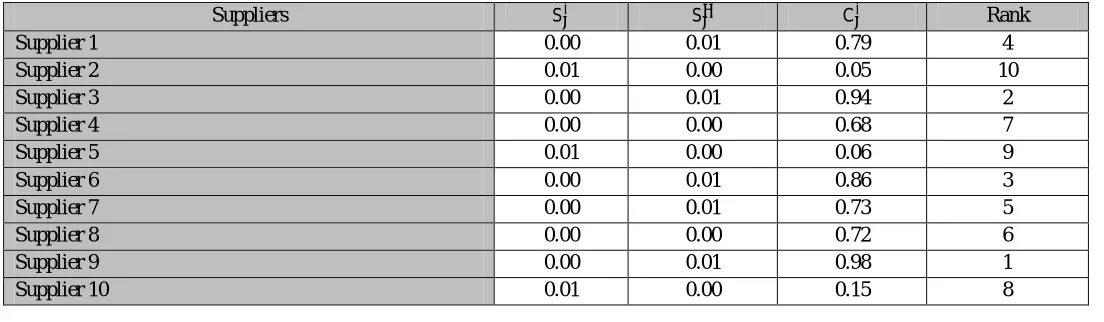
Table XII
Separation measure, relative closeness coefficient and ranking
Suppliers S∗ S C∗ Rank
Supplier 1 0.00 0.01 0.79 4
Supplier 2 0.01 0.00 0.05 10
Supplier 3 0.00 0.01 0.94 2
Supplier 4 0.00 0.00 0.68 7
Supplier 5 0.01 0.00 0.06 9
Supplier 6 0.00 0.01 0.86 3
Supplier 7 0.00 0.01 0.73 5
Supplier 8 0.00 0.00 0.72 6
Supplier 9 0.00 0.01 0.98 1
Supplier 10 0.01 0.00 0.15 8
V. RESULT & DISUCSSION
In this paper the proposed method, which integrates AHP and TOPSIS, for selecting the best supplier. AHP is used to determine the weights of the criteria, while TOPSIS is employed to determine the priorities of the alternatives. The results show that supplier 9 is the best supplier among the 10 other supplier. According to the result calculated the ranking is done for all 10 suppliers. This method is simple to understand and permit the pursuit of best alternative criterion in a simple mathematical calculation.
Due to this, decision making for selection of suitable supplier is of special importance. Acquired results from numerical example determine that the model could be used for decision making optimization is supplier selection.
REFERENCES
[1] Kelemenis, A., Askounis, D., “A new TOPSIS-based multi criteria approach to personnel selection”, Expert Systems with Application, vol.37, pp.4999-5008, 2010.
[2] Jadhav, A., & Sonar, R, Analytic Hierarchy Process (AHP), Weighted Scoring Method (WSM), and Hybrid Knowledge Based System (HKBS) for Software Selection: A Comparative Study. In Emerging Trends in Engineering and Technology (ICETET), pp.991-997, 2009.
[3] Jiang J., Chen Y.W., Tang D.W., Chen Y.W, (2010), "TOPSIS with belief structure for group belief multiple criteria decision making", international journal of Automation and Computing, vol.7, no.3, pp 359-364.
[4] Tahriri, F., Osman, M. R., Ali, A., & Mohd, R., (2008), "A review of supplier selection methods in manufacturing industries", Suranaree Journal of Science and Technology, vol.15, no.3, pp 201-208.
[5] Hwang, C.L. and K. Yoon. Multiple Attribute Decision Making: Methods and Applications. Springer-Verlag, New York, 1981.
[7] Jadidi O, Firouzi F and Bagliery E 2010 TOPSIS Method for Supplier Selection Problem World Academy of Science, Engineering and Technology 47, pp 956-958
[8] Milani A S, Shanian A, Madoliat R and Nemes J A 2005 The effect of normalization norms in multiple attribute decision making models: a case study in gear material selection Industrial Applications 29, pp 312
[9] Rao R V and Davim J P 2008 A decision-making framework model for material selection using a combined multiple attribute decision-making method International Journal of Advanced Manufacturing Technology 35, pp 751-760