A Low Error Rate Prediction based Crop Yielding
using Clustering with LDA
Rabina Dayal1, Arun Kumar Yadav2
1,2
Department of CSE, ITM University, Gwalior, India
Abstract: Prediction of yield crop is vital as it can support leaders in agricultural part. It likewise helps with distinguishing the importance of properties which altogether influence the crop yield. Wheat is one of the generally developed products around the globe. Its precise expectation can take care of different issues identified with wheat cultivating. This work examinations how yield of a specific product is dictated by few properties. In this paper, using Fuzzy C- Means (FCM) and Linear Discriminant Analysis (LDA) model the wheat of yield is predicting by considering year, wheat yield in kg/hectare, rainfall in mm and temperature in Celsius as input parameters. The result of the forecast models will help agricultural offices in furnishing ranchers with profitable data as to which factors add to high wheat yield. The result of implementation model is based on Peak Signal Noise Ratio (PSNR) and Root Mean Square Error (RMSE) and values. Results demonstrate that the LDA show performs superior to anything ANFIS and LDA display with a lower RMSE value.
Keywords: LDA; FCM; PSNR; RSME.
I. INTRODUCTION
In India, agriculture is the foremost necessary part of Indian economy [1].Though number of emerging sectors such as IT and BPOs are contributing significantly to the GDP of India, agriculture is still the most important sector. Agriculture majorly contributes to the exports of India, directly improving foreign currency exchange. In India, majority of the farmers do not get expected yield due to several reasons. The agricultural yield primarily depends on environmental factors such as rainfall, temperature and geographical topology of the particular region. These factors along with some other influence the crop cultivation.
The prediction or evaluation of any natural event is based on logical analysis and information i.e. nature and time of occurrence. The analysis based on manual system creates some inconsistency such as fatigue or difference of personal perceptions etc. Some of the method like neural computing and FCM, and so on can be connected to a wide assortment of genuine applications as they can deal with vulnerabilities superior to conventional techniques [2].
There are numerous conceivable strategies for grouping of information. FCM and LDA are two ordinarily utilized procedures for information arrangement and dimensionality diminishment [3]. LDA effectively handles the situation where the inside class frequencies are unequal and their exhibitions have been inspected on haphazardly produced test information. This technique amplifies the proportion of between-class change to the inside class fluctuation in a specific informational index in this way ensuring maximal detachability. The utilization of LDA for information grouping is connected to arrangement issue in discourse acknowledgment [4]. We chose to actualize a calculation for LDA with expectations of giving better characterization contrasted with Principal Components Analysis (PCA).
This paper aims to analyze such agricultural data using data mining (DM) techniques like FCM and LDA and consolidate the knowledge acquired from the result of DM techniques. The comparison of results from different DM algorithms will be made which will help in finding the most suitable algorithm for agricultural dataflow.
A. FCM
F ( , )=∑ ∑ (u ) d (x , c )(1)
Where k x is kth d-information dimensional vector, i c the focal point of the group i, i k u is the level of participation of k m is the weighting, x in the ith bunch, type, ( , ) k i d x c is the separation between information k x and cluster (bunch) i c , n is the quantity of information designs. The minimization of the target work F(M,N) AFCM is accomplished by an iterative technique
u =
∑
(2)
And
c =∑ ( )
∑ ( ) (3)
Where
∀ iu ∈[0, 1],∀k∑ u = 1 and 0 <∑ u < n.
The clustering is a two-advance technique at every cycle. In the underlying advance, it is the same as that in standard customized FCM to enroll the relationship work in the spirit space. In the second step, the relationship data of each pixel is on to the spatial space. The AFCM emphasis begins with then oval relationship that is joined with the uncommon reason. The cycle is shut when the most extreme uniqueness between two bunch focuses at two successive emphases is a littler sum than a limit. The accompanying is the union; defuzzification is functional to allot each pixel to a correct group for which the participation is maximal.
B. LDA
It includes quantifiable properties of your data, registered for each class. For a single info variable (x) this are the mean and the fluctuation of the variable for each class. For different elements, this is comparative properties discovered over the multivariate Gaussian, particularly the techniques and the covariance structure. These verifiable properties are surveyed from your data and associate with the LDA condition to make desires. These are the model regards that you would extra to appeal to for your model. [6] LDA makes some revising doubts about your data
1) That your data is Gaussian that each factor is shaped like a ringer twist when plotted.
2) That every property has a comparative change that estimations of each factor vacillate around the mean by a comparative entirety all things considered.
With these assumptions, the LDA indicate assesses the mean and change from your data for each class. It is definitely not hard to consider this in the univariate (single data variable) case with two classes. The mean (m) estimation of each info (x) for each class (k) can be assessed in the standard way by detaching the aggregate of characteristics by the total number of characteristics.
m = 1
N sum(x)
Where m the mean estimation of x for the class k is, N is the quantity of cases with class k. The variance is figured over all classes as the ordinary squared contrast of each an impetus from the mean.
σ = 1
N−K sum((x−m) )
Where σ denotes variance for all inputs (x), K represents the set of classes.
II. RELATED WORK
Niketa Gandhi (2016)- This paper gives an account of the utilization of Bayesian Networks to anticipate rice trim yield for Maharashtra (MH) state, India. For this investigation, 27 areas of MH were chosen based on accessible information from openly accessible Indian Government records with different atmosphere and yield parameters chose. [7]
Pornthep Khongchai (2016)- In this work, worked on Decision trees, K-Nearest neighbor (KNN), Support vector machine, Naïve Bayes and Neural system to locate the reasonable strategy to the compensation expectation. In the analysis, 13,541 records of graduated understudy information were utilized with 10-overlay cross approval strategy. Results demonstrated that KNN gave the best proficiency to be utilized as a model for pay forecast. [8]
Umid Kumar Dey (2017)-The critical aspect the governments of such countries want to fulfill is storing enough food for the long term, particularly at a time of natural disaster. In this paper, they attempt to forecast the yield of rice with astute analysis. [9]
independent attributes, the authors used K-Means Algorithm and Multiple Linear Regression to make their prediction. With an accuracy of 98%, they concluded that MLR technique was more precise than K-Means Algorithm, which had a success rate of 96%. [10] NiveditaIsrani (2015)-In this paper, they discussed various algorithms related to classification techniques of DM. These methods are executed on an informational collection that has been gathered throughout the years for the yield forecast of soybean trim. Further, a relative examination is done to indicate which grouping calculation is most appropriate for foreseeing the yield regarding order techniques.[11] Monali Paul (2015)-Yield prediction is very popular among farmers these days, which particularly contributes to the proper selection of crops for sowing. This makes the issue of foreseeing the yielding of products a fascinating test. Prior yield expectation was performed by considering the agriculturist's understanding on a specific field and harvest. This work introduces a framework, which utilizes information mining systems keeping in mind the end goal to foresee the classification of the broke down soil datasets. The classification, along these lines anticipated will show the yielding of products. The issue of anticipating the product yield is formalized as an arrangement lead, where Naive Bayes and KNN techniques are utilized. [12]
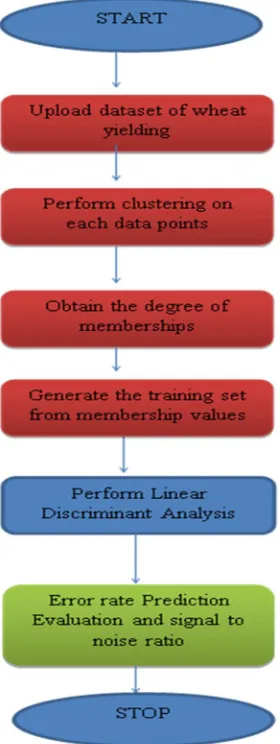
III. PROPOSED WORK
[image:3.612.236.376.342.714.2]After thorough study of the base paper classification error rate is one of the main problems which must be reduced for high performance of the system. These mistakes are because of high calculations or unpredictability of the framework or the preparing of the framework. As the classification error increases the system accuracy decreases and the accurate prediction of the crops yielding decreases. So we require an efficient approach through which the RMSE decreases and classification or prediction recognition increases. In this research, implement fuzzy clustering method for finding best solution. After that connected LDA, it prepares a classifier utilizing fitting capacity which appraises the parameters of a Gaussian distribution for each class. To predict the classes of new information, the prepared classifier finds the class with the littlest misclassification cost.
A. Proposed Algorithm 1) Step 1: START
Read input samples, = { 1, 2, 3, 4, … … … . . }
Where T = Training sequence
2) Step 2: Perform FCM clustering and generate D = {d1, d2, d3, d4 ….dN} with N=5
Where D represents the degree of memberships and N indicates the number of clusters
3) Step 3: Obtain the cluster centers with membership values and update membership values based on cluster assignments
4) Step 4: Set the training vector based on high degree of membership values. As the membership is high that is more achievable for less error rate probabilities
5) Step 5: Set the Testing sequences
= { , , . , … … … … }
Where T = Test vectors
6) Step 6: Predict the Less error rate using multivariate probability distribution and evaluate the less RMSE rate
7) Step 7: Repeat Step 2-6 until the completion of number of iterations
8) Step 8: STOP
IV. RESULT ANALYSIS
This segment clarifies the investigations did on wheat informational index utilizing FCM, and LDA models. It additionally looks at the outcomes got from them. The FCM and LDA models were executed utilizing Matlab R2014b.This area portrays the wellspring of information from which wheat informational collection was acquired to play out our tests. It additionally portrays the information parameters considered for wheat yield forecast. Argentina is a country with a variety of seasons. Hence, taking measure of the weather conditions becomes an imperative point if one is to predict the yield of the wheat. Therefore, the following attributes are taken into account in this study: Rainfall, Temperature, Area (in hectares) and Yield (in M.Tons/hectare). The system that has been mapped out for this study takes the environment of Argentinainto consideration. After all, the surroundings in which the wheat grows plays a paramount role in its development. In this examination, answered to the Annual Wheat Yield for a considerable length of time 1890-1919 for Argentine, Rainfall (June-November) and Temperature (August-November, in deviations from the mean). In the yield of corn, it has been demonstrated that the vital factor is the precipitation, and the following the temperature. The present investigation is an endeavor to decide the impact of these components on the yield of wheat. The exploratory outcome is performed on PSNR and RMSE values. We used standard connecting with measures of respectability of-fit to evaluate the precision of wheat yield desires [13].
1) RMSE of Prediction: It defined the error measure between observed and predicted values.
= −
Where m is number of years j, yand x are observed and predicted values.
2) PSNR of Prediction: PSNR defined the improved prediction value and is the most wanted feature. The higher the value, the processing efficiencyis better of the approach. It can be calculated in decibels (dB) and it is given by
( ) =10 log (255. ) / 10
( )
The fig2 shows the main panel in which GUI set up tool is used. It consist of user interface controls and using those UI controls the above mentioned GUI is obtained using pushbuttons and panels.
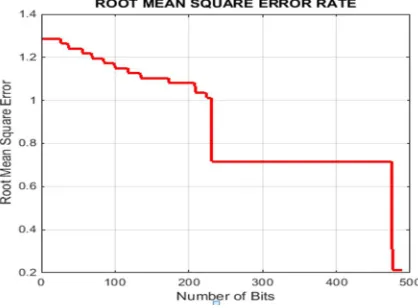
Fig. 3.Shows RMSE Comparison between Base and Proposed method
[image:5.612.200.409.350.504.2]The fig3 shows the FCM in which degree of membership is assessed as for the information in the dataset for the yielding of wheat. This is an effective technique which enables a bit of information to have a place with at least one cluster. The information point that is near the middle will have a place with high level of participation. It is a probability distribution approach which works iteratively to provide each data point a right location.
Fig. 4.Shows RMSE of the Base System
The above figure 4 shows the learning RMSE in which the yielding of wheat error is evaluated which must be low to have high rate of correctly prediction of yielding. So the system is having less error rates using Adaptive Neuro fuzzy inference system (ANFIS) which is our base approach. The ANFIS deals with the training set as the input in terms of degree of memberships. ANFIS builds a FIS which works on membership function constraints which are tuned using back propagation procedure to perform less error rates.
Table.1.PSNR result of proposed system for offline or online database
Method PSNR on
Online Data
PSNR on Offline Data
[image:5.612.229.384.675.731.2]Proposed 92.41 92.41
Table.2. Precision is calculated using DCD Feature rmse comparison between base [2] and proposed system
Method Online
RMSE
Offline RMSE
Base 0.1499 0.1853
Fig. 5.Shows RMSE Comparison between Base [2] and Proposed method
[image:6.612.194.417.331.498.2]The above figure is having less error rate prediction using training and testing process which shows that our proposed approach is better than the base approach and shows that the system is more robust in predicting wheat yielding error rates and having high signal to noise ratio. The PSNR must be high for less root mean square error rates.
Fig. 6.Shows Proposed GUI Panel
The figure 6 shows the above panel which shows the Error rate and PSNR using LDA.
[image:6.612.164.432.546.721.2]The above figure 7 shows the learning RMSE in which the yielding of wheat error is evaluated which must be low to have high rate of correctly prediction of yielding. So the system is having less error rates using LDA which is proposed approach. The LDA works with the training set as the input in relations of degree of memberships. LDA works on the fitting function which evaluations the constraints of a Gaussian distribution for separately class.
V. CONCLUSION
This investigation focused on alter yield forecast utilizing two prediction methods namely FCM, and LDA models. In this work, we used online dataset for wheat dataset. The implementation outcomes of the algorithm were associated in perspective of the RMSE up to low 0.0866 and 0.1499 for Proposed and ANFIS method respectively. In perspective of this we reason that LDA could envision the yield of wheat more correctly then the ANFIS appear. We see this was a direct result of the way that the LDA exhibit could internment the nonlinear affiliation concerning the data factors more satisfactorily than the other two models. The higher clear consistency of yields than precipitation is contrary to the dispute that consistency of reap response to precipitation must be not as much as that of occasional rainfall aggregates, in view of gathering of the error in predicting adjacent customary precipitation from environment markers and the goof in foreseeing yields from regular precipitation.
In future we mean to grow this work for different sorts of harvests by thinking about various parameters. The future work that one can do as an augmentation of this model is to utilize different forecasts.
VI. ACKNOWLEDGEMENT
It is not possible to prepare a research paper without the assistance and encouragement of the people. This one is certainly no exception. On the very outset of this paper, I would like to extend my sincere and heartfelt obligation towards all the personages who have helped me in this Endeavour. Without their actual guidance, help cooperation and encouragement, I would not have made headway in the way research. I am extremely thankful and pay my gratitude to my faculty Dr. Arun Kumar Yadav for her valuable guidance and support on completion of this project in its presently. I extend my gratitude to ITM UNIVERSITY for giving me this opportunity. I also acknowledge with a deep sense of reverence, my gratitude towards my parents and member of my family, who has always supported me morally as well as economically. I would also like to thank the anonymous reviewers who provided helpful feedback on my manuscript .At last but not least gratitude goes to all my friends who directly or indirectly helped me to complete this project report. Any omission in this brief acknowledgment does not mean lack of gratitude.
REFERENCES [1] https://sol.du.ac.in/mod/book/view.php?id=1735&chapterid=1693
[2] Aditya Shastry , Sanjay H A and Madhura Hegde, “A Parameter based ANFIS Model for crop yield prediction”, IACC 2015 IEEE,pp 253-257. [3] N. A. He~Sli,” Relations Between The Weather And The Yield Of Wheat In The Argentine Republic”, June 1922, pp. 302-308.
[4] S. Balakrishnama, A. Ganapathiraju, “Linear Discriminant Analysis - A Brief Tutorial”, Institute for Signal and Information Processing. [5] Gagarine Yaikhom,” Implementing the Fuzzy c-Means Algorithm”,pp 1-13.
[6] https://machinelearningmastery.com/linear-discriminant-analysis-for-machine-learning/
[7] Niketa Gandhi, Leisa J. Armstrong, Owaiz Petkar,” PredictingRice Crop Yield Using Bayesian Networks”, ICACCI,pp 795-798.
[8] Pornthep Khongchai, Pokpong Songmuang,” Implement of Salary Prediction System to ImproveStudent Motivation using Data Mining Technique”, 2016 IEEE KICS, pp 1-6.
[9] Umid Kumar Dey, Abdullah Hasan Masud, Mohammed Nazim Uddin,” Rice Yield Prediction Model Using Data Mining”, ECCE, 2017 IEEE, pp 321-326. [10] D. Ramesh and B. V. Vardhan, “Data Mining Techniques and Applications to Agricultural Yield Data”, International Journal of Advanced Research in
Computer andCommunication Engineering Vol. 2, Issue 9, September 2013.
[11] Anshal Savla, Parul Dhawan, Himtanaya Bhadada, Nivedita Israni, Alisha Mandholia, Sanya Bhardwaj,” Survey of classification algorithms for formulatingyield prediction accuracy in precision agriculture”, (ICIIECS)2015,pp 1-7
[12] Monali Paul, Santosh K. Vishwakarma, Ashok Verma,” Analysis of Soil Behaviour and Prediction of Crop Yield using Data MiningApproach”, 2015 IEEE, pp 766-771.
[13] James W. Hansena,, Andries Potgieterb, Michael K. Tippett,” Using a general circulation model to forecast regional wheat yields in northeast Australia”,
![Fig. 5. Shows RMSE Comparison between Base [2] and Proposed method](https://thumb-us.123doks.com/thumbv2/123dok_us/1252398.652217/6.612.164.432.546.721/fig-shows-rmse-comparison-base-proposed-method.webp)
