Minimal Supervision
Alla Rozovskaya
∗ Queens College,City University of New York
Dan Roth
∗∗University of Illinois at Urbana-Champaign
Mark Sammons
∗∗ University of Illinois at Urbana-ChampaignThis article considers the problem of correcting errors made by English as a Second Language writers from a machine learning perspective, and addresses an important issue of developing an appropriate training paradigm for the task, one that accounts for error patterns of non-native writers using minimal supervision. Existing training approaches present a trade-off between large amounts of cheap data offered by the native-trained models and additional knowledge of learner error patterns provided by the more expensive method of training on annotated learner data.
We propose a novel training approach that draws on the strengths offered by the two standard training paradigms—of training either on native or on annotated learner data—and that outperforms both of these standard methods. Using the key observation that parameters relating to error regularities exhibited by non-native writers are relatively simple, we develop models that can incorporate knowledge about error regularities based on a small annotated sample but that are otherwise trained on native English data.
The key contribution of this article is the introduction and analysis of two methods for adapting the learned models to error patterns of non-native writers; one method that applies to generative classifiers and a second that applies to discriminative classifiers. Both methods demonstrated state-of-the-art performance in several text correction competitions. In particular,
∗Department of Computer Science, Queens College, CUNY, Queens, NY 11367 USA. E-mail:
[email protected]. Part of this work was done when the author was at Virginia Tech and the University of Illinois.
∗∗Department of Computer Science, University of Illinois at Urbana-Champaign, Urbana, IL 61801 USA. E-mail:{danr, mssammon}@illinois.edu.
Submission received: 14 May 2016; revised version received: 14 February 2017; accepted for publication: 2 June 2017.
the Illinois system that implements these methods ranked at the top in two recent CoNLL shared tasks on error correction.1 We conduct further evaluation of the proposed approaches studying
the effect of using error data from speakers of the same native language, languages that are closely related linguistically, and unrelated languages.2
1. Introduction
This article addresses the problem of correcting grammatical context–sensitive mistakes made by English as a Second Language (ESL) writers, a subject that has recently attracted significant attention (Izumi et al. 2003; Han, Chodorow, and Leacock 2006; De Felice and Pulman 2008; Gamon et al. 2008; Tetreault, Foster, and Chodorow 2010; Gamon 2010; Rozovskaya and Roth 2010a,b, 2011; Dahlmeier and Ng 2011, 2012). ESL error correction is an important problem because the majority of people who write in English today are not native English speakers (Gamon 2011). Representative ESL errors—a verb agreement mistake, an unnecessary article, and an incorrect choice of a preposition— are illustrated in Figure 1.3Thesource word(the word chosen by the ESL
writer) and the label(the correct choice, as specified by a native English speaker) are emphasized.
A standard approach to dealing with these errors, which also proved highly suc-cessful in text correction competitions (Dale and Kilgarriff 2011; Dale, Anisimoff, and Narroway 2012; Ng et al. 2013, 2014), makes use of amachine-learning classifier paradigm
and is based on the methodology for correctingcontext-sensitive spelling mistakesmade by native speakers. With the exception that learners and native writers exhibit errors of different types, most of the grammar and usage mistakes made by non-native speakers of English also fall into the category of context-sensitive errors that result in valid English words (e.g., articles or prepositions) being confused.
Traditionally, following the work on context-sensitive spelling, classifiers have been trained on native English data for a particular mistake type (e.g., preposition). Note that because native data do not have information about learner errors, the model can only use contextual cues. Thus, when the resulting classifier is applied to non-native text, the most appropriate preposition is selected based exclusively on the surrounding context, similar to a cloze task where one needs to “guess” a word that has been replaced by blank in a sentence. An error is flagged if this most likely candidate is different from the author’s choice (Eeg-Olofsson and Knuttson 2003; Izumi et al. 2003; Han, Chodorow, and Leacock 2006; De Felice and Pulman 2008; Gamon et al. 2008; Tetreault and Chodorow 2008; Tetreault, Foster, and Chodorow 2010). We call this general ap-proach to error correction theselectiontraining paradigm.
In realistic ESL situations, however, the scenario is different and there is addi-tional information that could be used by a correction system beyond that used in the selection paradigm. The ESL learner writes a text, and typically makes mistakes on
1 The Illinois system ranked first in all metrics in the CoNLL-2013 competition and scored second and first on original and revised annotation metrics, respectively, in the 2014 competition.
2 This article unifies and significantly extends material that appeared previously in Rozovskaya and Roth (2010b, 2011), Rozovskaya, Sammons and Roth 2012, and Rozovskaya and Roth (2014).
The ruling class of the Soviet Union is represented in Orwell’s book by pigs, who *gives/givethemselves *the/∅education and privileges, use the power and the force
of terror provided by Napoleon’s dogs to control the other animals in ways that are different from those *by/ofthe previous ruling group.
Figure 1
Examples of representative ESL errors.
fewer than 10% of words.4This baseline accuracy is higher than the performance of the
state-of-the-art classifiers on word selection tasks (Han, Chodorow, and Leacock 2006; Tetreault and Chodorow 2008). This high baseline also suggests that by just selecting the author’s word choice we can already do better than using the context alone. In addition to this baseline bias, the author’s word choice may also be informative because non-native speakers do not make mistakes randomly. For example, it is well known that the native language of the learner makes a distinctive impact on their usage of English (Odlin 1989; Gass and Selinker 1992; Montrul and Slabakova 2002; Ionin, Zubizarreta, and Bautista 2008). Therefore, we would like to use the author’s word when making a decision about the appropriate correction.
One way the system can consider the word used by the writer at evaluation time is by proposing a correction only when the confidence of the classifier is high enough. However, in this partial solution, the source word is not used in training if the classifier is trained on native data. Alternatively, one can train on corrected non-native text. In that case, error patterns provide the model with additional information that is not available when training on native data. Indeed, in certain scenarios models trained on annotated learner data perform better than those trained on larger amounts of native data (Gamon 2010; Han et al. 2010; Dahlmeier and Ng 2011).
Training on native vs. annotated learner data raises the question of the trade-off between using large amounts of cheap native data and the availability of additional information provided by the expensive supervision in the form of annotated ESL data. We propose an approach that draws on the advantages of the two training sources by combining them in one model. The approach provides models trained on native data with knowledge about error regularities,with minimal annotation costs: A small amount of annotated learner data is used to extract knowledge about error patterns that are then “injected” into models trained on large amounts of native data. We call this approach of combining a large quantity of native training data with a small amount of annotated ESL dataadaptation with minimal supervisionand denote models trained in this way asadaptedto learner errors.
The key contribution of this work is an analysis of novel methods of training for error correction tasks that use minimal supervision and draw on the strengths of the two standard approaches—training on native or annotated learner data—and the advantages provided by each training source. Within this method, we describe how
error patterns are learned, and introduce two approaches for “injecting” knowledge about error regularities into a model otherwise trained on native English data. These two approaches are designed to work with two state-of-the-art machine learning algo-rithms. The first approach, implemented within the discriminative learning framework, is based on generating artificial errors in training, where artificial mistakes are intended to mimic those observed in non-native data. The second approach adapts to error regularities by updating the prior distribution over the correction candidates. We show that the resulting adapted models are superior to the standard methods of training either on annotated or native data alone. This is because, in contrast to training on an-notated ESL data, the adaptation approach only requires a small amount of annotation to estimate the parameters related to error regularities, while context parameters can be learned from native data. In sum, the proposed methods allow us to combine the advantages of training on native and annotated learner data. The proposed adaptation framework was implemented as part of the Illinois system that came first in several text correction competitions, including the prestigious CoNLL shared tasks (Rozovskaya et al. 2014, 2013). We further evaluate the proposed approaches and study the effect of adaptation when using error data from speakers of the same native language, languages that are closely related linguistically, and unrelated languages. This article unifies and significantly extends material that appeared previously in Rozovskaya and Roth (2010b, 2011, 2014), and Rozovskaya, Sammons and Roth (2012). The novel contribution is concentrated in Section 5, and evaluates the adaptation approach by comparing perfor-mance when error statistics are drawn from the writer’s native (target) language data vs. from data generated by writers of other first-language backgrounds. We also study the effect of language relatedness on the quality of adaptation, namely, whether using data from writers whose first language is linguistically related to the author’s native language is better than using data from writers whose native language is linguistically unrelated. An additional contribution is introduced in Section 6. There we explain the significance of the classification approach by reviewing and reassessing the current approaches to grammatical error correction, both from the point of view of develop-ing systems that can focus on specific error phenomena, and from the perspective of the amount of supervision (annotated learner data) that is available and is needed for training.
This article is organized as follows. Section 2 provides the relevant background and explains the training paradigms. Section 3 presents the framework for adaptation with minimal supervision. In Section 4, we present key experimental results on three types of common ESL mistakes. Language-specific adaptation and analyses are presented in Section 5. Section 6 reviews related work. We conclude with a discussion of the adaptation approaches, the advantages of each of these algorithms, and situations in which one may be preferred over the other in Section 7.
2. Training Paradigms
We start with an overview of the machine learning framework for error correction, then present the standard wordselectionapproach and show why this paradigm is not appropriate, as is, for error correction tasks. Next, we describe the correction training paradigm.
errors that result in legitimate words, such as confusingpeaceandpieceoryourandyou’re
(Roth 1998). Correcting these errors requires consideration of the context around the tar-get word. Because the relevant contextual information may depend on various linguistic dimensions and is highly variable, the dominant approach to correcting these errors has been to use machine learning algorithms (Golding and Roth 1996, 1999; Banko and Brill 2001; Carlson, Rosen, and Roth 2001; Carlson and Fette 2007).
In the machine learning approach, we are given a candidate set or a confusion set
of confusable words, for example, {piece, peace}. In training, each occurrence of a confusable word is represented as a vector of features derived from acontext window
around it. A classifier is trained on text assumed to be error-free, where each target word occurrence (e.g.,peace) is treated as a positive training example for the corresponding word. Given a text to correct, for each confusable word, the task is to select the most likely candidate from the relevant confusion set.
The machine learning classifier approach has been and remains one of the prevalent methods in ESL error correction, as is evidenced by the competitions devoted to grammatical error correction: HOO-2011 (Dale and Kilgarriff 2011), HOO-2012 (Dale, Anisimoff, and Narroway 2012), CoNLL-2013 (Ng et al. 2013), and CoNLL-2014 shared tasks (Ng et al. 2014). Thanks to these competitions, the field has also seen a number of alternative approaches. For example, the CoNLL shared tasks made available a large annotated learner data set, that enabled the machine translation approach (Felice et al. 2014; Junczys-Dowmunt and Grundkiewicz 2014) that showed competitive performance in CoNLL-2014. In this work, our focus is on the classifier-based approach with an emphasis on techniques that allow for building robust models by leveraging large amounts of native English datawithout the use of expensive annotation.
The Selection Training ParadigmIn the application of theselectiontraining approach to ESL error correction, a model is tailored toward one mistake type (e.g., errors involving preposition usage) and is trained on well-formed native English text with features defined based on the surrounding context. Task-specific confusion sets are formed. For instance, in preposition error correction, it is common to include the topn most frequent English prepositions. The features are generally based on the surface form, part-of-speech information, and syntactic function of words in the immediate context around the potentially erroneous word. The classifier is then applied to non-native text to select the most appropriate candidate from the confusion set in context.
A number of earlier works in ESL error correction followed the selection training paradigm, with slight differences in the choice of features and machine-learning algorithm. The latter included maximum entropy models, perceptrons, language models, and decision trees (Eeg-Olofsson and Knuttson 2003; Izumi et al. 2003; Han, Chodorow, and Leacock 2006; Chodorow, Tetreault, and Han 2007; De Felice and Pulman 2007, 2008; Gamon et al. 2008; Tetreault and Chodorow 2008; Yi, Gao, and Dolan 2008; Bergsma, Lin, and Goebel 2009; Tetreault, Foster, and Chodorow 2010).
The Source Word The key reason that the selection approach has been popular in error correction is that it does not require annotated data. Native data (presumed to be correct) is used for training the system; it is cheap and is available in large quantities. It is clear, though, that there is a problem with this standard approach of training on native data, as its decision is based solely on the context and ignores the author’s word choice.
performance is high, and for many error types, fewer than 10% or even 5% of word usages are actually mistakes (Han et al. 2010; Rozovskaya and Roth 2010b; Dale and Kilgarriff 2011; Yannakoudakis, Briscoe, and Medlock 2011).5 This high learner performance is better than the performance of the state-of-the-art classifiers on word selection tasks not only on learner texts but also on well-formed data (e.g., Han, Chodorow, and Leacock 2006). Furthermore, learner errors follow specific error patterns, as discussed in more detail in the next section. These error patterns may be prominent across multiple first languages or be first-language dependent. The effect of “language transfer”—applying knowledge from the native language, when learning a foreign language—has been the subject of considerable study in the second-language acquisition literature (Odlin 1989; Gass and Selinker 1992; Montrul 2000; Montrul and Slabakova 2002; Oh and Zubizaretta 2003; Ionin, Zubizarreta, and Bautista 2008). These facts have also been confirmed empirically by studies that quantitatively examine learner corpora (Han, Chodorow, and Leacock 2006; Lee and Seneff 2008). For example, speakers of languages that do not have a determiner system (e.g., Russian) tend to make 4–5 times more article mistakes in English than speakers whose first language has articles (Rozovskaya and Roth 2010b). In addition to the error regularities due to first language influence, some confusions are much more likely to occur than others across multiple first languages. For example, regardless of the first language, ESL writers are 38 times more likely to incorrectly use “in” rather than “by” in place of the correct word “on” (Table 2, Section 3.1).
Training for Correction Tasks Depending on whether the author’s word choice is used by the model, we distinguish between two training paradigms. In theselection
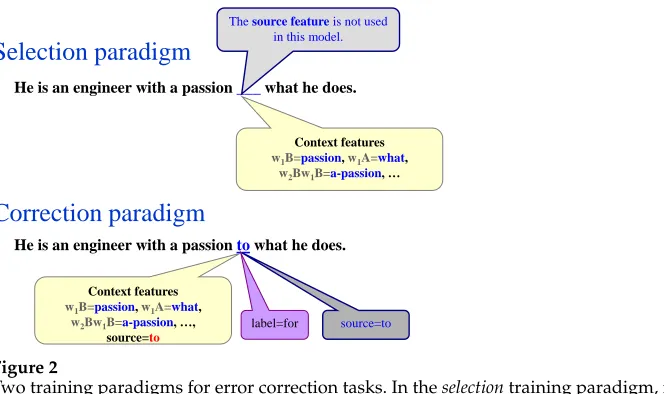
paradigm, the decision of the classifier depends only on the context around the author’s word, whereas in the correction training paradigm, both the context and the source word are used. The two training paradigms and the information available to the models in training and at prediction time in each case are illustrated in Figure 2. A straightforward way to use the source word is to train on annotated learner data. In that case, the source word can also be used as a feature. The problem is that this approach requires large amounts of annotated ESL data (Gamon 2010).
Training on native versus annotated learner data raises the question of the trade-off between the useful information provided in the form of expensive supervision and the robustness obtained from training on large amounts of native data. In this article, we address the question of what is the most appropriate way to train for correction tasks given the limitations and advantages of each data source. We propose an approach to building models that incorporates the best of both modes: training on native texts to facilitate the possibility of training from large amounts of data without the need for annotation, but using the correction mode with a modest amount of annotated ESL data so that the model can adapt to writers’ errors. As a result, at evaluation time, these models can make use of the potentially erroneous information provided by the writer. We show that adaptation is beneficial on various levels: when error patterns are specific for a given first language and for groups of linguistically-related languages, as well as when error patterns are collected across multiple first language backgrounds that are available and that may include various related or unrelated languages.
Selection paradigm
He is an engineer with a passion ___ what he does.
Correction paradigm
He is an engineer with a passion to what he does. Context features
w1B=passion, w1A=what, w2Bw1B=a-passion, …
Context features
w1B=passion, w1A=what, w2Bw1B=a-passion, …,
source=to
The source feature is not used in this model.
[image:7.486.58.390.61.258.2]label=for source=to
Figure 2
Two training paradigms for error correction tasks. In theselectiontraining paradigm, models use only contextual information in training and when making a prediction. In thecorrection
paradigm, the author’s word is also used by the model.
3. Adaptation to Learner Errors with Minimal Supervision
In the previous section, we argued that the key advantage of the selection paradigm is that it is cheap, as we can use large amounts of native data. However, because learners’ errors are systematic, we would like to provide the models with knowledge about typical mistakes learners make. As discussed earlier and as we show in the rest of the article, using the source word in prediction is better than just using the context. We therefore want to train on ESL data but we have a very limited amount of it. We thus need to develop ways that can use ESL data in prediction even when very little of it is available, which we do by exploiting large amounts of native data together with a small amount of ESL data. We call this approachadaptationto learner errors. The rest of this section describes the adaptation algorithms that we develop for this purpose.
After we describe how error patterns are learned, two adaptation methods are presented. The proposed methods are designed to work with two state-of-the-art ma-chine learning algorithms: The artificial errors adaptation method is applicable for a discriminative learning algorithm (implemented here within Averaged Perceptron – henceforth AP), and thepriors adaptation method for the Naive Bayes (NB) algorithm. These two algorithms demonstrated superior performance in a study that compared several learning frameworks for ESL error correction tasks (Rozovskaya and Roth 2011). This study also included language models and other count-based methods.
3.1 Learning Error Patterns
Error patterns are extracted from annotated learner data; these error patterns are referred to aserror statistics. As we show here, unlike the context parameters, the error statistics are very simple, and thus we only need a small annotated sample to estimate them.
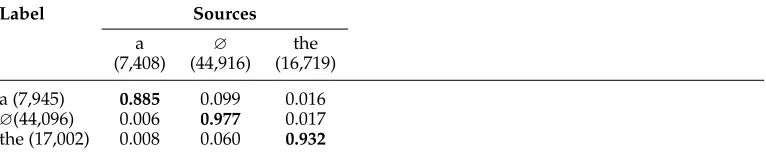
Table 1
Confusion matrix for article errors used in the artificial errors method. Based on the training data from the FCE corpus. The left column shows the correct article. Each row shows the author’s article choices for that label andProb(source|label). The numbers next to the targets show the count of the label (or source) in the data set.
Label Sources
a ∅ the
(7,408) (44,916) (16,719)
a (7,945) 0.885 0.099 0.016
∅(44,096) 0.006 0.977 0.017
the (17,002) 0.008 0.060 0.932
confusion matrices, one where each cell representsProb(source=s|label=l) (used in the artificial errors method, Section 3.2), and the other, inverse matrix, where each cell shows Prob(label=l|source=s), which is used by the priors adaptation method for NB (Section 3.3).
Tables 1, 2, and 3 show confusion matrices of the first type for article, preposition, and verb agreement mistakes, respectively. These matrices are based on the training part of the FCE data set, a corpus of annotated ESL essays (see Section 4.1). Consider, for example, the preposition matrix: We show eight rows and columns, but the entire table contains 12 rows and columns, one for each of the top 12 English prepositions;6
each entry showsProb(pi|pj), the probability that the author chose prepositionpigiven
that the correct preposition ispj. These probabilities are used in theartificial errors method.
The matrix also shows the preposition count for each source and label in the data set. Given the matrix and the counts, it is possible to generate the matrix forProb(pj|pi), the
probability that the correct preposition is pj given that the author’s preposition ispi.
This second matrix is used for adapting NB with thepriorsmethod.
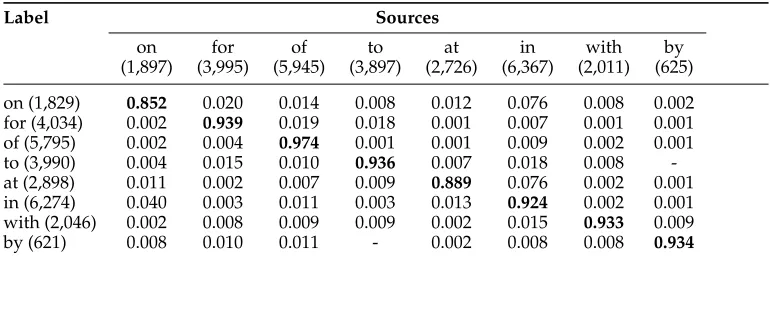
The confusion matrices show that the distribution of alternatives for each source word is very different from that of the others. For instance, using the row corresponding to the prepositionforin Table 2, it can be observed that instead of the prepositionfor, non-native writers are 18 times more likely to use the preposition tothan to use the prepositionby. This strongly suggests that errors are systematic. The matrices also give a sense of the error baseline. Specifically, as the numbers show, most words are used correctly, and the error rates are very low (the error rates can be estimated by looking at the matrix diagonals in the tables). Although the error rates vary, they are typically below 10% or 5%, and in some cases less than 1%. For example, the error rate for the prepositionof is lower than foron, since 97.4% of the occurrences of the label of are correct, but only 85.2% of the labelonare correct.
3.2 Adaptation for a Discriminative Model
The artificial errors method is an adaptation technique for discriminative classifiers that we implement with the AP algorithm: Learner errors are simulated in training through artificial mistakes at a rate that reflects the errors made by ESL writers, which
Table 2
Confusion matrix for preposition errors used in the artificial errors method. Based on the training data from the FCE corpus. The left column shows the correct preposition. Each row shows the author’s preposition choices for that label andProb(source|label). The numbers next to the targets show the count of the label (or source) in the data set. The table is based on the confusion matrix for 12 prepositions but only rows corresponding to eight most frequent prepositions are shown to make the table readable.
Label Sources
on for of to at in with by
(1,897) (3,995) (5,945) (3,897) (2,726) (6,367) (2,011) (625)
on (1,829) 0.852 0.020 0.014 0.008 0.012 0.076 0.008 0.002
for (4,034) 0.002 0.939 0.019 0.018 0.001 0.007 0.001 0.001
of (5,795) 0.002 0.004 0.974 0.001 0.001 0.009 0.002 0.001
to (3,990) 0.004 0.015 0.010 0.936 0.007 0.018 0.008
-at (2,898) 0.011 0.002 0.007 0.009 0.889 0.076 0.002 0.001
in (6,274) 0.040 0.003 0.011 0.003 0.013 0.924 0.002 0.001
with (2,046) 0.002 0.008 0.009 0.009 0.002 0.015 0.933 0.009
[image:9.486.52.437.148.306.2] [image:9.486.54.439.387.475.2]by (621) 0.008 0.010 0.011 - 0.002 0.008 0.008 0.934
Table 3
Confusion matrix for verb agreement errors used in the artificial errors method. Based on the training data from the FCE corpus.SandINFstand for third person singular and bare verb form, respectively. The left column shows the correct verb. Each row shows the author’s verb choices for that label andProb(source|label). The numbers next to the targets show the count of the label (or source) in the data set.
Label Sources
S INF WAS WERE
(627) (2,205) (601) (149)
S (640) 0.961 0.039 -
-INF (2,192) 0.005 0.995 -
-WAS (593) - - 0.997 0.003
WERE (157) - - 0.064 0.936
is ensured by generating artificial mistakes using the confusion matrix. The idea of using artificial errors goes back to Izumi et al. (2003) and Foster and Andersen (2009). The approach discussed here refers to the adaptation method originally proposed in Rozovskaya and Roth (2010b) and its modified version in Rozovskaya, Sammons, and Roth (2012). In Rozovskaya and Roth (2010b), artificial errors are generated using the distribution of naturally-occurring errors. This version of the approach suffers from the low recall problem, as discussed subsequently. Rozovskaya, Sammons, and Roth (2012) describe a more general method of using artificial errors for adaptation and also solve the low recall problem. This is the method we describe here.
artificial errors in the training data. For example, from Table 2, labelon corresponds to source on in 85.2% of the cases and corresponds to sourcein in 7.6% of the cases. In other words, in 7.6% of the cases when the prepositiononshould have been used, the writer instead usedin. Thus, for each example in the training data (which are from native text and therefore assumed to be correct), with probability 7.6% we flip onin the training data toin. Note that the label of these examples is not changed, only the surface form is replaced. The native training examples now approximate the behavior of ESL data: The prepositions will now be incorrect with the same frequency and distribution as those from the corresponding target ESL user. Note that we refer to the replacement assource, as we refer to ESL writer word choice: Both for training (native data) and test (ESL data),source denotes the surface form that the classifier sees as a feature (which could be an error), andlabeldenotes the correct word. For ESL data, the
sourcecorresponds to the word chosen by the author, whereas for native data, thesource
corresponds to the artificially produced (and possibly erroneous) surface form.
Error Sparsity and Low Recall The artificial errors approach just described generates errors with the frequency of naturally occurring mistakes, thereby creating a low-recall model that tends to abstain rather than flag a possible error. This happens because of error sparsity, or the low error rates in the learner data. The values of thesourcefeature thus tend to have a very skewed label distribution, that is, most of the time the source feature value corresponds to the label. The system will learn that in the majority of cases the source word corresponds to the label, and will tend to over-predict it, which will result in very few mistakes being flagged.
The Error Inflation Method The two training modes—(1) training without the source word, or the knowledge about learner errors; and (2) training with the source feature, where the classifier relies on it too much—represent two extreme choices for training for correction tasks.
In the error inflation method, in order to preserve the ability of the model to take into account learner error patterns, while also increasing the model’s recall, we reduce the confidence that the system has in the source word, while preserving the knowledge the model has about likely confusions (typical errors). This is achieved by decreasing the proportion of correct examples and distributing the extra probability mass among con-fusion pairs in an appropriate proportion by generating additional error examples. This inflates the error rate in the training data, while keeping the probability distribution among likely corrections the same. Increasing the error rate improves the recall.
Algorithm 1 shows the pseudo-code for generating artificial errors in training data; it takes as input training examples the confusion matrixCM(as shown in Tables 1, 2, and 3) and the inflation constantC, and generates artificial source features for correct train-ing examples. An inflation constant value of 1.0 corresponds to theoriginaladaptation method that simulates learner mistakes without inflation. For each training example, a probability distribution of the artificial sources is generated inside the secondfor-loop, using the confusion matrixCMand the inflation constantC. A list of tuplesProbRangesis created that contains for each source the probability range represented by two numbers,
Algorithm 1Data Generation with Inflation
Input: Training examples E with correct sources, confusion matrix CM, inflation constantC
Output: Training examples E with artificial errors forExampleeinEdo
Initializelab←e.label,e.source←e.label ProbRanges←[]
Initializestart←0 fortargettintargetsdo
ift equals labthen Prob(t)=CM[lab][t]·C else
Prob(t)= 11.0.−0−CMCM[lab[lab][][lablab]·]C ·CM[lab][t] end if
ProbRanges.append((start,start+Prob(t),t))
start=start+Prob(t) end for
x←Random[0, 1]
fortupletinProbRangesdo start=tuple[0]
end=tuple[1]
target=tuple[2]
ifx>startandx<endthen e.source←target
[image:11.486.51.436.490.531.2]Break end if end for end for returnE
Table 4
Artificial errors. Percentage of preposition examples converted into artificial mistakes in training, using the inflation method with different inflation rates.
Inflation rate
1.0 (Original) 0.9 0.8 0.7 0.6 0.5
7.20% 16.48% 25.76% 35.04% 44.32% 53.60%
3.3 Adaptation for the Naive Bayes Algorithm
information on the real distribution of mistakes and the dependence of the correction on the word used by the author.
g(S,p)=log{prior(p)· Y
f∈F(S,p)
P(f|p)}
=log(prior(p))+ X
f∈F(S,p)
log(P(f|p)) (1)
In the NB adaptation method, candidate priors are changed using an error con-fusion matrix based on learner data that specifies how likely each concon-fusion pair is. Importantly,adaptedcandidate priors are dependent on the author’s word choice. Lets
be a preposition appearing in text, andp, a correction candidate. Then theadaptedprior ofpgivensis:
prior(p,s)= C(s,p) C(s)
where C(s) denotes the number of times s appeared in the learner data, and C(s,p) denotes the number of timespwas the correct preposition whenswas used.
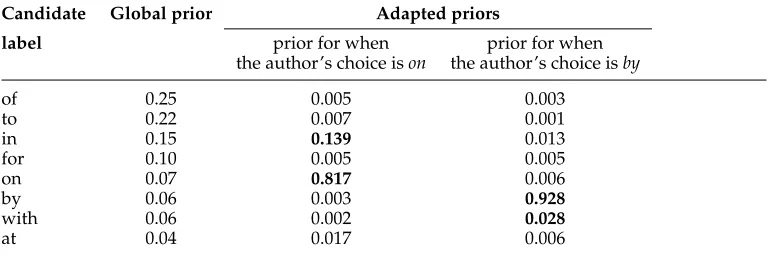
Using the information from Table 2, we can compute adapted priors, that is,
Prob(label|source), for preposition mistakes.7 Table 5 shows adapted priors for two
au-thor’s choices—onandby. First, note how the distribution of adapted priors differs from that of the global priors: According to the global priors, the most likely candidate for both of the author’s prepositions isof; it is four times more likely thanwith. However, theadaptedprior ofwithwhen the author’s choice isbyis almost ten times higher than the adapted prior ofof (0.028 vs. 0.003), reflecting the fact that learners are more likely to incorrectly use with when by is intended than to useof. The second distinction of the adapted priors is the high probability assigned to the author’s choice: The adapted prior forongiven that it is also the author’s choice is 0.817, vs. the 0.07 prior based on the native data. This reflects the fact that the majority of prepositions are used correctly. Finally, higher probabilities are also assigned to those candidates that are most often observed as corrections for the author’s preposition (in bold in the table). For example, the adapted prior for in when the writer chose on is 0.139, because on is frequently incorrectly chosen instead of in. Similarly, the most likely confusion for the source
byiswith.
To determine a mechanism to inject the adapted priors into a model, note that the NB architecture directly specifies the prior probability as one of its parameters. We thus train NB in a traditional way, on native data, and then replace the prior component in Equation (1) with the adapted prior to get the score forpof theNB-adaptedmodel:
g(S,p)=log{prior(p,s)· Y
f∈F(S,p)
P(f|p)}
It should be stressed that in the NB adaptation method there is no need to re-train the model to adapt to a different set of learner error patterns, as is the case with the
Table 5
Examples ofadapted candidate priors used to adapt NB (Prob(candidate label|source (author’s choice))) for two of the author’s choices—onandby.Global priordenotes the probability of the candidate in the standard model and is based on the relative frequency of the candidate in native training data.Adapted priorsare dependent on the author’s preposition. Adapted priors for the author’s choice are very high. Other candidates are given higher priors if they often appear as corrections for the author’s choice (shown inbold). Based on preposition errors in the FCE training data.
Candidate Global prior Adapted priors
label prior for when prior for when
the author’s choice ison the author’s choice isby
of 0.25 0.005 0.003
to 0.22 0.007 0.001
in 0.15 0.139 0.013
for 0.10 0.005 0.005
on 0.07 0.817 0.006
by 0.06 0.003 0.928
with 0.06 0.002 0.028
at 0.04 0.017 0.006
artificial errors approach. Only one model is trained, and only at decision time do we change the prior probabilities of the model. Furthermore, even though NB does not typically perform as well as a discriminative classifier when both models are trained on the same data and features (Rozovskaya and Roth 2011, 2014), the algorithm also has advantages in several training scenarios (see Section 7).
4. Key Adaptation Experiments
We now present experiments demonstrating that the adaptation approaches with min-imal supervision proposed in this work outperform the standard methods of training on native data and when training on annotated learner data alone. In the following sections, we describe the data sets, and present key adaptation experiments on three error types. Section 5 presents language-specific adaptation.
4.1 Data Sets
We use native English data and an annotated corpus of learner essays. The native English data is used for training, and the ESL data is used both for training and evaluation.
Table 6
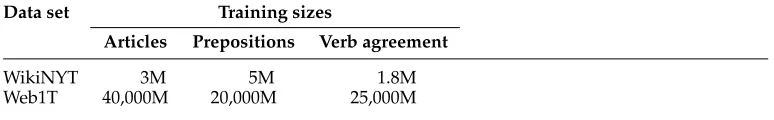
Statistics on the native training data sets used in the key experiments. For the WikiNYT corpus, training sizes indicate the number of relevant training examples (articles/prepositions/verbs) in millions. (The entire WikiNYT corpus contains more examples; the table shows the sizes used in the key experiments.) Training sizes for the Web1T corpus are approximate and are based on the corpus size (1012words).
Data set Training sizes
Articles Prepositions Verb agreement
WikiNYT 3M 5M 1.8M
Web1T 40,000M 20,000M 25,000M
The second corpus is Google Web1T 5-gram (Brants and Franz 2006) (henceforth Web1T), which is a collection ofn-gram counts of lengths one to five over a corpus of 1012 words. Table 6 shows the sizes of the two native data sets. Because Web1T does not come with complete sentences, we approximate the number of training examples for each error type for Web1T based on the sizes of Web1T and WikiNYT and the frequencies of the respective target words in WikiNYT. To compare with the WikiNYT, Web1T contains on the order of 10,000 more training examples for each error type.
Using the two corpora allows us to evaluate the proposed adaptation methods when applying two state-of-the-art machine learning algorithms and to demonstrate how to take advantage of the benefits provided by each data source and each machine learning framework. On WikiNYT, we train discriminatively using the AP algorithm and rich syntactic features shown to be useful for article and verb agreement errors (Lee and Seneff 2008; Rozovskaya and Roth 2014) and for preposition errors (Tetreault, Foster, and Chodorow 2010). Because of the special format of the Web1T corpus, it is difficult to generate rich feature annotations for this data, and to make use of a discriminative classifier on this corpus, as one would have to limit the surrounding context to two words on each side of the mistake. Because we wish to make use of the context features that extend beyond the two-word window, it is only possible to use count-based methods (e.g., NB or language models). We thus train the NB algorithm.
Learner Data Several annotated learner data sets were made available recently, including the data set used in the HOO competition, the CoNLL data set (Dahlmeier, Ng, and Wu 2013), and the FCE data set (Yannakoudakis, Briscoe, and Medlock 2011), a subset of the Cambridge Learner corpus. Because we want to explore the effects of first language backgrounds, we use the FCE corpus in this work. This corpus contains data from learners of multiple language backgrounds, including information on the first language of the writer. The work described in Section 5 makes use of this information. We discuss other corpora and approaches in Section 6.
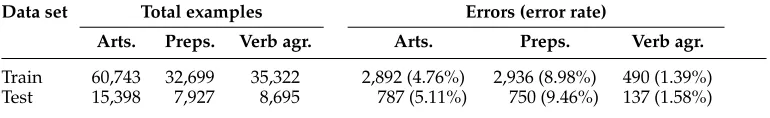
Table 7
Statistics on articles, prepositions, and verbs in the ESL data set.Error ratedenotes the percentage of examples (articles, prepositions, or verbs in the data) that are mistakes.
Data set Total examples Errors (error rate)
Arts. Preps. Verb agr. Arts. Preps. Verb agr.
Train 60,743 32,699 35,322 2,892 (4.76%) 2,936 (8.98%) 490 (1.39%)
Test 15,398 7,927 8,695 787 (5.11%) 750 (9.46%) 137 (1.58%)
10% but vary by error type (from slightly more than 1% for verb agreement, to 5% for articles, to almost 9% for prepositions).
In the key experiments, we generate combined statistics across writers of all 16 first language backgrounds. For first-language and other fine-grained adaptations, see Section 5.
4.2 Experimental Set-up
Depending on what training data source is used, we refer to the models as follows:
1. Native-trained models: trained on native English data in the selection paradigm
2. ESL-trained models: trained on annotated learner data in the correction training paradigm
3. Adapted models: trained on native English data and adapted using annotated learner data
Features AP models trained on WikiNYT use rich features tailored to each error type. These features were used in the components of the Illinois system in several shared tasks (Rozovskaya et al. 2011, 2013) and are presented in Appendix Tables A.1, A.2, A.3, and A.4 for convenience. The Web1T models are trained on wordn-gram features.
Parameter TuningTen percent of the training data is used to optimize the inflation rate for the AP-adapted models (0.8 for articles and prepositions, and 0.85 for verb agreement).
4.3 Note on Evaluation Metrics
Three papers have been published recently that addressed the appropriateness of commonly used metrics for error correction; two of these also proposed new metrics that are different from the standard F1 adopted in the shared tasks but are variations of accuracy or F-measure. Felice and Briscoe (2015) proposed an I-measure that is accuracy-based and Napoles et al. (2015) proposed a variation of the BLEU metric used in Machine Translation (called GLEU). Further, Napoles et al. (2015) and Grundkiewicz, Junczys-Dowmunt, and Gillian (2015) also compare the outputs of the systems in the CoNLL shared task against human judgments and show that the need for new metrics is motivated by a lack of correlation between F1 and human judgments. However, the newly proposed GLEU metric does not fare much better in terms of correlation with human judgments than the F-measure and the I-measure.
Developing a new, more appropriate metric is an involved issue that is beyond the scope of this work. We are not dealing with phrase-based edits here, so we follow the evaluation metrics based on precision, recall, and F1 that were used in the shared tasks on grammar correction.
4.4 Key Adaptation Results
The key question addressed in this section is the following:
r
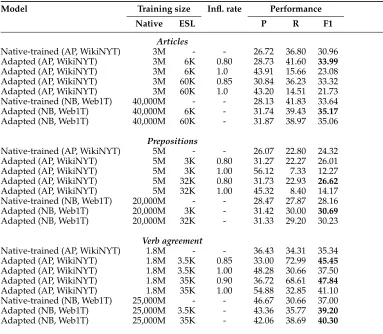
Does adding a little bit of learner data to large amounts of native training data result in better models compared with training on native data alone?We compare native-trained models and adapted models implemented within the two algorithms—AP and NB, trained on two native corpora—and evaluate on three types of mistakes. Adapted models use a small amount of learner data (about 6K, 3K, and 3.5K article, preposition, and verb agreement examples, respectively) extracted from an an-notated FCE sample of 40K words, which constitutes 10% of the FCE training data. Ad-ditionally, we show performance for models adapted using all of the FCE training data. Table 8 presents the results. First, we compare native-trained models and adapted models that use 10% of learner training data. For AP adapted models, we show two variants in each case: one with inflation rate 1.0 (this is the baseline adapted model that uses the error rates that correspond to naturally occurring mistakes) and one that uses an inflation rate that was optimized on the development sample. Adaptation consis-tently improves the performance for both algorithms and all three types of mistakes: The improvements range between 1.5 F1 points for articles to 2 F1 points for agreement and preposition mistakes. It should be stressed that we are using a small annotated sample. In the following description, we also show that training an entire model on this learner sample results in poor performance as context parameters cannot be estimated robustly.
Interestingly, when we adapt using all of the FCE training data (also shown in the table), we only observe improvements for verb agreement errors and a small boost for preposition error correction with AP models. Clearly, article error patterns can be reliably estimated using just a small ESL sample. This is because these errors are not as sparse as verb agreement errors (see Table 7) and have a smaller confusion set than preposition errors. In contrast, verb agreement errors are more sparse, thus adding more data for adaptation is beneficial.
Table 8
Key adaptation experiments. Models are trained onWikiNYTdata orWeb1T. Two types of adapted models are shown: those that use 100 files (10%) of theFCEtraining data and those that use all of the learner training data for error statistics. Inflation rate is optimized on the
development set. All differences are statistically significant (McNemar’s test, p<0.0001).
Model Training size Infl. rate Performance
Native ESL P R F1
Articles
Native-trained (AP, WikiNYT) 3M - - 26.72 36.80 30.96
Adapted (AP, WikiNYT) 3M 6K 0.80 28.73 41.60 33.99
Adapted (AP, WikiNYT) 3M 6K 1.0 43.91 15.66 23.08
Adapted (AP, WikiNYT) 3M 60K 0.85 30.84 36.23 33.32
Adapted (AP, WikiNYT) 3M 60K 1.0 43.20 14.51 21.73
Native-trained (NB, Web1T) 40,000M - - 28.13 41.83 33.64
Adapted (NB, Web1T) 40,000M 6K - 31.74 39.43 35.17
Adapted (NB, Web1T) 40,000M 60K - 31.87 38.97 35.06
Prepositions
Native-trained (AP, WikiNYT) 5M - - 26.07 22.80 24.32
Adapted (AP, WikiNYT) 5M 3K 0.80 31.27 22.27 26.01
Adapted (AP, WikiNYT) 5M 3K 1.00 56.12 7.33 12.27
Adapted (AP, WikiNYT) 5M 32K 0.80 31.73 22.93 26.62
Adapted (AP, WikiNYT) 5M 32K 1.00 45.32 8.40 14.17
Native-trained (NB, Web1T) 20,000M - - 28.47 27.87 28.16
Adapted (NB, Web1T) 20,000M 3K - 31.42 30.00 30.69
Adapted (NB, Web1T) 20,000M 32K - 31.33 29.20 30.23
Verb agreement
Native-trained (AP, WikiNYT) 1.8M - - 36.43 34.31 35.34
Adapted (AP, WikiNYT) 1.8M 3.5K 0.85 33.00 72.99 45.45
Adapted (AP, WikiNYT) 1.8M 3.5K 1.00 48.28 30.66 37.50
Adapted (AP, WikiNYT) 1.8M 35K 0.90 36.72 68.61 47.84
Adapted (AP, WikiNYT) 1.8M 35K 1.00 54.88 32.85 41.10
Native-trained (NB, Web1T) 25,000M - - 46.67 30.66 37.00
Adapted (NB, Web1T) 25,000M 3.5K - 43.36 35.77 39.20
Adapted (NB, Web1T) 25,000M 35K - 42.06 38.69 40.30
(Rozovskaya and Roth 2011, 2014), when both are trained under the same conditions. This is because NB and AP results are not directly comparable here, since even though NB is trained using a less rich set of features (wordn-grams only), it uses much more data.
4.5 A Graphical View of ESL Adaptation
We now summarize the adaptation idea graphically using the preposition error correc-tion task and the AP learning framework as an example. As shown in Figure 3, we can view adaptation by considering a graph with anx-axis representing the amount of ESL data and they-axis representing the amount of native data used in training. Each box corresponds to a model, and the numbers in boxes show F1 results. The boxes on the
x-axis indicate models that are trained exclusively on ESL data, and the boxes on the
26.43
14.62 26.73 22.01
24.32
23.92 26.01 29.48
26.62
23.30 29.73
0 N A T I V E
D A T A
log(3K) log(32K) log(13M)
log(1M)
Native-trained models (selection)
ESL-trained models (correction)
1
2
3
ESL DATA log(5M)
[image:18.486.50.283.65.396.2]Adapted models (correction)
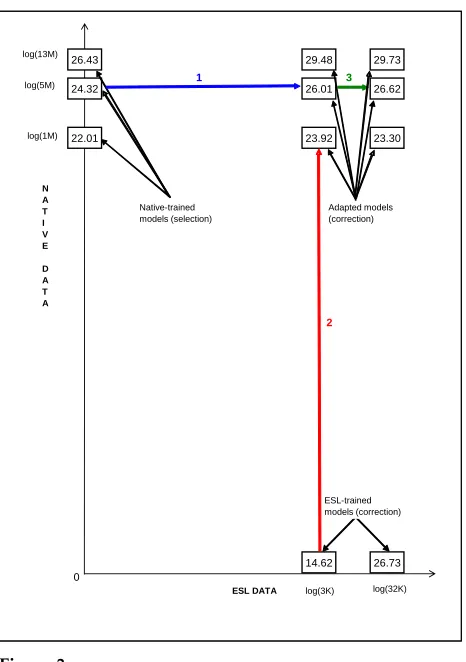
Figure 3
Adaptation: a two-dimensional summary, usingthe preposition error correction task and the AP learning frameworkas an example. Increasing the amount of training data is important, but one type of data is much more costly than the other. Adaptation methods are shown to gain from a small increase in the costly dimension. Thex-axis shows the ESL data continuum as a percentage of the annotated training examples. They-axis shows the native training data. Note how the native data size is in fact several orders of magnitude larger than the ESL data. The numbers in boxes show F1 results.
are trained on much native data and adapted using different amounts of ESL data. The
x-axis is expensive, and they-axis is cheap. The data sizes are shown for each axis inlog
scale, because the sizes of the native data are several orders of magnitude larger than the sizes of the ESL training data: The entire ESL data set contains 32,000 preposition examples, and the 3,000 also shown on the graph corresponds to 10% of the data (the amount used for adapting the models in Table 8). The native data size varies from 1 million to 13 million prepositions. To have a fair comparison, in all cases, we train AP classifiers using the same set of rich features. The same results are also presented in tabular form (Table 9).
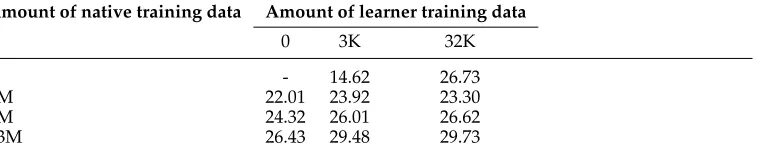
Table 9
Adaptation using the preposition error correction task as an example. Models are trained on different sizes of native (WikiNYT) and learner data suing the AP algorithm. Each cell shows the F1 score. The same results are presented in Figure 3.
Amount of native training data Amount of learner training data
0 3K 32K
0 - 14.62 26.73
1M 22.01 23.92 23.30
5M 24.32 26.01 26.62
13M 26.43 29.48 29.73
uses 1 million examples obtains an F1 score of 22.01, and we can improve further, to 24.32 and 26.43, if we use 5 million and 13 million training examples, respectively. We continue to improve as we add more data (28.16) when training on Web1T using the NB algorithm (Table 8). This demonstrates the importance of using native data for learning parameters relating to context features.
The results in the graph can be summarized as follows. The main lesson is that the two types of training data are complementary, althoughincreasing the amount of training data is important, but one type of data is a lot more costly than the other. The adaptation methods are shown to gain very much from a small increase in the costly dimension: The key result (marked as line “1” on the graph) is that a model trained on 5 million native prepositions andadapted with 3,000 ESL prepositions outperforms a native-trained model that uses the same number of training examples from native data (26.01 versus 24.32 F1 points). Similarly, there is a 3-point improvement due to adaptation when the models use 13 million prepositions from the native data. These results demonstrate that even a little bit of ESL data can make a big difference.
The comparison marked as line “2” demonstrates the importance of using native data: an ESL-trained model that uses 3,000 prepositions performs very poorly, because there is not enough evidence to learn all parameters reliably. We can improve consider-ably to 23.92 and 29.48 by adding 1 million and 13 million native examples, respectively. The result marked as line “3” shows that the model adapted with just 3,000 prepo-sitions is very close to the performance of the model adapted with 10 times more data. This shows that by using a small amount of annotated ESL data, it is possible to estimate the mistake parameters reliably.
Finally, we continue to improve as more native data are used (we improve by 2 F1 points (from 24.32 to 26.43) for native-trained models when using 13 million preposi-tions instead of 5 million). Importantly, adding learner data always helps, regardless of how much native data is used, becauselearner data contributes knowledge on the types of mistakes that are not available in the native data: Adding a little bit of learner data for adapted models, we improve by more than 3 F1 points (from 26.01 to 29.48) compared with native-trained models that use the same amount of native data.
4.6 Prepositions: Top Three Evaluation
Table 10
Prepositions: Top three evaluation. Models are trained onWikiNYTdata orWeb1T. Adaptation uses 100 files (10%) of theFCEtraining data.
Model Training size Infl. rate Performance
Native ESL P R F1
Top 1
Native-trained (AP, WikiNYT) 5M - - 26.07 22.80 24.32
Adapted (AP, WikiNYT) 5M 3K 0.8 31.27 22.27 26.01
Native-trained (NB, Web1T) 20,000M - - 28.47 27.87 28.16
Adapted (NB, Web1T) 20,000M 3K - 31.42 30.00 30.69
Top 3
Native-trained (AP, WikiNYT) 5M - - 31.84 41.60 36.07
Adapted (AP, WikiNYT) 5M 3K 0.5 72.70 38.00 49.91
Native-trained (NB, Web1T) 20,000M - - 44.13 43.07 43.59
Adapted (NB, Web1T) 20,000M 3K - 59.87 38.00 46.49
fewer than 10% of instances are erroneous (one would expect that a higher baseline [i.e., a lower error rate] would imply a more difficult learning task). However, although the preposition baseline is lower than for the other mistakes, the performance is also the lowest, which seems counterintuitive. We attribute this to the large confusion set (12 prepositions), and to the fact that, typically, preposition usage is highly ambiguous (multiple prepositions can be licensed in a given context [Tetreault and Chodorow 2008]), whereas the FCE annotation does not allow for multiple acceptable answers. De Felice (2008) investigated preposition performance when going beyond the top match and found that performance would improve when looking at the topncandidate corrections.
Given that preposition usage is highly variable, we conduct further evaluation using the top three choices provided by the classifiers (Table 10). In the top three evaluation, a classifier’s prediction is counted as “correct” if the gold label is among any of the top three candidates selected by the classifier. F1 performance increases for all the models when top three choices are considered. However, adapted models fare much better: Precision increases substantially from 31.27 to72.70for AP-adapted and from 31.42 to 59.87 for NB-adapted models, whereas it only improves slightly from 26.07 to 31.84, and from 28.47 to 44.13 for their respective native-trained counterparts. These improvements suggest that it is not just the first candidate that is better but the overall ranking is better in adapted models. The top three evaluation thus provides ad-ditional evidence thatknowledge of error patterns available in the adapted models is extremely important.
Whether presenting the top three candidates to the user is reasonable depends on the evaluation of how good the top three candidates are. Thus, we also wish to assess top three candidates directly because the top three F1 measure values presented are computed for a gold standard that allows only a single correct answer, when in fact there may be multiple possible correct answers. More specifically, given that preposition usage is variable, we would like to know how often the top three candidates include
Table 11
Prepositions: Top three evaluation. Column 1 shows the number of correct predictions among the top three candidates (between 0 and 3). Each cell shows the percentage of cases with this number of correct predictions among the top three.
Number of correct predictions Percentage of preposition examples
among the top 3 candidates (AP-adapted, %) (NB-adapted, %)
0 6.3 14.3
1 79.4 71.4
2 14.3 12.5
3 0 1.8
200 preposition instances where the classifier’s top choice was different from the gold label. These were manually annotated by one of the authors, a native English speaker, who was given a preposition in a context (where by “context” we consider the entire sentence where the preposition appears) and was asked to specifyhow manyof the top three choices are acceptable in a given context. Results of the evaluation are shown in Table 11. Column 1 shows the number of correct predictions among the top three candidates (between 0 and 3). Each cell shows the percentage of cases with this number of correct predictions among the top three. We found that for the majority of the cases, at least one of the top three candidates is valid; row 1 shows that only 6.3% and 14.3% of the examples for AP- and NB-adapted models, respectively, did not have a single correct candidate among the top three choices. More importantly, 14.3% of examples for each of the classifiers have two or three valid preposition choices among the top three candidates (last two rows in the table). We believe that these numbers confirm earlier findings with respect to the highly variable preposition usage and thus justify presenting multiple options to the user, at least for preposition mistakes. Finally, it is interesting to note that AP-adapted has a higher percentage of correct prepositions in the top three evaluation than NB-adapted, even though NB-adapted does better in the top 1 evaluation. We believe that this indicates that AP-adaptation is better than NB-adaptation at ranking the appropriate candidates. This result is also consistent with those in Table 10 that show that the precision (and F-score) of AP-adapted models in the top three evaluation improves from 31.27 to 72.70, whereas for NB-adapted models the improvement is more modest (from 31.42 to 59.87). Lastly, as the results show, whereas precision numbers increase markedly, the recall does not. This happens because the top three evaluation is performed on models that were optimized with respect to top one evaluation. It is also possible to optimize models based on top three evaluation, in which case both precision and recall would increase, resulting (most likely) in improved F1 scores. However, the evaluation and additional annotation that we perform already demonstrate how multiple preposition usage underestimates top one evaluation.
5. Adaptation by Language
In the previous experiments, models were adapted based on error patterns of learners from a variety of first-language backgrounds. In this section, we investigate the question of using error patterns from the writers of thesame first language vs. other
Table 12
Number of examples and errors for the 11 languages used in the experiments on language-specific adaptation.
First Error type
language Articles Prepositions Verb agreement
Total Errors Correct Total Errors Correct Total Errors Correct
(%) (%) (%)
Chinese 5,054 273 94.60 2,337 224 90.42 2,615 54 97.93
French 9,296 328 96.47 4,419 390 91.17 4,807 92 98.09
Greek 4,962 212 95.73 2,296 244 89.37 2,584 34 98.68
Italian 4,848 178 96.33 2,377 181 92.39 2,358 17 99.28
Japanese 5,073 331 93.48 2,387 177 92.58 2,464 43 98.25
Korean 6,006 374 93.77 2,708 215 92.06 2,932 29 99.01
Polish 5,335 397 92.56 2,507 174 93.06 2,802 45 98.39
Russian 5,703 440 92.28 2,793 229 91.80 2,769 22 99.21
Spanish 12,317 339 97.25 5,866 588 89.98 6,444 80 98.76
Thai 4,371 277 93.66 2,107 170 91.93 2,316 58 97.50
Turkish 5,275 355 93.27 2,459 213 91.34 2,802 24 99.14
Total 68,240 3,504 94.97 32,256 2,805 91.30 34,893 498 98.57
two groups of closely related languages: Russian and Polish (Slavic), and Spanish and Italian (Romance).8As discussed in Section 2, research in second-language acquisition as well as empirical studies in natural language processing indicate that the effect of the native language on learner error patterns is strong. In fact, because writers of related languages use similar structures transferred from their native language to English, it is even possible to recover language family structures by analyzing writing patterns of non-native speakers (Nagata and Whittaker 2013; Berzak and Katz 2015).
Here, we study to what extent having language-specific patterns affects the quality of adaptation. We use three phenomena—articles, prepositions, and verb agreement— as these occur in the FCE data from 11 first languages (shown in Table 12), excluding languages that only have a handful of examples, and study these phenomena within the NB adaptation framework, training on the native data from the Web1T corpus and adapting using learner data from different first-language groups. Specifically, we denote bytarget,other,related, andunrelated, error patterns obtained from the learners of the same first-language background, all other first languages (excluding the target), languages related to the target, and those unrelated to the target, respectively. The group
otherincludes both related and unrelated languages to the target.
Because experiments in this section are performed individually by first-language group, we do not separate the data into training and testing partitions. Instead, results are reported in 10-fold cross-validation, where each time we evaluate on 10% of target-language data, and 90% of the target data is used to estimate prior parameters of the target-based adaptation model. Similarly, in all other settings—related, unrelated, and other—we select the same amount of data to estimate priors from other, related, or unrelated languages.
Table 13
Adapting NB with data from the target language background and other language backgrounds. Numbers in the parentheses show the relative improvement of using adapted models vs. the native-trained models. All improvements of adapted models vs. native-trained models are statistically significant (McNemar’s test, p<0.001).
Error Native-trained Adapted (other) Adapted (target)
P R F1 P R F1 P R F1
(rel. improv.) (rel. improv.)
Article 28.06 41.49 33.47 31.17 40.65 35.28 (5.4%) 32.21 41.33 36.20(8.2%) Prep. 18.41 24.97 21.19 23.25 23.82 23.63 (11.5%) 23.80 24.95 24.25(14.4%) Verb agr. 28.52 46.51 35.32 32.73 43.78 37.44 (6.0%) 33.58 45.96 38.80(9.9%)
The following key questions are addressed.
1. Target priors vs. other priors.Suppose we have annotated data from a set of writers of various linguistic backgrounds, and we need to adapt to writers from a different linguistic background that is not part of our corpus. Is there a benefit in collecting error patterns on this new set of learners for adaptation? In other words, can we do better using error patterns from writers of the target language than when adapting using data from other speakers?
2. Target priors vs. related language priors vs. unrelated language priors. Here, we investigate in more detail the effect of language relatedness on the quality of adaptation. For a given target language, among all languages that are different from the target, we distinguish between those that are linguistically related to the target and unrelated languages. We study whether there is a difference between adapting using target priors, priors based on languages that are closely related linguistically to the target, and priors from languages unrelated to the target.
5.1 Target Priors vs. Other Priors
Table 14
Target-language adaptation. Adapting NB with data from thetargetlanguage background and
otherlanguage backgrounds. Results are presented by first-language background where languages are ordered by the amount of target error data available.Boldis used to indicate results where target-language adaptation is better than other-language adaptation.
Language F1
(number of errors) Native- Adapted Adapted Adapted
trained (other langs.) (target lang.) (other+target)
Articles
Russian (440) 37.72 39.59 40.14 39.47
Polish (397) 40.93 43.33 43.43 43.22
Korean (374) 38.96 40.97 41.37 41.34
Turkish (355) 39.12 40.94 40.67 40.71
Spanish (339) 23.58 24.52 25.31 24.82
Japanese (331) 39.82 42.82 42.80 42.74
French(328) 26.86 27.18 27.70 27.56
Thai (277) 34.92 35.80 35.79 35.79
Chinese (273) 30.34 32.51 32.27 32.13
Greek (212) 29.89 31.84 33.53 32.51
Italian (178) 28.56 30.42 31.13 30.86
Prepositions
Spanish (588) 23.88 26.44 28.07 27.65
French (390) 19.85 20.95 23.35 21.08
Greek (244) 27.63 30.27 32.03 31.43
Russian (229) 17.16 20.81 22.92 20.85
Chinese (224) 23.11 25.36 24.77 24.88
Korean (215) 19.17 22.83 20.70 23.17
Turkish (213) 18.41 23.33 21.20 22.94
Italian (181) 22.97 22.50 26.26 23.64
Japanese (177) 16.13 17.99 16.66 18.32
Polish (174) 24.25 25.86 24.42 24.52
Thai (170) 18.12 18.87 17.23 19.64
Verb agreement
French (92) 38.99 38.79 42.33 39.97
Spanish (80) 36.59 39.74 40.56 39.46
Thai (58) 27.84 27.79 28.08 29.99
Chinese (54) 43.39 44.71 47.78 43.71
Polish (45) 49.00 52.51 54.71 53.18
Japanese (43) 34.23 33.35 38.48 31.92
Greek (34) 28.06 31.54 30.35 30.14
Korean (29) 33.51 36.57 32.63 37.12
Turkish (24) 36.90 41.00 39.29 40.93
Russian (22) 27.03 31.54 30.65 29.70
Italian (17) 21.34 25.87 24.41 26.30
adaptation (these results are in bold in the table), some language groups do better with adaptation based on other languages than on their own target data.
become more pronounced, and thus there is more benefit when using target-language data for adaptation vs. other-language data. It should be noted, however, that data size for prior estimation depends on error type, or, specifically, the error rate and the size of the confusion set (small for agreement, large for prepositions). Thus, for agreement mistakes, even 40 errors provide a good estimate of error patterns. For preposition mistakes, it is a good idea to have over 200 errors to obtain reasonable estimates. To collect preposition data, this would require about 2K words of annotated learner texts (we assume an average error rate of 10% for preposition mistakes and that prepositions typically account for 10% of words). For verb agreement errors, error rates are often less than 2%, therefore the amount of annotation required might be even higher, despite a smaller confusion set.
Another interesting observation is that, unlike for preposition and verb agreement mistakes, for articles there is no correlation between the size of error data used in adap-tation and the benefit obtained from using target-language adapadap-tation. In fact, observe that we have both more data to estimate article error patterns (Table 12) and a smaller confusion set compared with prepositions, which suggests that estimated language-specific parameters are quite robust. We conjecture that the reason for a smaller benefit from target priors for article mistakes for some of the language groups is that patterns of article errors are more similar across languages than patterns of other error types. Table 15 illustrates article usage patterns in the languages for which we use learner English data. For instance, even though Russian and Korean are not closely related linguistically, because neither of these languages has articles, the error patterns can be expected to be similar.
Finally, the last column shows performance of models that are adapted both with target and other language data, where 20% of the data for adaptation come from the target language. These results help answer the question “if we already have other-language data, would it be helpful to also acquire target-other-language data?” To this end, we compare adaptation using “other” language data only with adaptation that uses other+target data. For article errors, there is no clear benefit to combining target- and other-language data. This is consistent with the adaptation results on articles that do not show an advantage to using target- priors over other-language priors. However, some languages do exhibit a consistent small improvement when target-language data is added to other-language data for adaptation. Specifically, these are the same lan-guages that also exhibit an improvement when target-language data is used instead of other-language data. In general, languages that benefit more from target-language priors are also the same languages that benefit when target priors are added to other priors (see the last two columns). For Greek, for example, adding target-language priors to other-language priors is particularly beneficial.
[image:25.486.54.437.608.661.2]Similarly, for prepositions, typically adding target-language prior data helps in those cases when target-language adaptation is beneficial compared with
Table 15
Article usage across different first languages.
Language Def. article Indef. article
French/Greek/Italian/Spanish + +
Japanese/Korean/Polish/Russian/Thai − −
other-language adaptation. For some languages, however (e.g., Thai and Japanese), other+target adaptation outperforms both the target-language and the other-language adaptations. We conjecture that this happens when target data are scarce and mixing that with other-language data introduces a good balance of common and language-specific error patterns. Finally, for verb agreement, it is not clear when adding target-language data to other data is beneficial.
Similarity of Error Patterns and Its Effect on Adaptation This observation about articles suggests that we should expect target-language adaptation to be particularly useful compared with other-language adaptation, when the error patterns based on the other languages are dissimilar to the target language error patterns. To determine whether this is indeed the case, for two phenomena (articles and verb agreement) we selected two languages that behave differently when it comes to target-language adaptation. For article mistakes, we chose Russian and Greek: Greek is a language that benefits substantially from target priors compared with other-language priors, which is not the case for Russian. Similarly, for verb agreement mistakes, we chose Japanese and Thai.
Table 16 illustrates for each error type and language two error distributions: (1) the distribution of various confusions based on the target data and (2) the distribution of confusions based on data from other languages. For example, the confusion of type
∅-the(the definite article is incorrectly omitted) accounts for 27.5% of all article errors
in the data by Greek writers, and accounts for 40.24% of all mistakes in the Russian data. Based on the evidence from other 10 language backgrounds, this confusion accounts for about 37% of all article mistakes. The relative frequency of this confusion in the Russian data is thus closer to the “averaged” frequency than for the Greek data. Overall, for the majority of article errors in the Russian data (over 66%) the distribution is very similar to “averaged” error statistics, which is not the case for Greek. More generally, we hypothesize that the reason Greek benefits most from moving from “other” priors to “target” priors is because the distribution of article errors for Greek writers is very different from the “averaged” distribution. In contrast, for Russian, both of the distributions are quite close.
If we assume that we have a measure for the distributional distance between “tar-get” and “other” error patterns, then we wish to determine whether there is indeed a correlation between the distributional distance and the benefit from moving from “other” priors to “target” priors. To this end, for a given language background and error type, we compute weighted L2 distance between the “target” error distribution and “other” error distribution, where the coefficients (weights) correspond to the frequency of the occurrence of the specific confusion type. More formally, let tdenote the error distribution of the “target,” andodenote the error distribution of the “other” (these are the distributions shown in Table 16). Thentiandoirefer to the frequencies of the specific
confusion in “target” and “other,” respectively (as shown in Table 16). For instance, the frequency of the confusion type∅-the in the Greek target data is 27.50%. We compute
weightedL2wdistance as follows:
L2w(t,o)= v u u t
n
X
i=1
(ti−oi)2·ti
Table 17 demonstrates that, indeed, largerL2wdistances correspond to bigger advantages