How Creative is Your Writing? A Linguistic Creativity Measure from
Computer Science and Cognitive Psychology Perspectives
Xiaojin Zhu, Zhiting Xu and Tushar Khot
Department of Computer Sciences University of Wisconsin-Madison
Madison, WI, USA 53706
{jerryzhu, zhiting, tushar}@cs.wisc.edu
Abstract
We demonstrate that subjective creativity in sentence-writing can in part be predicted us-ing computable quantities studied in Com-puter Science and Cognitive Psychology. We introduce a task in which a writer is asked to compose a sentence given a keyword. The sentence is then assigned a subjective creativ-ity score by human judges. We build a linear regression model which, given the keyword and the sentence, predicts the creativity score. The model employs features on statistical lan-guage models from a large corpus, psycholog-ical word norms, and WordNet.
1 Introduction
One definition of creativity is “the ability to tran-scend traditional ideas, rules, patterns, relationships, or the like, and to create meaningful new ideas, forms, methods, interpretations, etc.” Therefore, any computational measure of creativity needs to ad-dress two aspects simultaneously:
1. The item to be measured has to be different from other existing items. If one can model ex-isting items with a statistical model, the new item should be an “outlier”.
2. The item has to be meaningful. An item con-sists of random noise might well be an outlier, but it is not of interest.
In this paper, we consider the task of measuring
hu-man creativity in composing a single sentence, when the sentence is constrained by a given keyword. This
simple task is a first step towards automatically mea-suring creativity in more complex natural language text. To further simplify the task, we will focus on the first aspect of creativity, i.e., quantifying how
novel the sentence is. The second aspect, how mean-ingful the sentence is, requires the full power of
Nat-ural Language Processing, and is beyond the scope of this initial work. This, of course, raises the con-cern that we may regard a nonsense sentence as highly creative. This is a valid concern. However, in many applications where a creativity measure is needed, the input sentences are indeed well-formed. In such applications, our approach will be useful. We will leave this issue to future work. The present paper uses a data set (see the next section) in which all sentences are well-formed.
A major difficulty in studying creativity is the lack of an objective definition of creativity. Because creative writing is highly subjective (“I don’t know what is creativity, but I recognize it when I see one”), we circumvent this problem by using human judg-ment as the ground truth. Our experijudg-ment procedure is the following. First, we give a keyword z to a human writer, and ask her to compose a sentence
xabout z. Then, the sentencex is evaluated by a group of human judges who assign it a subjective “creativity score” y. Finally, given a dataset con-sisting of many such keyword-sentence-score triples
(z,x, y), we develop a statistical predictor f(x, z)
that predicts the score y from the sentence x and keywordz.
There has been some prior attempts on charac-terizing creativity from a computational perspec-tive, for examples see (Ritchie, 2001; Ritchie, 2007;
Pease et al., 2001). The present work distinguishes itself in the use of a statistical machine learning framework, the design of candidate features, and its empirical study.
2 The Creativity Data Set
We select 105 keywords from the English version of the Leuven norms dataset (De Deyne and Storms, 2008b; De Deyne and Storms, 2008a). This ensures that each keyword has their norms feature defined, see Section 3.2. These are common English words.
The keywords are randomly distributed to 21 writ-ers, each writer receives 5 keywords. Each writer composes one sentence per keyword. These 5 key-words are further randomly split into two groups:
1. The first group consists of 1 keyword. The writers are instructed to “write a not-so-creative sentence” about the keyword. Two examples are given: “Iguana has legs” for “Iguana”, and “Anvil can get rusty” for “Anvil.” The purpose of this group is to establish a non-creative base-line for the writers, so that they have a sense what does not count as creative.
2. The second group consists of 4 keywords. The writers are instructed to “try to write a creative sentence” about each keyword. They are also told to write a sentence no matter what, even if they cannot come up with a creative one. No example is given to avoid biasing their creative thinking.
In the next stage, all sentences are given to four human judges, who are native English speakers. The judges are not the writers nor the authors of this paper. The order of the sentences are randomized. The judges see the sentences and their correspond-ing keywords, but not the identity of the writers, nor which group the keywords are in. The judges work independently. For each keyword-sentence pair, each judge assigns a subjective creativity score between 0 and 10, with 0 being not creative at all (the judges are given the Iguana and Anvil exam-ples for this), and 10 the most creative. The judges are encouraged to use the full scale when scoring. There is statistically significant (p < 10−8) linear correlation among the four judges’ scores, showing
their general agreement on subjective creativity. Ta-ble 1 lists the pairwise linear correlation coefficient between all four judges.
Table 1: The pairwise linear correlation coefficient be-tween four judges’ creativity scores given to the 105 sen-tences. All correlations are statistically significant with p <10−8.
judge 2 judge 3 judge 4 judge 1 0.68 0.61 0.74 judge 2 0.55 0.74
judge 3 0.61
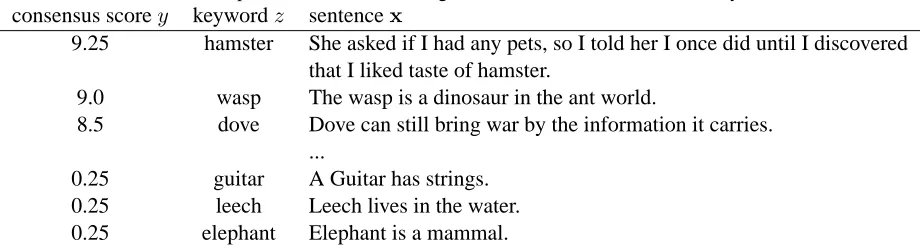
The scores from four judges on each sentence are then averaged to produce a consensus scorey. Ta-ble 2 shows the top and bottom three sentences as sorted byy.
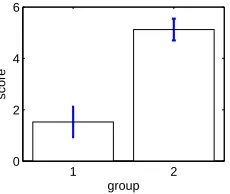
As yet another sanity check, note that the judges have no information which sentences are from group 1 (where the writers are instructed to be non-creative), and which are from group 2. We would expect that if both the writers and the judges share some common notion of creativity, the mean score of group 1 should be smaller than the mean score of group 2. Figure 1 shows that this is indeed the case, with the mean score of group 1 being1.5±0.6, and that of group 2 being5.1±0.4(95% confidence in-terval). At-test shows that this difference is signifi-cant (p <10−11).
1 2
0 2 4 6
group
[image:2.612.371.486.468.565.2]score
Figure 1: The mean creativity score for group 1 is signif-icantly smaller than that for group 2. That is, the judges feel that sentences in group 2 are more creative.
To summarize, in the end our dataset con-sists of 105 keyword, sentence, creativity score tuples {(zi,xi, yi)} for i = 1, . . . ,105.
Table 2: Example sentences with the largest and smallest consensus creativity scores.
consensus scorey keywordz sentencex
9.25 hamster She asked if I had any pets, so I told her I once did until I discovered that I liked taste of hamster.
9.0 wasp The wasp is a dinosaur in the ant world.
8.5 dove Dove can still bring war by the information it carries. ...
0.25 guitar A Guitar has strings. 0.25 leech Leech lives in the water. 0.25 elephant Elephant is a mammal.
//pages.cs.wisc.edu/∼jerryzhu/pub/
WisconsinCreativeWriting.txt.
3 Candidate Features for Predicting Creativity
In this section, we discuss two families of candi-date features we use in a statistical model to pre-dict the creativity of a sentence. One family comes from a Computer Science perspective, using large-corpus statistics (how people write). The other fam-ily comes from a Cognitive Psychology perspective, specifically the word norms data and WordNet (how people think).
3.1 The Computer Science Perspective: Language Modeling
We start from the following hypothesis: if the words in the sentencexfrequently co-occur with the key-word z, thenx is probably not creative. This is of course an over-simplification, as many creative sen-tences are about novel usage of common words1. Nonetheless, this hypothesis inspires some candi-date features that can be computed from a large cor-pus.
In this study, we use the Google Web 1T 5-gram Corpus (Brants et al., 2007). This corpus was generated from about 1012 word tokens from Web pages. It consists of counts of N-gram for
N = 1, . . . ,5. We denote the words in a sentence byx=x1, . . . , xn, wherex1 =hsiandxn =h/si
are special start- and end-of-sentence symbols. We
1For example, one might argue that Lincoln’s famous
sen-tence on government: “of the people, by the people, for the people” is creative, even though the keyword “government” fre-quently co-occurs with all the words in that sentence.
design the following candidate features:
[f1: Zero N-gram Fraction] Letc(xii+N−1) be
the count of the N-gramxi. . . xi+N−1in the corpus.
Let δ(A) be the indicator function with value 1 if the predicate A is true, and 0 otherwise. A “Zero gram Fraction” feature is the fraction of zero N-gram counts in the sentence:
f1,N(x) =
Pn−N+1
i=1 δ(c(xii+N−1) = 0)
n−N+ 1 . (1)
This provided us with 5 features, namely N-gram zero count fractions for each value of N. These fea-tures are a crude measure of how surprising the sen-tencexis. A feature value of 1 indicates that none of the N-grams in the sentence appeared in the Google corpus, a rather surprising situation.
[f2: Per-Word Sentence Probability] This
fea-ture is the per-word log likelihood of the sentence, to normalize for sentence length:
f2(x) = 1
nlogp(x). (2)
We use a 5-gram language model to estimate
p(x), with “naive Jelinek-Mercer” smoothing. As in Jelinek-Mercer smoothing (Jelinek and Mercer, 1980), it is a linear interpolation of N-gram language models forN = 1. . .5. Let the Maximum Likeli-hood (ML) estimate of a N-gram language model be
pNM L(xi|xii−1−N+1) =
c(xii−N+1)
c(xii−1−N+1), (3)
Jelinek-Mercer smoothing language model on sen-tencexis
p(x) = n Y
i=1
p(xi|xii−−5+11 ) (4)
p(xi|xii−−5+11 ) = 5 X
N=1
λNPM LN (xi|xii−−1N+1),(5)
where the linear interpolation weights λ1 +. . .+
λ5 = 1. The optimal values ofλ’s are a function of
history counts (binned into “buckets”) c(xii−−1N+1), and should be optimized with convex optimiza-tion from corpus. However, because our corpus is large, and because we do not require precise lan-guage modeling, we instead set theλ’s in a heuris-tic manner. Starting from N=5 to 1, λN is set
to zero until the N where we have enough history count for reliable estimate. Specifically, we require
c(xii−−1N+1) > 1000. The first N that this happens receives λN = 0.9. The next lower order model
receives 0.9 fraction of the remaining weight, i.e.,
λN−1 = 0.9×(1−0.9), and so on. Finally,λ1
re-ceives all remaining weight to ensureλ1+. . .+λ5=
1. This heuristic captures the essence of Jelinek-Mercer smoothing and is highly efficient, at the price of suboptimal interpolation weights.
[f3: Per-Word Context Probability] The
previ-ous feature f2 ignores the fact that our sentencex
is composed around a given keywordz. Given that the writer was prompted with the keywordz, we are interested in the novelty of the sentence surround-ing the keyword. Letxk be the first occurrence of zin the sentence, and let x−k be the context of the
keyword, i.e., the sentence with thek-th word (the keyword) removed. This notion of context novelty can be captured by
p(x−k|xk=z) =
p(x−k, xk =z) p(xk=z) =
p(x) p(z), (6)
where p(x) is estimated from the naive Jelinek-Mercer 5-gram language model above, andp(z) is estimated from a unigram language model. Our third feature is the length-normalized log likelihood of the context:
f3(x, z) =
1
n−1(logp(x)−logp(z)). (7)
3.2 The Cognitive Psychology Perspective: Word Norms and WordNet
A text corpus like the one above captures how peo-ple write sentences related to a keyword. However, this can be different from how people think about
re-lated concepts in their head for the same keyword.
In fact, common sense knowledge is often under-represented in a corpus – for example, why bother repeating “A duck has a long neck” over and over again? However, this lack of co-occurrence does not necessarily make the duck sentence creative.
The way people think about concepts can in part be captured by word norms experiments in psychol-ogy. In such experiments, a human subject is pro-vided with a keywordz, and is asked to write down the first (or a few) word x that comes to mind. When aggregated over multiple subjects on the same keyword, the experiment provides an estimate of the concept transition probability p(x|z). Given enough keywords, one can construct a concept net-work where the nodes are the keywords, and the edges describe the transitions (Steyvers and Tenen-baum, 2005). For our purpose, we posit that a sen-tencexmay not be creative with respect to a key-wordz, if many words inxcan be readily retrieved as the norms of keyword z. In a sense, the writer was thinking the obvious.
[f4: Word Norms Fraction] We use the
Leu-ven dataset, which consists of norms for 1,424 key-words (De Deyne and Storms, 2008b; De Deyne and Storms, 2008a). The original Leuven dataset is in Dutch, we use a version that is translated into En-glish. For each sentencex, we first exclude the key-wordzfrom the sentence. We also remove punctu-ations, and map all words to lower case. We further remove all stopwords using the Snowball stopword list (Porter, 2001), and stem all words in the sentence and the norm word list using NLTK (Loper and Bird, 2002). We then count the number of wordsxi that
appear in the norm list of the keywordzin the Leu-ven data. Let this count becnorm(x, z). The feature
is the fraction of such norm words in the original sentence:
f4(x, z) =
cnorm(x, z)
n . (8)
is a common issue with psychology norms datasets, as massive number of human subjects are difficult to obtain. To scale our method up to handle large vocabulary in the future, one possible method is to automatically infer the norms of novel keywords us-ing corpus statistics (e.g., distributional similarity).
[f5−f13: WordNet Similarity] WordNet is
an-other linguistic resource motivated by cognitive psy-chology. For each sentence x, we compute Word-Net 3.0 similarity between the keywordz and each word xi in the sentence. Specifically, we use the
“path similarity” provided by NLTK (Loper and Bird, 2002). Path similarity returns a score denot-ing how similar two word senses are, based on the shortest path that connects the senses in the hyper-nym/hyponym taxonomy. The score is in the range 0 to 1, except in those cases where a path cannot be found, in which case -1 is returned. A score of 1 represents identity, i.e., comparing a sense with it-self. Let the similarities bes1. . . sn. We experiment
with the following features: The mean, median, and variance of similarities:
f5(x, z) = mean(s1. . . sn) (9) f6(x, z) = median(s1. . . sn) (10) f7(x, z) = var(s1. . . sn). (11)
Features f8, . . . , f12 are the top five similarities.
When the length of the sentence is shorter than five, we fill the remaining features with -1. Finally, fea-turef13is the fraction of positive similarity:
f13(x, z) = Pn
i=1δ(si >0)
n . (12)
4 Regression Analysis on Creativity
With the candidate features introduced in Section 3, we construct a linear regression model to predict the creativity scores given a sentence and its keyword.
The first question one asks in regression analy-sis is whether the features have a (linear) correlation with the creativity scorey. We compute the correla-tion coefficient
ρi = Cov( fi, y) σfiσy
(13)
for each candidate featurefi separately on the first
row in Table 3. Some observations:
• The featuref4 (Word Norms Fraction) has the
largest correlation coefficient -0.48 in terms of magnitude. That is, the more words in the sen-tence that are also in the norms of the keyword, the less creative the sentence is.
• The featuref12(the 5-th WordNet similarity in
the sentence to the keyword) has a large posi-tive coefficient 0.47. This is rather unexpected. A closer inspection reveals that f12 equals -1
for about half of the sentences, and is around 0.05 for the other half. Furthermore, the second half has on average higher creativity scores. Al-though we hypothesized earlier that more simi-lar words means lower creativity, this (together with the positive ρ for f10, f11) suggests the
other way around: more similar words are cor-related with higher creativity.
• The featuref5 (mean WordNet similarity) has
a negative correlation with creativity. This fea-ture is related to f12, but in a different
direc-tion. We speculate that this feature measures the strength of similar words, while f12
indi-rectly measures the number of similar words.
• The featuref3 (Per-Word Context Probability)
has a negative correlation with creativity. The more predictable the sentence around the key-word using a language model, the lower the creativity.
Next, we build a linear regression model to pre-dict creativity. We use stepwise regression, which is a technique for feature selection by iteratively including / excluding candidate features from the regression model based on statistical significance tests (Draper and Smith, 1998). The result is a lin-ear regression model with a small number of salient features. For the creativity dataset, the features (and their regression coefficients) included by stepwise regression are shown on the second row in Table 3. The corresponding linear regression model is
ˆ
y(x, z) = −5.06×f4+ 1.80×f12−0.76×f3
−3.39×f5+ 0.92. (14)
Table 3: ρ: The linear correlation coefficients between a candidate feature and the creativity scorey.β: The selected features and their regression coefficients in stepwise linear regression.
f1,1 f1,2 f1,3 f1,4 f1,5 f2 f3 f4 f5
ρ 0.09 0.09 0.17 0.06 -0.04 -0.07 -0.32 -0.48 -0.41
β -0.76 -5.06 -3.39
f6 f7 f8 f9 f10 f11 f12 f13
ρ -0.19 -0.25 -0.02 0.06 0.23 0.30 0.47 -0.01
β 1.80
0 5 10
0 2 4 6 8 10
predicted score
true score
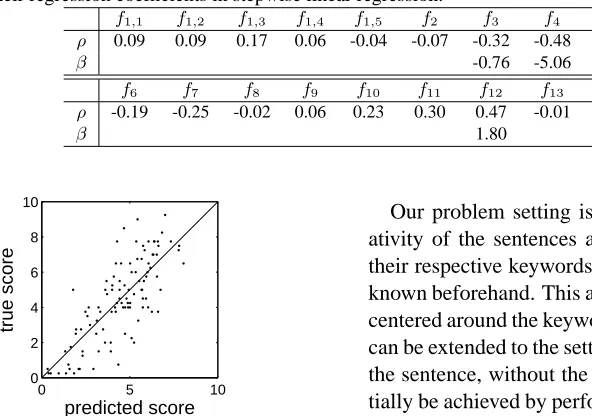
Figure 2: The creativity scoreyˆas predicted by the linear regression model in equation 14, compared to the true scorey. Each dot is a sentence.
1.51. In contrast, the constant predictor would have RMSE 2.37 (i.e., the standard deviation ofy).
We make two comments:
1. It is interesting to note that our intuitive fea-tures are able to partially predict subjective cre-ativity scores. On the other hand, we certainly do not claim that our features or model solved this difficult problem.
2. All three kinds of knowledge: corpus statistics (f3), word norms (f4), and WordNet (f5, f12)
are included in the regression model. Coin-cidentally, these features have the largest cor-relation coefficients with the creativity score. The fact that they are all included suggests that these are not redundant features, and each cap-tures some aspect of creativity.
5 Conclusions and Future Work
We presented a simplified creativity prediction task, and showed that features derived from statistical language modeling, word norms, and WordNet can partially predict human judges’ subjective creativity scores.
Our problem setting is artificial, in that the cre-ativity of the sentences are judged with respect to their respective keywords, which are assumed to be known beforehand. This allows us to design features centered around the keywords. We hope our analysis can be extended to the setting where the only input is the sentence, without the keyword. This can poten-tially be achieved by performing keyword extraction on the sentence first, and apply our analysis on the extracted keyword.
As discussed in the introduction, our analysis is susceptible to nonsense input sentences, which could be predicted as highly creative. Combining our analysis with a “sensibility analysis” is an im-portant future direction.
Finally, our model might be adapted to explain why a sentence is deemed creative, by analyzing the contribution of individual features in the model.
6 Acknowledgments
We thank the anonymous reviewers for suggestions on related work and other helpful comments, and Chuck Dyer, Andrew Goldberg, Jake Rosin, and Steve Yazicioglu for assisting the project. This work is supported in part by the Wisconsin Alumni Re-search Foundation.
References
Thorsten Brants, Ashok C. Popat, Peng Xu, Franz J. Och, and Jeffrey Dean. 2007. Large language models in machine translation. In EMNLP.
S. De Deyne and G Storms. 2008a. Word associations: Network and semantic properties. Behavior Research
Methods, 40:213–231.
S. De Deyne and G Storms. 2008b. Word associations: Norms for 1,424 Dutch words in a continuous task.
Norman R. Draper and Harry Smith. 1998. Applied Regression Analysis (Wiley Series in Probability and Statistics). John Wiley & Sons Inc, third edition.
Frederick Jelinek and Robert L. Mercer. 1980. Inter-polated estimation of Markov source parameters from sparse data. In Workshop on Pattern Recognition in
Practice.
Edward Loper and Steven Bird. 2002. NLTK: The nat-ural language toolkit. In The ACL Workshop on
Ef-fective Tools and Methodologies for Teaching Natural Language Processing and Computational Linguistics,
pages 62–69.
Alison Pease, Daniel Winterstein, and Simon Colton. 2001. Evaluating machine creativity. In Workshop
on Creative Systems, 4th International Conference on Case Based Reasoning, pages 129–137.
Martin F. Porter. 2001. Snowball: A language for stem-ming algorithms. Published online.
Graeme Ritchie. 2001. Assessing creativity. In
Pro-ceedings of the AISB01 Symposium on Artificial Intel-ligence and Creativity in Arts and Science, pages 3–11.
Graeme Ritchie. 2007. Some empirical criteria for at-tributing creativity to a computer program. Minds and
Machines, 17(1):67–99.
Mark Steyvers and Joshua Tenenbaum. 2005. The large scale structure of semantic networks: Statistical anal-yses and a model of semantic growth. Cognitive