An analysis of a French as a Foreign language corpus for
readability assessment
Thomas François
IL&C, Cental, Université catholique de Louvain
A
BSTRACTReadability aims to assess the difficulty of texts based on various linguistic predictors (the lexicon used, the complexity of sentences, the coherence of the text, etc.). It is an active field that has applications in a large number of NLP domains, among which machine translation, text simplification, text summarisation, or CALL (Computer-Assisted Language Learning). For CALL, readability tools could be used to help the retrieval of educational materials or to make CALL platforms more adaptive. However, developing a readability formula is a costly process that requires a large amount of texts annotated in terms of difficulty. The current mainstream method to gather such a large corpus of annotated texts is to get them from educational resources such as textbooks or simplified readers.
In this paper, we describe the collection process of an annotated corpus of French as a foreign language texts with the purpose of training a readability model. We follow the mainstream approach, getting the texts from textbooks, but we are concerned with the limitations of such “annotation” approach, in particular, as regards the homogeneity of the difficulty annotations across textbook series. Their reliability is assessed using both a qualitative and a quantitative analysis. It appears that, for some educational levels, the hypothesis of the annotation ho-mogeneity must be rejected. Various reasons for such findings are discussed and the paper concludes with recommandations for future similar attempts.
K
EYWORDS:
readability, FFL, corpus collect, reliability of difficulty annotations.1
Introduction
Today, the market for foreign language learning is actively growing as a result of various factors, such as the E.U. enlargement and the increase in the number of languages represented in the Union, but also a greater mobility of its citizens. Faced with this increased interest in foreign language learning, teaching institutions are struggling to keep up with demand. In this context, the domains of CALL (Computer-Assisted Language Learning) and iCALL (Intelligent CALL) have a role to play (Nerbonne, 2003, 673). Various CALL and iCALL applications have been designed to enhance classroom practices or replace it, but they still lack some flexibility as regards the input and the feedback offered to the user (Klenner and Visser, 2003).
For instance, some adaptive programs are able to select, in an exercise database, an item tailored to the learner’s level (Desmet, 2006). However, it requires the pre-annotation of all the items in terms of difficulty, which restricts the versatility of the user module. Being able to generate suitable exercises on the fly from a corpus appears as a better way to adapt to specific learner difficulties. The automatic generation of exercises has already been researched, mostly for English (Coniam, 1997; Brown et al., 2005; Smith et al., 2009; Chen et al., 2006; Heilman, 2011; Meurers et al., 2010), but also for French (Antoniadis et al., 2005; Selva, 2002). However, the majority of these systems either use excerpts whose difficulty has been manually annotated or excerpts extracted from a large corpus and thus lacking any difficulty annotations. In the first case, the system is able to adapt to the user’s needs only within the limits of the available materials. In the second case, any type of exercise can be generated on the fly, but because there is no control of the difficulty of excerpts, the contextual complexity is likely to hinder the user’s comprehension and his/her ability to perform the exercise.
Faced with this challenge, one solution is to use readability metrics in order to pre-select a subset of excerpts matching the user’s proficiency level, as it is done in theLärkaplatform (Pilán et al., 2013). Readability is a field that aims to assess the difficulty of texts in a reproducible way – which can therefore be automatized – based on various linguistic dimensions of the texts (e.g. lexicon, syntax, text structure, etc.). The first studies in the field date back to the 1920’s (Lively and Pressey, 1923) and have traditionally been carried out by psychologists. However, readability has undergone recent developments. They result from the contact with two other fields: natural language processing (NLP) is used to extract more complex linguistic predictors, whereas artificial intelligence (AI) provides complex statistical algorithms to better exploit the regularities existing between text difficulty and the linguistic predictors. Recent work has been carried out mostly on English as a first language (L1) (Collins-Thompson and Callan, 2005; Feng et al., 2010; Vajjala and Meurers, 2012) or English as a second or foreign language (L2) (Heilman et al., 2007; Schwarm and Ostendorf, 2005), but also on other languages such as Swedish (Pilán et al., 2014), French (François and Fairon, 2012; Todirascu et al., 2013; Dascalu, 2014; François et al., 2014), or Arabic (Al-Khalifa and Al-Ajlan, 2010), among others.
Europe. To our knowledge, only two research teams have currently designed a readability model compliant with the CEFR scale (François and Fairon, 2012; Pilán et al., 2014). We suspect that this is partly due to the efforts needed to collect the training corpus required to develop such readability formula.
In this paper, we detail the collection process of a readability-intended corpus that has been carried out for French as a foreign language (FFL), using FFL textbooks as a source for the labelled texts. We describe the various issues encountered during this collection, focusing mostly on the issue of the reliability of the difficulty annotations. In section 2, we first expose the various type of criteria that have been used in readability studies to get data annotated in terms of difficulty and we discuss the advantages and shortcomings of each of them. The section 3 then details our collection process and describes the resulting corpus. Finally, Section 4 investigates the quality of the collected data, using both a qualitative analysis and a quantitative analysis based on statistical tests to assess the homogeneity of the annotations across textbooks.
2
Criteria for readability annotation
This section discusses various techniques that have been used to measure the difficulty of texts for reading. This issue is influenced by the fashion we define the term “difficulty”, which is an elusive concept corresponding to a multifaceted reality. A large corpus of studies in psycholinguistics have addressed this question (for a survey, see (Ferrand, 2007)), but there is currently no integrated model that precisely explains what causes reading difficulty. However, the pragmatic vision underlying readability studies cannot be satisfied with a fuzzy definition. It is therefore common in the field to use a single variable, easily measured and based on theoretical arguments from psycholinguistics, as an estimation of the reading difficulty of texts. This variable is called “criterion” and various ones have been used for readability purposes. We briefly discuss each of them and explain why collecting texts from textbooks is currently considered as one of the best criteria.
The first criterion used in readability wasexpert judgements. It dates back as early as the seminal work by (Lively and Pressey, 1923) and consists in gathering a small set of experts – supposed to share a good vision of the reading difficulties encountered by the population of interest – and ask them to judge the difficulty of a set of texts. Using a scale such as educational grades to label the texts, the experts need to project themselves into the mind of potential readers whose characteristics they know from their professional activity. However, the quality of this projection is variable. Gilbert de Landsheere (1978) had six texts annotated by twenty experts and noticed a high variation between their judgements. More recently, van Oosten et al. (2011) addressed this question with modern statistical techniques: 105 excerpts were assessed by pair (e.g. text A is more difficult than text B) by a group of experts. The experts were then grouped according to the similarity of their annotations via a clustering algorithm. Each expert group corresponded to a set of texts, which was divided into a training and a test corpus. Then, for each training corpus available, binary classification models were trained and their performance was assessed both on the test corpus from the same cluster (intra-cluster validation) and on test corpora from other clusters (inter-cluster validation). Interestingly, the performance of all models significantly deteriorates in the inter-cluster condition, leading the authors to question the possibility of reaching a satisfactory agreement between experts.
Carver (1974) and Singer (1975) adopted the reverse view, considering that the human annotation of text difficulty can be reliable under some conditions. Their method, called
Then, three experts compare the same text with this yardstick and the final label of the text corresponds to the average of the three judgements. Carver (1974) carried out two experiments using this technique and showed that it is slightly more valid than classic formulas such as (Dale and Chall, 1948) or (Flesch, 1948). Later, (Björnsson, 1983, 482) reached a similar conclusion:
Traditionally it has been thought that judges’ ratings of absolute difficulty are unreli-able. From our experience they are not, i.e., when they are made by a fairly large group of persons, when the passages are relatively long, and when the range in difficulty in the text battery is wide.
Beyond this crucial and still opened question of the validity of experts’ judgements, this criterion presents another shortcoming, namely the availability and cost of experts that limits the amount of data that one can collect.
The second criterion to be used in readability iscomprehension tests. Faced with the question-able validity of experts’ judgements, Dale and Tyler (1934) and Ojemann (1934) investigated another approach: testing the reading comprehension of subjects directly with tests. The difficulty level of a text therefore corresponds to the mean score obtained by all the subjects that took the test. This approach has the benefit of directly measuring the comprehension, taking into account the interaction existing between the text and the reader. This criterion appeared for some time as the best criterion for readability, even though it was more costly than expert judgements. However, a major shortcoming was soon stressed: the interaction existing between the difficulty of the text and the difficulty of the questions. Davis (1950, cited by de Landsheere (1978, 33)) confirmed this issue with the following experiment: he designed two versions of a test on the same text, manipulating only the frequency of the words used in the questions, and noticed a significant difference in the scores of the subjects between both conditions. Further issues with comprehension tests also arose: the order of the questions matters and comprehension tests are not able to focus on all parts of the texts. In spite of these problems, comprehension tests were largely used as a readability criterion between 1930 and 1960.
They were gradually abandoned to the advantage of a third criterion: thecloze test. Introduced by Taylor (1953), this test simply consists in deleting a word out of five in a text before asking subjects to fill those gaps. The amount of filled blanks is supposed to be correlated with the subject understanding of the text. Since there is no need to formulate questions, the main flaw of comprehension tests (the interaction between the questions and the text) is removed. Moreover, with such a simple design process, it is possible for two researchers to produce exactly the same test for a text. As a result of these advantages, the cloze test was quickly adopted by researchers in readability (Miller and Coleman, 1967; Aquino et al., 1969; Bormuth, 1969; Caylor et al., 1973; Kincaid et al., 1975). Bormuth (1969) also highlighted another advantage of this criterion: its ability to measure the difficulty of smaller units than a text, such as a sentence or even a word.
section of this standard test that measures lexical knowledge and she got a correlation of 0.73 with the section measuring comprehension. However, Weaver and Kingston (1963) stand up for the opposite view, arguing that it is textual redundancy which is rather measured. They obtained weak correlations between theDavis Reading Testand cloze test.
Another critic addressed to the cloze test is that it is hardly necessary to use clues located beyond the local context of the current sentence to correctly fill one gap. Miller and Coleman (1967) investigated this issue with a protocol in which subjects had to guess 150 consecutive words from excerpts. It appears that the answers produced were not much constrained by the previous sentences. Shanahan et al. (1982) confirmed that sentential information is paramount to correctly perform a cloze task. This obviously appears as a major weakness of this criterion, especially for more advanced readers for whom reading problems are more global than local.
Other criteria also have been investigated, but only by a limited number of researchers.Recall, or more precisely the number of words memorized, was used by Richaudeau (1974). However, this criterion was criticized by Kintsch et al. (1975), since it does not match any psychological reality. Another criterion explored isreading time. Brown (1952) compared the time spent on two texts by subjects, the former being considered as difficult and the latter as very difficult. On the former, the average reading speed was 306 words/min. while it only reached 235 words/min. for the latter. This association between reading comprehension and reading speed has been later experimentally corroborated by Oller (1972) and supported by the theoretical model by (Just and Carpenter, 1980). Despite these favourable studies, reading speed has been very little used in readability. One of the problems is the necessity to ensure that the subjects read naturally, while the experimental cost is also an issue.
In view of all these considerations, there is no criterion that stands out as the most valid and practical. This fact led current approaches of readability to use a criterion convenient enough to collect the large amount of texts required by the NLP and IA techniques. This criterion consists in collecting texts from textbooks or simplified readers, provided that these books are labelled accordingly to an educational scale. Such approach relies on the assumption that the calibration of those texts have been carried out by experts, which amounts to use experts’ judgements. This way of colecting labelled data has been widely used in readability. Most of the famous classic formulas (Lorge, 1944; Dale and Chall, 1948; Flesch, 1948; Gunning, 1952) have been trained on the McCall and Crabbs lessons. Spache (1953) trained, on a corpus of primary textbooks, a formula intended for primary schoolchildren that has been acknowledged as one of the most reliable for this specific population. However, it is with the advent of what François and Fairon (2012) call the “IA readability” that this criterion has somehow becomed the standard approach. This is also due to the fact that Si and Callan (2001) suggested to view text readability assessment as a classification task. It implies to assign training texts to a few number of classes, which may quite logically corresponds to educational levels.
3
A textbook corpus for French as a foreign language
3.1
The collect
With the intent of later training a readability formula, we have collected a corpus of texts from FFL textbooks. This choice was motivated by the following three requirements: (1) as said above, the size of our corpus must be large enough to allow the training of modern machine learning algorithms; (2) the difficulty labels used for annotation must be convenient for the end users of the readability model, and (3) the content and the genre of the texts should be as diverse as possible to ensure a better generability of the model. Therefore, extracting texts from FFL textbooks compliant with the the Common European Framework of Reference for Language (CEFR) appeared to be a good solution to these three constraints.
Released in 2001 by the Council of Europe, the CEFR “provides a common basis for the elaboration of language syllabuses, curriculum guidelines, examinations, textbooks, etc. across Europe” (Council of Europe, 2001, 1). The document has achieved a wide success in Europe, being translated into at least 20 European languages (Little, 2006) and being implemented in most of the institutions providing L2 education. One of the flagship features of the CEFR is its competency scale that has been described according to two dimensions: vertical and horizontal. The vertical dimension is the best known and describes six levels: A1 (Breakthrough); A2 (Waystage); B1 (Threshold); B2 (Vantage); C1 (Effective Operational Proficiency) and C2 (Mastery). This scale has been calibrated with a mixed methodology that combines experts knowledge with data from qualitative and quantitative studies on learners (Council of Europe, 2001, 150). As a result, the CEFR scale appears quite reliable and the large majority of textbooks posterior to 2001 bear a CEFR level. Unfortunately, the Council of Europe has not developed a system validating the adequacy between the self-declared level of textbooks and their actual content (Alderson, 2007). This lack of control is prone to generate some heterogeneity between textbooks series.
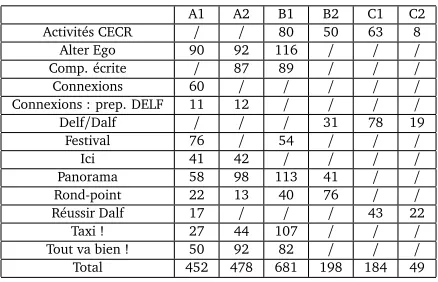
To investigate this potential issue, we collected 2,042 texts from 28 textbooks. Not all textbooks available on the market were selected, because they had to meet the three following criteria: (1) to be published after 2001 in order to bear a CEFR level, (2) to be intended for adults or teenagers learning FFL for general purposes and (3) not to be tailored for a public with a specific L1 background. These two last considerations were implied by the type of population that we wanted to model for our readability model: young adults and adults with varied L1 backgrounds. Furthermore, all extracted texts had to be related to a reading comprehension task. Each of the 2,042 collected texts was scanned and automatically transformed into a machine-readable format (XML) using an optical character recognition tool. We then manually revised and corrected the scanned texts, removed peripheral information such as instructions, images, tables, etc. and assigned to each text the level of the textbook it came from.
We met an unexpected difficulty during this last operation. Some textbooks cover more than one CEFR level and have a mixed tag (e.g. A1/A2). In this case, we had to analyse each textbook introductory comments, organisation and structure to gather enough information to distribute each text in one of the two levels1. The corpus collected at the end of the process is summarised at Table 1, which lists the series used and the amount of texts collected per level.
A1 A2 B1 B2 C1 C2
Activités CECR / / 80 50 63 8
Alter Ego 90 92 116 / / /
Comp. écrite / 87 89 / / /
Connexions 60 / / / / /
Connexions : prep. DELF 11 12 / / / /
Delf/Dalf / / / 31 78 19
Festival 76 / 54 / / /
Ici 41 42 / / / /
Panorama 58 98 113 41 / /
Rond-point 22 13 40 76 / /
Réussir Dalf 17 / / / 43 22
Taxi ! 27 44 107 / / /
Tout va bien ! 50 92 82 / / /
[image:7.420.101.320.39.180.2]Total 452 478 681 198 184 49
Table 1: Number of texts per level, by textbooks series
3.2
Corpus characteristics
In this section, we further discuss some characteristics of our corpus, namely (1) the metadata used; (2) the distribution of text genres in the corpus, and (3) the distribution of texts per level.
As for the metadata, the tags were kept very simple since most of the contextual features of texts (such as instructions, images, figures, etc.) had been removed. We defined the six following tags:
Level: take one value among the six levels the CEFR scale (A1, A2, B1, B2, C1, and C2);
Lesson: the textbook lesson in which the text is studied. It was normalized as follows:
Lesson localization index= number of the lesson
total number of lessons in the textbook
This lesson localization index appeared propitious in case we would like to transform the CEFR ordinal scale into a continuous scale.
Source: the textbook name from which the text was extracted;
Page: the page(s) of the textbook from which the text comes;
Date: the publication date of the textbook;
Type of text: the genre of the text (see below for details),
Title: the title of the text.
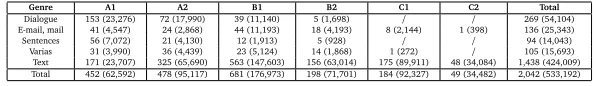
the rare genres (ads, songs, poems, and recipes) within theVariascategory. It should also be mentioned that although the corpus does not seem very balanced across text genres and levels at first glance, we believe that these figures are pretty representative of the distribution of texts within the population of FFL textbooks.
Genre A1 A2 B1 B2 C1 C2 Total
[image:8.420.60.358.96.139.2]Dialogue 153 (23,276) 72 (17,990) 39 (11,140) 5 (1,698) / / 269 (54,104) E-mail, mail 41 (4,547) 24 (2,868) 44 (11,193) 18 (4,193) 8 (2,144) 1 (398) 136 (25,343) Sentences 56 (7,072) 21 (4,130) 12 (1,913) 5 (928) / / 94 (14,043) Varias 31 (3,990) 36 (4,439) 23 (5,124) 14 (1,868) 1 (272) / 105 (15,693) Text 171 (23,707) 325 (65,690) 563 (147,603) 156 (63,014) 175 (89,911) 48 (34,084) 1,438 (424,009) Total 452 (62,592) 478 (95,117) 681 (176,973) 198 (71,701) 184 (92,327) 49 (34,482) 2,042 (533,192)
Table 2: Number of texts and words per level and genre.
The distribution of texts per level at Table 2 is clearly unbalanced: A1 includes almost ten times more texts than C2. This situation is due to the fact that at the later stages of learning, L2 learners are able to read almost any authentic texts and the need for carefully calibrated texts thus decreases. As a consequence, there are not many textbooks available for higher levels, especially for C2. The problem of having unbalanced classes is that “classification is sensitive to the relative sizes of the (...) component groups and will always favour classification into the larger group” (Hosmer and Lemeshow, 1989, 147). In the next section, we will also further discuss this issue of unbalanced classes along with the main issue of this paper: the heterogeneity of the level annotations.
4
Analyses of the corpus
The previous section has related the collection process of our corpus and detailed some of its characteristics. It has also stressed two main issues regarding the corpus: (1) the possible heterogeneity of the difficulty annotations due to a lack of control in the adequacy between textbook contents with the CEFR scale and (2) the shortage of high level texts, which results into an unbalanced dataset likely to cause bias in any readability model trained on the corpus. In this section, we report analyses investigating both issues, starting with the latter.
4.1
The class imbalanced experiment
In order to determine whether having an unbalanced dataset would impact subsequent learning on that corpus, we applied the following methodology. We sampled two different datasets from the whole corpus. For the first (Corpus6Apriori), we simply applied a stratified sampling that respects the a priori probability of each class. This amounts to 66 texts for A1, 72 for A2, 99 for B1, 29 for B2, 27 for C1 and 7 for C2. For the second dataset (Corpus6Equi), we also applied a stratified sampling, but selected a fixed amount of texts in each class– about 50, which corresponds to the size of the least populated class (C2). Finally, we sampled 120 texts (20 per level) in the remaining texts2to be used as the test set.
Concerning the readability model, since the aim was not to reach the highest performance possible, we selected two simple and broadly-used linguistic features as predictors: the mean number of letter per words (NLM) and the mean number of words per sentence (NWS). They were combined with a proportional-odds model, also known as ordinal logistic regression (Agresti, 2002, 274-282). Their performance were assessed with the multiple correlation
2For theCorpus6Equi, there were no remaining texts for C2, so we had to use the same texts for the training and the
coefficient (R2), estimated on the training set, the test set and using a bootstrap .632 procedure3. The results are detailed in Table 3.
Training corpus Bootstrap .632 Test corpus
Corpus6Equi 0, 40 0, 39 0, 41
[image:9.420.129.291.271.357.2]Corpus6Apriori 0, 43 0, 42 0, 43
Table 3:R2estimated, for both datasets, on the training set, on the test set or with the bootstrap .632 procedure.
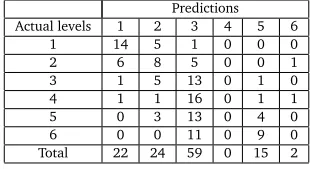
Surprisingly, theCorpus6Apriorimodel performs better in all of the three conditions (training, test and bootstrap). However, this apparent superiority must be qualified when we look more closely at the confusion matrix. Tables 4 and 5 show the confusion matrix for both models on the test set. It clearly appears that the high number of B1 texts in theCorpus6Aprioricondition distorts the regression space (about 50% of the texts are predicted as B1). The model trained onCorpus6Equipresents a more balanced distribution that slightly favours the extreme classes (A1 and C2)4. Moreover, theCorpus6Apriorimodel is not able to classify any text as B2, which is a very critical flaw for a tool aiming to be used in real contexts by L2 learners or teachers. We conclude from this first experiment that a readability corpus should have, as much as possible, a balanced number of observations per class.
Predictions
Actual levels 1 2 3 4 5 6
1 15 4 1 0 0 0
2 5 7 1 4 1 2
3 3 4 3 3 3 4
4 0 4 5 1 4 6
5 3 0 3 3 3 8
6 0 1 2 0 4 13
Total 26 20 15 11 15 33
Table 4: Confusion matrix for the model trained onCorpus6Equi.
Predictions
Actual levels 1 2 3 4 5 6
1 14 5 1 0 0 0
2 6 8 5 0 0 1
3 1 5 13 0 1 0
4 1 1 16 0 1 1
5 0 3 13 0 4 0
6 0 0 11 0 9 0
Total 22 24 59 0 15 2
Table 5: Confusion matrix for the model trained onCorpus6Apriori.
3This procedure, described among others by Tufféry (2007, 369-370), estimates the model’s performance as the
average of 100 repeated experiments. In these, each training set is slightly different since it is obtained through a sampling with replacement of the texts.
4Similar effect was stressed by François and Fairon (2012) although they used a support vector model (SVM) instead
[image:9.420.132.287.394.479.2]4.2
Testing the homogeneity of the corpus
4.2.1 Methodology and hypotheses
For the reasons exposed in Section 3.1, the difficulty annotations in our corpus are likely to be more heterogeneous than expected. To investigate this issue, we applied the following methodology. First, we selected two readability indices whose relation with text difficulty has been confirmed by many studies in the literature: the mean number of letter per words (NLM) and the mean number of words per sentence (NWS). They are representative of the lexical and syntactic dimensions of the texts in our corpus, but we also wanted to have a semantic index, so we opted for the density of ideas in a text (ConcDens). The efficiency of this last feature is not as well-acknowledged as that of the two previous ones, butConcDenshas the advantage of taking into account textual dimensions that have been deemed critical for comprehension since the 1970’s. However, parameterizing the density of ideas in a text is not as straightforward as counting the number of letters or the number of words. It underlies a more complex theoretical model, which also involves more complex NLP routines.
Our measure of the density of ideas is based on Kintsch et al. (1975)’s propositional model5. These authors showed that the number of propositions and the number of different arguments in a sentence influence its reading time and therefore, most likely, its comprehension. To implement Kintsch’s model, we used the recently published French toolDensidées(Lee et al., 2010). This program draws from previous attempts for English: Snowdon et al. (1996) showed that it is possible to estimate the propositional density of a text from the number of verbs, adjectives, adverbs, prepositions, and conjunctions divided by the number of words, while Brown et al. (2008) implemented this approach using 37 rules.Densidéesis based on a similar approach. It is able to estimate the mean number of propositions per word in a text using 35 rules making use of lexical and part-of-speech clues.
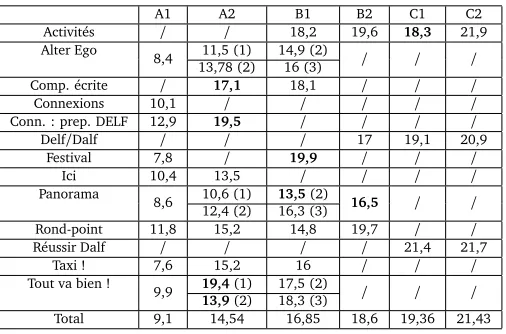
In a second step, we computed, for each of the three above variables, their means on all texts belonging to a given textbook and classified within one given level6. Then, these means were compared using a twofold approach: (1) a qualitative analysis of the tables 6, 7, and 8 first helped to detect irregularities, (2) then quantitative analyses were performed to determine whether these irregularities were large enough to conclude to the corpus heterogeneity. More precisely, we aimed to test the three following hypothesis:
1. the means of each variable per level (computed on all the texts of this level), which is shown at the last row of each table, should increase with the level of difficulty.
2. if the annotations within a given level are homogeneous, the means of each textbook from this level will not be significantly different from all other means from that level.
3. within the same textbook series, the mean of a given level will be greater than the means of all textbooks at a lower level.
The hypothesis (1) and (3) were investigated manually, while for the (2), the analyses were based on the analysis of variance (ANOVA), which takes in account each of the three predictors independently, and its multivariate variant (MANOVA), in which the effect of all three variables can be taken into account in a combined way.
5This model postulates that any text can be represented as a list of propositions, a proposition being defined as a
predicate (for instance a verb or a noun) and a few number of arguments linked to this predicate.
4.2.2 Qualitative analysis
As regards the qualitative analysis of the three tables 6, 7, and 8, it first appears that the means by level indeed increase, as expected from the hypothesis (1). There are however a few exceptions: the lexical complexity of B2 textbooks is surprisingly lower than that of B1 textbooks, whereasConcDensis not very efficient to distinguish between A2, B1 and B2 texts, as well as between C1 and C2. This could be due either to the fact that the content of textbooks series does not increase in terms of conceptual difficulty or to the fact thatConcDensis a less reliable predictor of difficulty thanNLMandNWS. A manual skimming of sampled texts of various levels tends to let us discard the first explanation. To test the second one, we sampled 50 texts per level with a stratified sampling by textbooks and then computed Pearson correlations between each of our three features and these text annotations. It was obvious thatmeanNWS (r=0, 62) andNLM(r=0, 52) are better predictors thanConcDens(r=0, 37). This last feature is interesting for it takes higher textual dimension into account. However, it does not seem reliable enough to undertake a critical analysis of our corpus annotations. This is why we will not discuss it any further in the rest of the paper.
A1 A2 B1 B2 C1 C2
Activités / / 4,56 4,70 4,61 4,81
Alter Ego
4,37 4,42 (1) 4,60 (2) / / /
4,48 (2) 4,61 (3)
Comp. écrite / 4,67 4,67 / / /
Connexions 4,21 / / / / /
Conn. : prep. DELF 4,30 4,51 / / / /
Delf/Dalf / / / 4,64 4,80 4,88
Festival 4,41 / 4,63 / / /
Ici 4,40 4,68 / / / /
Panorama
4,37 4,63 (1) 4,69 (2) 4,53 / /
4,57 (2) 4,68 (3)
Rond-point 4,62 4,61 4,50 4,50 / /
Réussir Dalf / / / / 5 4,97
Taxi ! 3,92 4,41 4,70 / / /
Tout va bien !
4,27 4,25(1) 4,78 (2) / / /
4,41 (2) 4,69(3)
[image:11.420.89.334.222.389.2]Total 4,32 4,52 4,64 4,58 4,78 4,91
Table 6: Mean number of letters per word for each textbook and per CEFR level. Textbooks with a possible problem of consistency are highlighted in bold. Numbers in parentheses refer to the textbook volume within the series. Some levels indeed have texts extracted from two different textbooks in the same series.
As regards the second hypothesis, it appears valid formeanNWSandNLMin most cases, although a few textbooks, shown in bold in the tables, diverges from this hypothesis. Some textbooks, such asRond Point A1,Comp. écrite A2, andTout va bien ! B1 (2)stand out as particularly complex at the lexical level, while others – such asRond Point B1,Taxi ! A1,Activités C1, etc. – are remarkable for their weak scores. At the syntactic level, we mainly found work with longer sentences than their level average, among which areComp. écrite A2,Festival B1or
A1 A2 B1 B2 C1 C2
Activités / / 18,2 19,6 18,3 21,9
Alter Ego
8,4 11,5 (1) 14,9 (2) / / /
13,78 (2) 16 (3)
Comp. écrite / 17,1 18,1 / / /
Connexions 10,1 / / / / /
Conn. : prep. DELF 12,9 19,5 / / / /
Delf/Dalf / / / 17 19,1 20,9
Festival 7,8 / 19,9 / / /
Ici 10,4 13,5 / / / /
Panorama
8,6 10,6 (1) 13,5(2) 16,5 / /
12,4 (2) 16,3 (3)
Rond-point 11,8 15,2 14,8 19,7 / /
Réussir Dalf / / / / 21,4 21,7
Taxi ! 7,6 15,2 16 / / /
Tout va bien !
9,9 19,4(1) 17,5 (2) / / /
13,9(2) 18,3 (3)
[image:12.420.85.338.39.206.2]Total 9,1 14,54 16,85 18,6 19,36 21,43
Table 7: Mean number of words per sentence for each textbook and per CEFR level. Textbooks with a possible problem of consistency are highlighted in bold.
conform to the average.
Finally, the progression within series may also be also problematic. This is the case for two series:Comp. écriteand, especially,Rond Point. This observation can be explained by some characteristics of this last series: (1) it is intended for false beginners and therefore quickly progresses in the learning process; (2) the learning process is based on tasks and operates in spiral. The learner is thus quickly brought into contact with more complex forms, which are however not comprehensively studied. As a result, the texts encountered at the initial stages are more difficult than in other textbooks, but the lexical complexity later hardly increase, probably because this is the difficulty of the task to be performed by the learners that rather increases.
To conclude, the qualitative analysis raised strong clues showing that the homogeneity of our corpus is questionable. The nearly “flat” profiles ofCompréhension écriteandRond Pointare particularly of concern. However, globally, most of the series respect the ascending profile requested by hypothesis (1) and presents a coherent progression within the same series i accordance with hypothesis (3). It should also be reminded that our predictors are not perfectly correlated with text difficulty and only approach it from a unique point of view although it is actually a very complex phenomenon. In the next section, we will further investigate hypothesis (2) with quantitative techniques in order to produce a more clear-cut diagnosis on our corpus homogeneity.
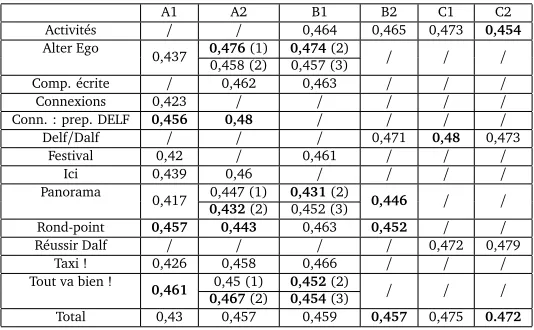
4.2.3 Quantitative analysis
A1 A2 B1 B2 C1 C2
Activités / / 0,464 0,465 0,473 0,454
Alter Ego
0,437 0,476(1) 0,474(2) / / /
0,458 (2) 0,457 (3)
Comp. écrite / 0,462 0,463 / / /
Connexions 0,423 / / / / /
Conn. : prep. DELF 0,456 0,48 / / / /
Delf/Dalf / / / 0,471 0,48 0,473
Festival 0,42 / 0,461 / / /
Ici 0,439 0,46 / / / /
Panorama
0,417 0,447 (1) 0,431(2) 0,446 / /
0,432(2) 0,452 (3)
Rond-point 0,457 0,443 0,463 0,452 / /
Réussir Dalf / / / / 0,472 0,479
Taxi ! 0,426 0,458 0,466 / / /
Tout va bien !
0,461 0,45 (1) 0,452(2) / / /
0,467(2) 0,454(3)
[image:13.420.77.344.40.205.2]Total 0,43 0,457 0,459 0,457 0,475 0.472
Table 8: Mean number of ideas per text for each textbook and per CEFR level. Textbooks with a possible problem of consistency are highlighted in bold.
textbook. If this ratio reaches a sufficiently high value (depending on the significance levelα, here 0.05), we must conclude that all texts from a level do not come from the same population, which means that they were not annotated by a coherent set of experts.
Before the ANOVA analysis, we checked whether the distributions ofmeanNWSandNLMby textbooks are normally distributed and whether their distributions by level have an homoscedas-tic variance. These are the two main conditions required to apply ANOVA to a dataset. We respectively used the Shapiro-Wilk (Shapiro and Wilk, 1965) test to check the normality and the Levene test (Brown and Forsythe, 1974) for variance homoscedasticity. Normality was rejected by 27 out of 82 tests7, whereas only 4 levels out of the 12 presented an unequal variance. Since ANOVA can bear to see its conditions violated to a certain extent, we did not deem these results problematic enough to resort to using a non-parametric test such as Kruskal-Wallis.
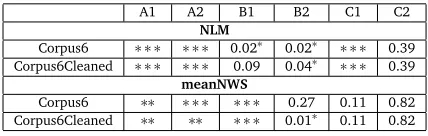
Results of the ANOVA analysis are reported in Table 9. They clearly show that only a few levels appear to be homogeneously labelled: the texts in C2 forNLMand the texts from B2 to C2 for meanNWS. The divergences stressed in the qualitative analysis seem large enough to conclude to the heterogeneity of our corpus. However, it should be mentioned that the ANOVA test is an omnibus test, which means that it is enough that a single textbook deviates from the mean to reject the homogeneity hypothesis. As notified previously, textbook series characterized by specific pedagogical orientation are the most problematic and might be the main cause for rejecting the homogeneity hypothesis. We therefore performed the same ANOVA analysis without the two problematic series:Compréhension écriteandRond Point. Results of these new tests are also reported in Table 9 as Corpus6Cleaned and show some global improvements: B1 becomes homogeneous and B2 is very close to homogeneity, when we considerNLM. For meanNWS, the quality of annotations slightly improves for A1, but decreases for B2. In the whole, the situation remains problematic.
7Interestingly,NLM-based distributions are more normal than those based onmeanNWS, with only 5 tests rejecting
A1 A2 B1 B2 C1 C2
NLM
Corpus6 ∗ ∗ ∗ ∗ ∗ ∗ 0.02∗ 0.02∗ ∗ ∗ ∗ 0.39
Corpus6Cleaned ∗ ∗ ∗ ∗ ∗ ∗ 0.09 0.04∗ ∗ ∗ ∗ 0.39
meanNWS
Corpus6 ∗∗ ∗ ∗ ∗ ∗ ∗ ∗ 0.27 0.11 0.82
[image:14.420.103.317.40.108.2]Corpus6Cleaned ∗∗ ∗∗ ∗ ∗ ∗ 0.01∗ 0.11 0.82
Table 9: P-value for each ANOVA tests. A value inferior to 0.05 means that the homogeneity hypothesis has been rejected for this level. Significance level are noted as follows: p<0.001: ∗ ∗ ∗;p<0.01:∗∗etp<0.05:∗.
The ANOVA tests the homogeneity through a unique predictor, whereas we noticed that some textbooks deviate from their level average for one predictor, but not for the other (e.g. Tout va bien ! A2). This limited point of view could have as a result to intensify the seemingly heterogeneity of the corpus. We therefore applied a multivariate version of the ANOVA, the MANOVA (Lewis-Beck, 1993, 340-368). The results are however very similar to those of the ANOVA: the only homogeneous level is C2 (p=0.69); B2 is already considered as heterogeneous, although only slightly (p=0.02); the other four levels are clearly heterogeneous, with p-values lower than 0.001. This is a rather expected finding, as the MANOVA is even stricter than the ANOVA, requiring all textbook means forNLMANDmeanNWSto be similar.
5
Conclusion
This paper focused on a very often overlooked issue in the modern readability literature based on complex machine learning algorithm and trained on texts from educational resources: the coherence of the annotations. Indeed, when one collects a large corpus of texts previously annotated – which means that he/she cannot control the annotation process –, it is very likely that the various experts involved in the educational material creation apply incoherent criteria. This issue was confirmed by the results of van Oosten et al. (2011)’s experiment with real judges. Interestingly, when researchers in readability use real experts, they are more prone to question the reliability of their annotation, applying, for instance, standard inter-annotators agreement metrics. On the contrary, the quality of a corpus largely used in the field such as the Weekly Reader has been hardly questioned. Feng et al. (2010) computed the mean number of words per documents and per sentences and showed a clear progression as the levels increases. However, it is generally agreed in the community that the annotations are coherent, even though not much is known on the text calibrating criteria. Deeming that this question is crucial, we have investigated it, taking advantage of the fact that our corpus is based on textbooks. Each textbook is indeed designed by a well-identified team. It is therefore possible to consider each of them as a kind of “cluster” in the sense of van Oosten et al. (2011). We therefore suggested an alternate methodology to assess the quality of the annotations in a textbook-based readability corpus.
lower level texts collected could not be used. For future attempts, we suggest starting collecting C2 texts and, afterwards, gather an equivalent number of texts for the lower levels. Finally, we also identified that some types of pedagogical approaches – in our case, the task-oriented approach – are more prone to include heterogeneous materials than textbooks based on a more communicative approach.
Future work regarding the collection and annotation of texts for readability could explore various paths. First, it would be interesting to compare another corpus for FFL, but including only texts intended to a public with a specific L1. This would allow to assess to which extent the L1 impacts the readability of texts for this population. Another interesting experiment would be to compare the textbook annotations with other criteria either classic ones such as those presented at Section 2, or more recent ones, such as eye-tracking or annotations by the crowd (van Oosten and Hoste, 2011). Such comparison would help to be more informed about the validity of the current practice of collecting texts in textbooks or readers.
Acknowledgments
References
Agresti, A. (2002).Categorical Data Analysis. 2nd edition. Wiley-Interscience, New York.
Al-Khalifa, S. and Al-Ajlan, A. (2010). Automatic readability measurements of the arabic text: An exploratory study. 35(2C).
Alderson, J. (2007). The cefr and the need for more research.The Modern Language Journal, 91(4):659–663.
Antoniadis, G., Echinard, S., Kraif, O., Lebarbé, T., and Ponton, C. (2005). Modélisation de l’intégration de ressources TAL pour l’apprentissage des langues : la plateforme MIRTO.
Apprentissage des langues et systèmes d’information et de communication (ALSIC), 8(1):65–79.
Aquino, M., Mosberg, L., and Sharron, M. (1969). Reading comprehension difficulty as a function of content area and linguistic complexity.The Journal of Experimental Educational, 37(4):1–4.
Björnsson, C. (1983). Readability of newspapers in 11 languages.Reading Research Quarterly, 18(4):480–497.
Bormuth, J. (1969).Development of Readability Analysis. Technical report, Projet n°7-0052, U.S. Office of Education, Bureau of Research, Department of Health, Education and Welfare, Washington, DC.
Brown, C., Snodgrass, T., Kemper, S., Herman, R., and Covington, M. (2008). Automatic measurement of propositional idea density from part-of-speech tagging. Behavior research methods, 40(2):540–545.
Brown, J. (1952). The Flesch Formula ’Through the Looking Glass’.College English, 13(7):393– 394.
Brown, J., Frishkoff, G., and Eskenazi, M. (2005). Automatic question generation for vocabu-lary assessment. InProceedings of the conference on Human Language Technology and Empirical Methods in Natural Language Processing, pages 819–826, Vancouver, Canada.
Brown, M. and Forsythe, A. (1974). Robust tests for the equality of variances.Journal of the American Statistical Association, 69(346):364–367.
Carver, R. (1974). Improving Reading Comprehension: Measuring Readability. Technical report, Final Report, Contract No. N00014-72-C0240. American Institues for Research in the Behavioral Sciences, Silver Spring, Maryland.
Caylor, J., Sticht, T., Fox, L., and Ford, J. (1973). Methodologies for Determining Reading Requirements of Military Occupational Specialties. Technical report, Projet n°73-5, Human Resources Research Organization, Alexandria, VA.
Chen, C.-Y., Liou, H.-C., and Chang, J. S. (2006). Fast: an automatic generation system for grammar tests. InProceedings of the COLING/ACL on Interactive presentation sessions, pages 1–4.
Coniam, D. (1997). A preliminary inquiry into using corpus word frequency data in the automatic generation of English language cloze tests.Calico Journal, 14:15–34.
Council of Europe (2001).Common European Framework of Reference for Languages: Learning, Teaching, Assessment. Press Syndicate of the University of Cambridge.
Dale, E. and Chall, J. (1948). A formula for predicting readability. Educational research bulletin, 27(1):11–28.
Dale, E. and Tyler, R. (1934). A study of the factors influencing the difficulty of reading materials for adults of limited reading ability.The Library Quarterly, 4:384–412.
Dascalu, M. (2014). Readerbench (2)-individual assessment through reading strategies and textual complexity. InAnalyzing Discourse and Text Complexity for Learning and Collaborating, pages 161–188. Springer.
de Landsheere, G. (1978). Le test de closure : mesure de la lisibilité et de la compréhension. Nathan, Paris.
Desmet, P. (2006). L’enseignement/apprentissage des langues à l’ère du numérique: tendances récentes et défis.Revue française de linguistique appliquée, 11(1):119–138.
Feng, L., Elhadad, N., and Huenerfauth, M. (2009). Cognitively motivated features for readability assessment. InProceedings of the 12th Conference of the European Chapter of the Association for Computational Linguistics, pages 229–237.
Feng, L., Jansche, M., Huenerfauth, M., and Elhadad, N. (2010). A Comparison of Features for Automatic Readability Assessment. InCOLING 2010: Poster Volume, pages 276–284.
Ferrand, L. (2007).Psychologie cognitive de la lecture. De Boeck, Bruxelles.
Flesch, R. (1948). A new readability yardstick.Journal of Applied Psychology, 32(3):221–233.
François, T. (2009). Combining a statistical language model with logistic regression to predict the lexical and syntactic difficulty of texts for FFL. InProceedings of the 12th Conference of the EACL : Student Research Workshop, pages 19–27.
François, T. (2011).Les apports du traitement automatique du langage à la lisibilité du français langue étrangère. PhD thesis, Université Catholique de Louvain. Thesis Supervisors : Cédrick Fairon and Anne Catherine Simon.
François, T., Brouwers, L., Naets, H., and Fairon, C. (2014). AMesure: une formule de lisibilité pour les textes administratifs. InActes de la 21e Conférence sur le Traitement automatique des Langues Naturelles (TALN 2014).
François, T. and Fairon, C. (2012). An ”AI readability” formula for French as a foreign language. InProceedings of the 2012 Conference on Empirical Methods in Natural Language Processing (EMNLP 2012), pages 466–477.
Gunning, R. (1952).The technique of clear writing. McGraw-Hill, New York.
Heilman, M., Collins-Thompson, K., Callan, J., and Eskenazi, M. (2007). Combining lexical and grammatical features to improve readability measures for first and second language texts. InProceedings of NAACL HLT, pages 460–467.
Hosmer, D. and Lemeshow, S. (1989).Applied Logistic Regression. Wiley, New York.
Howell, D. (2008). Méthodes statistiques en sciences humaines, 6ème édition. De Boeck, Bruxelles.
Jongsma, E. (1969).The cloze procedure: a survey of the research. Technical report, Indiana University, Bloomington. School of Education.
Just, M. and Carpenter, P. (1980). A theory of reading: From eye fixations to comprehension.
Psychological review, 87(4):329–354.
Kincaid, J., Fishburne, R., Rodgers, R., and Chissom, B. (1975).Derivation of new readability formulas for navy enlisted personnel. Technical report, n°8-75, Research Branch Report.
Kintsch, W., Kozminsky, E., Streby, W., McKoon, G., and Keenan, J. (1975). Comprehension and recall of text as a function of content variables1. Journal of Verbal Learning and Verbal Behavior, 14(2):196–214.
Klenner, M. and Visser, H. (2003). What exactly is wrong and why? tutorial dialogue for intelligent call systems.Linguistik online, 17(5/03):57–80.
Lee, H., Gambette, P., Maillé, E., and Thuillier, C. (2010). Densidées: calcul automatique de la densité des idées dans un corpus oral. InActes de la douxième Rencontre des Étudiants Chercheurs en Informatique pour le Traitement Automatique des langues (RECITAL).
Lewis-Beck, M. (1993).Experimental Design and Methods, volume 3 ofInternational Handbooks of Quantitative Applications in the Social Sciences. Sage Publications, Singapore.
Little, D. (2006). The common european framework of reference for languages: Content, purpose, origin, reception and impact.Language Teaching, 39(3):167–190.
Lively, B. and Pressey, S. (1923). A method for measuring the “vocabulary burden” of textbooks.
Educational Administration and Supervision, 9:389–398.
Lorge, I. (1944). Predicting readability.the Teachers College Record, 45(6):404–419.
Meurers, D., Ziai, R., Amaral, L., Boyd, A., Dimitrov, A., Metcalf, V., and Ott, N. (2010). Enhancing authentic web pages for language learners. InProceedings of the NAACL HLT 2010 Fifth Workshop on Innovative Use of NLP for Building Educational Applications, pages 10–18. Association for Computational Linguistics.
Miller, G. and Coleman, E. (1967). A set of thirty-six prose passages calibrated for complexity.
Journal of Verbal Learning and Verbal Behavior, 6(6):851–854.
Nerbonne, J. (2003). Computer-assisted language learning and natural language processing. In Mitkov, R., editor,Handbook of computational linguistics. Oxford University Press.
Oller, J. (1972). Assessing competence in ESL: reading.TESOL Quarterly, 6(4):313–323.
Pilán, I., Volodina, E., and Johansson, R. (2013). Automatic selection of suitable sentences for language learning exercises. In20 Years of EUROCALL: Learning from the Past, Looking to the Future: 2013 EUROCALL Conference Proceedings, pages 218–225.
Pilán, I., Volodina, E., and Johansson, R. (2014). Rule-based and machine learning approaches for second language sentence-level readability. InProceedings of the Ninth Workshop on Innovative Use of NLP for Building Educational Applications, pages 174–184.
Richaudeau, F. (1974). 6 phrases, 200 sujets, 42 lapsus, 1 rêve.Communication et langages, 23(1):5–24.
Schwarm, S. and Ostendorf, M. (2005). Reading level assessment using support vector machines and statistical language models.Proceedings of the 43rd Annual Meeting on Association for Computational Linguistics, pages 523–530.
Selva, T. (2002). Génération automatique d’exercices contextuels de vocabulaire. InActes de TALN 2002, pages 185–194.
Shanahan, T., Kamil, M., and Tobin, A. (1982). Cloze as a measure of intersentential compre-hension.Reading Research Quarterly, 17(2):229–255.
Shapiro, S. and Wilk, M. (1965). An analysis of variance test for normality (complete samples).
Biometrika, 52(3-4):591–611.
Si, L. and Callan, J. (2001). A statistical model for scientific readability. InProceedings of the Tenth International Conference on Information and Knowledge Management, pages 574–576. ACM New York, NY, USA.
Singer, H. (1975). The seer technique: A non-computational procedure for quickly estimating readability level.Journal of Literacy Research, 7(3):255–267.
Smith, S., Kilgarriff, A., Sommers, S., Wen-liang, G., and Guang-Zhong, W. (2009). Automatic cloze generation for english proficiency testing. InProceedings of LTTC conference.
Snowdon, D., Kemper, S., Mortimer, J., Greiner, L., Wekstein, D., and Markesbery, W. (1996). Linguistic ability in early life and cognitive function and Alzheimer’s disease in late life.Journal of the American Medical Association, 275(7):528–532.
Spache, G. (1953). A new readability formula for primary-grade reading materials. The Elementary School Journal, 53(7):410–413.
Tanaka-Ishii, K., Tezuka, S., and Terada, H. (2010). Sorting texts by readability.Computational Linguistics, 36(2):203–227.
Taylor, W. (1953). Cloze procedure: A new tool for measuring readability.Journalism quarterly, 30(4):415–433.
Todirascu, A., François, T., Gala, N., Fairon, C., Ligozat, A.-L., and Bernhard, D. (2013). Coherence and cohesion for the assessment of text readability.Natural Language Processing and Cognitive Science, pages 11–19.
Tufféry, S. (2007).Data mining et statistique décisionnelle l’intelligence des données. Éd. Technip, Paris.
Vajjala, S. and Meurers, D. (2012). On improving the accuracy of readability classification using insights from second language acquisition. InProceedings of the Seventh Workshop on Building Educational Applications Using NLP, pages 163–173.
van Oosten, P. and Hoste, V. (2011). Readability Annotation: Replacing the Expert by the Crowd. InSixth Workshop on Innovative Use of NLP for Building Educational Applications.
van Oosten, P., Hoste, V., and Tanghe, D. (2011). A posteriori agreement as a quality measure for readability prediction systems. In Gelbukh, A., editor, Computational Linguistics and Intelligent Text Processing, volume 6609 ofLecture Notes in Computer Science, pages 424–435. Springer, Berlin/Heidelberg.