1
Computer Science
Code instrumentation with
Mod-BEAM
Roman Rinke Armando Wiedijk MSc. Thesis
July 18, 2019
External Supervisor: prof.dr. C. Bockisch Faculty of Mathematics and Computer Science Philipps University of Marburg 35037 Marburg
Germany
Abstract
There are various methods and techniques for a developer to keep their code read-able and reusread-able. Design patterns have become important in modern development in order to realise this. There exists code, however, that you would not want in pro-duction. An example of this would be code that is generated by instrumentation tools. Tools might want to generate code to help create performance benchmarks, or to analyse the code-coverage of your test-cases. ”Code instrumentation” is a term commonly used to describe the task of adding such generated code. What we focus on in this thesis is code-instrumentation for Java projects.
When a Java file is compiled, the compiler outputs a .class file with the low-level instructions that the Java Virtual Machine can execute. Java code instrumentation can be performed on the actual source-code (before compiling) or on the bytecode itself (after compiling). Multiple frameworks that allow for Java bytecode instrumen-tation. Some of these frameworks are a bit dated, but they all share the common interest to allow for easy, fast and maintainable bytecode manipulation.
From the hypothesis that existing tools that make use of bytecode instrumenta-tion have potential overlap, the tool ”Mod-BEAM” is introduced. Mod-BEAM is a new framework that makes use of model-driven engineering to convert any Java class into a clean, modifiable model representation of the original bytecode. Mod-BEAM stands for ”Modular Bytecode Engineering and Analysis with Models”.
When working with model-driven engineering, there exists the concept of a model and a meta-model. In the case of Mod-BEAM, the meta-model is a representation of all possible Java code (from classes to instructions). The model would be an actual class with fields, methods, instructions, etc. What Mod-BEAM does for us is to transform the original Java .class file (containing the bytecode for the com-piler) to the corresponding model that inherits the Java metamodel as defined by Mod-BEAM. This newly generated model can then be transformed using a reusable template through the use of a model-transformation language. This resulting model can then, through Mod-BEAM, be converted back into an executable Java .class file. Summarised, this means that we go from .class to .jbc (bytecode model), then from .jbc to a .jbc with additional instructions. Finally, we go from the modified .jbc back to a .class file, which now has all the modified data in it.
IV ABSTRACT
As part of the problem analysis, we identified tools that perform bytecode in-strumentation. We proceed to identify which tools have a potential overlap in their ”primitive concepts”. Primitive concepts would be concepts such as finding key-points, instrumenting touch-points or inserting probe-points. Along with the identifi-cation of these concepts, we look at how they are implemented and which concepts overlap. From this, three tools came into focus. Those three tools are Cobertura, JaCoCo and AspectJ. The first two perform Code-coverage Analysis, while AspectJ is a tool used for Aspect-oriented Programming. By re-implementing the concepts found in these tools through a model-transformation language in combination with Mod-BEAM, we aim to identify the advantages and disadvantages of this new ap-proach through model-driven engineering.
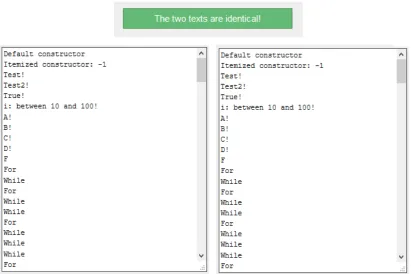
The instrumentation functionality of Cobertura is the first to be re-implemented. The original code is analysed to determine how it works and what the statistics such as the complexity are. The code in our model transformation is proven to have most of the functionality for class instrumentation, producing near-identical results to Cobertura while being far less complex. As the code is concentrated in a single file, it comes at the cost of class quality, however.
The second tool, JaCoCo, was due to the straightforward nature of the origi-nal implementation even easier to re-implement. Similar to Cobertura, results were analysed and the results were more compact and less complex, facilitating higher usability.
The third and last tool, AspectJ, was after some more in-depth research found to have concepts that differed more than expected from the concepts of the Code-coverage Analysis tools. We have provided an analysis of the workings and a dis-cussion on how a model-driven implementation of the weaving process could be created.
Preface
This document is the Master Thesis ”Code Instrumentation with Mod-BEAM”. This document is effectively a thesis continuation of a smaller research, ”A Study on Code Instrumentation Approaches”, performed in the months prior to the creation of this thesis. This thesis has been written to fulfill the graduation criteria of the Computer Science - Software Technology programme at the University of Twente.
I would like to thank Christoph for the help he presented when using Mod-BEAM and the speedy fixes to any issues I encountered. I would also like to thank Ansgar for the clear feedback on the Thesis, and Mehmet for keeping me focused throughout the writing process. Lastly, I would like to thank my family for standing with me and for reminding me not to worry too much. Working with bytecode and the various tools that modify it has greatly deepened my knowledge of what happens under the hood of Java.
Contents
Abstract iii
Preface v
List of acronyms xi
1 Introduction 1
1.1 Background . . . 1
1.2 Research Goal . . . 2
1.3 Report organization . . . 3
I Problem Analysis
5
II Main Research
43
2 Research Goal & Methodology 45 2.1 Motivation . . . 452.1.1 Requirements . . . 46
2.1.2 Research Questions . . . 46
2.2 Research Methodology . . . 48
3 Technical Background 51 3.1 In which aspects can Mod-BEAM be analysed in order to compare it to other approaches? . . . 51
3.1.1 Usability . . . 51
3.1.2 Reusability . . . 54
3.1.3 Code quality . . . 55
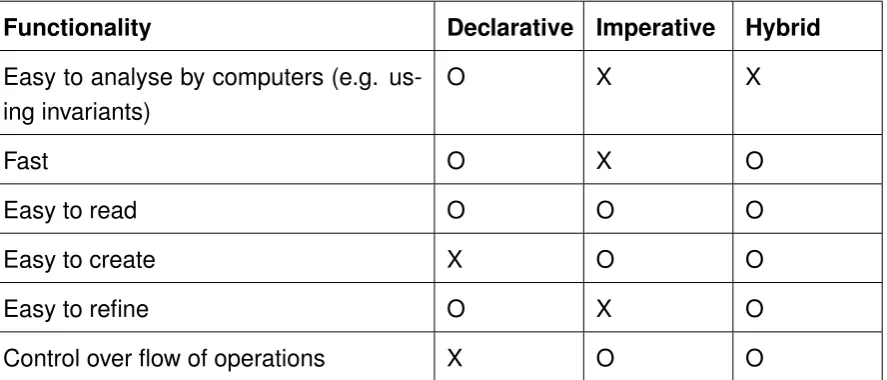
3.2 Model-transformation languages: declarative or imperative? . . . 57
3.2.1 Declarative . . . 57
3.2.2 Imperative . . . 58
3.2.3 Hybrid . . . 58
VIII CONTENTS
3.2.4 Choosing a language . . . 58
3.3 Potential reusability . . . 59
4 First case study: Cobertura 61 4.1 Cobertura . . . 61
4.1.1 Analysis . . . 61
4.1.2 Instrumentation . . . 66
4.1.3 Instructions in detail . . . 67
4.2 Cobertura as model transformation . . . 70
4.2.1 Passes . . . 70
4.2.2 Traversal and control-flow . . . 70
4.2.3 Variable index . . . 72
4.2.4 ID Ordering . . . 72
4.2.5 Code quality . . . 73
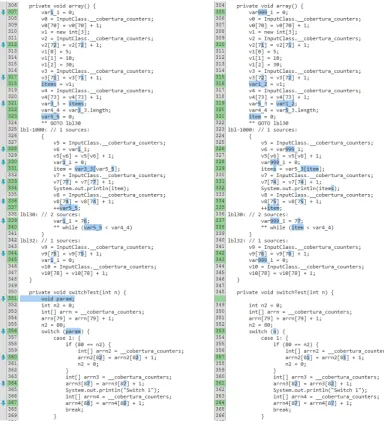
4.3 Assessing functional equality . . . 74
4.4 Migration to Epsilon Transformation Language (ETL) . . . 78
4.5 Reimplementation analysis . . . 80
4.6 Implementation comparison . . . 84
4.7 Conclusion . . . 87
5 Second case study: JaCoCo 89 5.1 JaCoCo . . . 89
5.1.1 Analysis . . . 89
5.1.2 Instrumentation . . . 91
5.2 JaCoCo as model Transformation . . . 94
5.2.1 ID Ordering . . . 94
5.2.2 Instruction rules . . . 94
5.3 Assessing functional equality . . . 96
5.4 Reimplementation analysis . . . 98
5.5 Implementation comparison . . . 99
5.6 Reimplementation comparison: Cobertura and JaCoCo as model trans-formations . . . 102
5.6.1 Reusability . . . 102
5.6.2 Performance . . . 103
5.7 Conclusion . . . 104
6 Hypothetical case study: AspectJ 105 6.1 Analysis of AspectJ . . . 105
6.2 Discussion: reusability . . . 106
CONTENTS IX
6.4 Potential issues . . . 108 6.5 Conclusion . . . 108
7 Conclusion 109
7.1 Conclusions . . . 109 7.2 Future work & Recommendations . . . 112
References 115
Appendices
List of acronyms
AOP Aspect Oriented Programming
CCA Code-coverage analysis
CYC Cyclomatic complexity
ETL Epsilon Transformation Language
LCOM4 Lack of Cohesion Method version 4
LoC Lines of Code
MDE Model-Driven Engineering
NCLoC Non-Commenting Lines of Code
QVTo Query/View/Transformation Operational
Chapter 1
Introduction
This chapter contains the necessary background information, the research goal of this thesis and how the thesis is organized.
1.1 Background
There are various methods and techniques for a developer to keep their code read-able and reusread-able. Design patterns have become important in modern development in order to realise this. There exists code, however, that you would not want in pro-duction. An example of this would be code that is generated by instrumentation tools. Tools might want to generate code to help create performance benchmarks or to analyse the code-coverage of your test-cases. ”Code instrumentation” is a term commonly used to describe the task of adding such generated code. What we focus on in this thesis is code-instrumentation for Java projects.
When a Java file is compiled, the compiler outputs a .class file with the low-level instructions that the Java Virtual Machine can execute. Java code instrumentation can be performed on the actual source-code (before compiling) or on the bytecode itself (after compiling). Multiple frameworks that allow for Java bytecode instrumen-tation. Some of these frameworks are a bit dated, but they all share the common interest to allow for easy, fast and maintainable bytecode manipulation.
In Part I of our research we identify which tools perform bytecode instrumentation and which instrumentation libraries are used for these tools. We also identify which concepts are implemented by these tools and how they are implemented. We do this in order to prepare for a larger research, namely Part II which aims to validate the usability and reusability of a new bytecode instrumentation tool that works through model-driven engineering.
When working with model-driven engineering, there exists the concept of a model and a meta-model. In the case of Mod-BEAM, the meta-model is a representation
2 CHAPTER1. INTRODUCTION
of all possible Java code (from classes to instructions). The model would be an actual class with fields, methods, instructions, etc. What Mod-BEAM does for us is to transform the original Java .class file (containing the bytecode for the com-piler) to the corresponding model that inherits the Java metamodel as defined by Mod-BEAM. This newly generated model can then be transformed using a reusable template through the use of a model-transformation language. This resulting model can then, through Mod-BEAM, be converted back into an executable Java .class file. Summarised, this means that we go from .class to .jbc (bytecode model), then from .jbc to a .jbc with additional instructions. Finally, we go from the modified .jbc back to a .class file, which now has all the modified data in it.
Model-Driven Engineering (MDE) has the advantage that through a single meta-model, any model that is represented by that metamodel can be transformed or reused. This means that in our case, any Java class can be transformed into a modified class through the use of a model-transformation. For a developer, this would mean that model-transformation techniques such as mappings can be used, where, for example, a code instruction of a specific type could always generate a set of inserted followup instructions in a consistent pattern. Mod-BEAM can be seen as complete back-end functionality, while a model-transformation has the concrete implementation. Developers would not have to deal with issues that involve the back-end, and should, in theory, be able to focus purely on creating the desired result.
We hypothesize that through the use of Mod-BEAM, we can improve the reusabil-ity or potentially simplify the original implementation of code-instrumentation for a tool. This is because a model-transformation grants more freedom in what we can do while working with a metamodel that is easier to understand than plain bytecode.
1.2 Research Goal
The objective of this assignment is to perform in-depth research on some of the approaches identified in Part I. This includes an overview of the complexity of the investigated concepts, an overview of the redundancy in the various concepts and how they overlap, and a possible solution to exploit reuse to reduce redundancy using Mod-BEAM.
1.3. REPORT ORGANIZATION 3
modify the tool.
The unique contributions of this thesis are: A re-implementation of the core in-strumentation functionality of Cobertura and JaCoCo, a comparison between our reimplementation as model-transformation and the original implementations, a look at the reusability between our implementations and a discussion on a hypothetical implementation of the weaving functionality of AspectJ.
1.3 Report organization
Part I
Problem Analysis
Research Topics
A Study on Code Instrumentation
Approaches
Research Topics | Final
Roman Wiedijk
University of Twente
July 18, 2019
Abstract
Contents
1 Introduction 3
2 Motivation 4
2.1 Problem & Goal . . . 5
2.2 Quality considerations . . . 5
3 Research Questions 6 3.1 Short-term . . . 6
3.1.1 Goal . . . 6
3.1.2 Product . . . 6
3.1.3 Questions . . . 6
3.2 Long-term . . . 7
3.2.1 Goal . . . 7
3.2.2 Product . . . 7
4 Research Method 8 4.1 Methodology . . . 8
4.2 Comparison criteria . . . 8
4.3 Proof of Concept . . . 9
5 Results 10 5.1 Frameworks & Libraries . . . 11
5.1.1 ASM . . . 11
5.1.2 BCEL . . . 12
5.1.3 Javassist . . . 13
5.1.4 Byte Buddy . . . 14
5.2 Identified code-instrumentation approaches for the JVM . . . 15
5.3 Profiling . . . 16
5.3.1 VisualVM . . . 16
5.3.2 Montric . . . 17
5.4 Logging & Tracing . . . 18
5.4.1 BTrace . . . 18
5.4.2 SLF4J . . . 19
5.5 Code-coverage analysis . . . 20
5.5.1 Clover . . . 20
5.5.2 Cobertura . . . 21
5.5.3 JaCoCo . . . 23
5.6 Aspect-oriented programming . . . 24
5.6.1 AspectJ . . . 24
5.6.2 Compose* . . . 25
5.6.3 JAsCo . . . 26
5.7 Other usages . . . 27
5.7.1 Hibernate ORM . . . 27
5.8 Identified overlap . . . 28
5.9 Suitability of MDE for code-instrumentation . . . 30
6 Conclusion 33
7 Future Research 34
1 Introduction
2 Motivation
Java is a popular programming language. Through the usage of JavaC, the Java compiler, Java code can be transformed into native bytecode. This bytecode can then be interpreted and run on the Java Virtual Machine (JVM). While programs grow more complex, people want to make their lives easier by adding more automated functionality to their programs without modifying the original source-code. Such actions might include profiling or the extension of code without modifying the original classes.
Any form of applying metrics or additional information to code will require some form of code instrumentation. Code instrumentation could be used in order to gather analytical data, such as performance metrics (profiling). Profiling is something that is used in a lot of projects nowadays and is something that can be considered mandatory for some projects. Profiling is often implemented by adding instructions to the start and end of methods. As such, there are various forms of profiling and also various implementations on the market. There also exist different ways in which code instrumentation can be performed, such as source instrumentation where the source code is directly instrumented, or byte-code instrumentation for which the generated .class files are instrumented with additional code. Furthermore, code instrumentation can be performed either in a static manner or in a dynamic manner. For static code instrumentation, the code or class files are updated directly and stored on disk, while for dynamic code instrumentation the changes are applied when the files are loaded by the JVM.
While code instrumentation is quite simply the supplementing of the native bytecode with additional instrumentations, code transformation is to allow the (source-)code to be transformed into something else entirely. An example of this would be the transformation of source-code into Abstract Syntax Trees (AST). An AST might be easier to work with or to maintain, but might also be more easy to interpret for tools that focus on analysis or code-coverage. An example would be how Spoon1 allows for its own form of transforming and analysing Java bytecode through the
usage of “processors“, an object type that is a combination of query and analysis code. Code transformation is an example of an imperative way of transforming the original code, e.g. plain Java into another format. Imperative means that the used code knows about the details of the implementation, as opposed to a declarative mark-up.
A more complex action that can be performed on the source code would be something akin to code extension. Code extension could be performed using, for example, Aspect Oriented Program-ming (AOP). AOP allows for the usage of "aspects" which stand separate from actual class objects. These aspects could allow for supplementing code with which you could implement programming concerns that would normally fit into multiple classes or packages, such as security concerns or logging functionality. These aspects can be "weaved" together into the bytecode of the application. Weaving would be another example of code-transformation.
Model-Driven Engineering (MDE) is a fairly recent software development methodology trend. Through the usage of a source metamodel (e.g. Java bytecode), a target metamodel (e.g. Java) and a transformation syntax (e.g. Xtext). The distinction between an imperative and declara-tive transformation becomes important at this point, as there exist transformation languages that support either of those or a mixture of both. Both approaches have their own advantages, with a declarative approach being more "strict" and often easier to analyze, while an imperative approach gives more control on the sequence of the performed transformation. Models that fulfil the spec-ifications of the source metamodel can be transformed into a model that fulfils the specspec-ifications of the target metamodel. By making use of templates, re-usability of the transformation code can be facilitated.
2.1 Problem & Goal
The "problem" for this research is that we have a new framework to with, called Mod-BEAM. Mod-BEAM allows for code-instrumentation through the usage of MDE. A suspected issue with existing code-instrumentation implementations is the lack of reusability, and the high amount of implementations that are extremely similar to that in other tools. We want to see if this new tool is viable to be used in order to increase reusability in existing approaches, but there exists no clear overview of the current state of reusability for the tools that are already available. The goal of this research is to identify and compare the various implementations of code instrumentation and code transformation that make use of the Java Virtual Machine in order to create the aforementioned overview.
In order to do this, we initially have to determine for which purposes code-instrumentation is frequently used. Afterwards, we will need to define which tools make use of code instrumentation and which libraries are used (if any). For the actual implementations, we can determine how it works and which primitive concepts are defined. For each of these tools, we can determine which parts of these primitive concepts are being used. If no external library is used, then that means that the tool has its own implementation and thus its own set of primitive concepts.
Using this new-found information, we will be able to easily compare both the techniques used in these implementations (e.g. what pattern, which technologies) and which primitive concepts have been implemented. For each tool, we will be able to compare which specific concepts were required in order to get the tool to work. Using a proof-of-concept, we will then be able to identify if Mod-BEAM, the new model-driven approach, can be used to substitute for one of the existing implementations / libraries as a valid alternative. As this is only a precursor to a larger research, the focus will lie more on the identification and comparison, while the investigation on the suitability of Mod-BEAM will be kept as a simple Proof of Concept.
2.2 Quality considerations
3 Research Questions
This section separates the concerns of the research into a set of requirements in order to create a clear understanding of what needs to be done. These requirements should be an indicator for the research questions. The requirements are split into short-term requirements for this research (R1-R7), and long-term requirements for a more detailed research (R8-R13). These requirements are then converted into actual research questions. Research questions exist as questions that should cover all the requirements for the appropriate section. Long-term research questions are considered to be future work, and are therefore not covered.
3.1 Short-term
The requirements that can be determined for the short-term (this research) can be separated into a goal requirement (the end goal of this product) and product requirements (the specifics in order to reach this goal). As such, each product requirement is part of the goal requirement.
3.1.1 Goal
R1 The research should create an overview of existing code instrumentation approaches and how they conceptually work, describing overlap in the concepts of these approaches and comparing them to Mod-BEAM. As result, the research should give a clear understanding of the current state of code-instrumentation approaches.
3.1.2 Product
R2 The document should provide an overview of existing code instrumentation approaches R3 The document should provide an overview of tools used for each code instrumentation
ap-proach
R4 The document should provide an overview of libraries used for each code instrumentation tool
R5 The document should provide an overview of the primitive concepts that are implemented by these tools & libraries
R6 The document should provide an overview of how these primitive concepts are implemented by these tools & libraries
R7 The document should identify conceptual overlap in these varying implementations
R8 The document should provide insight of how MDE can be used in terms of code-instrumentation
3.1.3 Questions
The short-term research question to be answered is:
• Which approaches currently exist for code-instrumentation and how do they compare? (R1). The following sub-questions can be answered in order to answer the main research question:
• Which code-instrumentation approaches and implementations exist for the JVM? (R2, R3, R4)
• What technologies and primitive concepts are used in the aforementioned implementations? (R5, R6)
• Is there overlap between these implemented concepts? (R7)
• In which manner is model-driven engineering a suitable approach for code-instrumentation? (R8)
3.2 Long-term
3.2.1 Goal
R9 The research should create an overview of existing code instrumentation approaches and how they work in detail, describing overlap in the implementation of these approaches and researching the viability of Mod-BEAM. As result, this study should give a clear under-standing on existing approaches and implementations, with insight on the advantages and disadvantages of each approach.
3.2.2 Product
R10 The document should provide an overview on the complexity of existing code instrumentation approaches
R11 The document should provide an overview on the redundancy within each code instrumen-tation approach
R12 The document should provide an overview on the redundancy compared to other code in-strumentation approaches
R13 The document should provide possible solutions on resolving redundancy in code instrumen-tation approaches
4 Research Method
In order to answer the questions mentioned in section 3, we defined the research method described in section 4.1. This section will explain how the research is performed and how the various identified techniques are compared with one another.
4.1 Methodology
The main question is "Which approaches currently exist for code-instrumentation and how do they compare?", and the various sub-questions are used in order to lead to an appropriate answer for this question.
The first sub-question: "Which code-instrumentation approaches and implementations exist for the JVM?" is used to determine the existing approaches that will need to be investigated. This will be done by reviewing common approaches and usages of code-instrumentation. The first question aims at identifying all code-instrumentation approaches in order to create a categorized overview of existing approaches, so that actual tools and libraries can be investigated in the second sub-question.
The second sub-question: "What technologies and primitive concepts are used in the afore-mentioned implementations?" aims at identifying usages (tools) and concrete implementations (libraries) in order to identify how the aforementioned approaches were implemented. This part of the research can be performed by looking up instrumentation libraries and checking which tools make use of these libraries, or by looking up tools that make use of some form of instrumentation and then confirming how this instrumentation was implemented. The actual implementation will be researched through the usage of available papers in combination with the original source-code of the tool or library.
The third sub-question: "Is there overlap between these implemented concepts?" aims at de-termining conceptual overlap between the various implementations and techniques. Important to note is that the question is about the conceptual implementation (e.g. technologies used and primitive concepts). This can be researched by mainly looking at the previously answered research questions. More information about the actual comparison can be found in section 4.2.
The fourth and final sub-question: "In which manner is model-driven engineering a suitable approach for code-instrumentation?" pertains to the suitability of model-driven engineering for code-instrumentation approaches. This will be researched by creating a proof-of-concept that will mimic a code-instrumentation approach or implementation using Mod-BEAM.
As a result of answering the various sub-questions, a conclusion can be formed. This conclusion will then be the answer to the main question of this research.
4.2 Comparison criteria
In order to compare the various implementations of code instrumentation approaches as required for the sub-question "Is there overlap between these implemented concepts" in section 3.1.3, a set of criteria is defined. These criteria can be performed for two separate instances, namely:
• Overlap in primitive concepts for the same code-instrumentation approach
• Overlap in techniques used for different usages of code-instrumentation (e.g. ASM visitor pattern for profiling compared to code-coverage)
For each of these items, the following points can be answered in order to deduce conceptual overlap:
• Is there overlap in techniques and concepts used?
4.3 Proof of Concept
5 Results
This section contains the result of the research questions as defined in section 3. The answers have been concluded using the research method as defined in section 4. The results section starts off by explaining a set of frequently used frameworks and libraries for code-instrumentation. These frameworks can be considered to be required knowledge on what most tools use in order to function. It is important to keep in mind that there are tools that choose to implement their own form of code-instrumentation. If this is the case, then it will be mentioned in the information for the tool itself. More information on the most commonly used frameworks can be found in section 5.1.
Section 5.2 proceeds by explaining the various usage scenarios for which code-instrumentation is often performed. These scenarios serve to answer the first part of the first subquestion, namely listing the approaches for "Which code-instrumentation approaches and implementations exist for the JVM?". For each of these approaches, a set of concrete implementations have been listed. These can be found in sections 5.3 to 5.7. The list is as-complete-as-possible, containing various frequently used tools. While this list contains most of the important entries that have been found, it remains nigh impossible to complete. This is because there are thousands of entries for the most used libraries that implement code-instrumentation. An example would be how ASM(5.1.1) is used by 1,126 artifacts at the time of writing, while Javassist is used by 1,886 artifacts according to the Maven Repository. Some of the more popular artifacts have been picked out, and special attention has been given to the implementations of tools that handle code-coverage and language extensions, such as aspect-oriented programming, as these approaches are both complex and frequently used. Each of these tools have a detailed description of what they use instrumentation for, and how they achieve this goal. This serves to answer subquestion 2, namely "What technologies and primitive concepts are used in the aforementioned implementations?". The primitive concepts would ideally be a listing of the most basic actions that are required in order for each tool to work as intended with regards to instrumenting or transforming code.
5.1 Frameworks & Libraries
This section contains some of the most-frequently seen code-instrumentation frameworks. Each framework has a simplified explanation on how they work and what they are able to do.
5.1.1 ASM
ASM2 is "an all purpose Java bytecode manipulation and analysis" framework. Similar to other
Java bytecode frameworks, it can be used in order to directly modify existing classes or to dy-namically generate classes in binary form. The library can also be used to allow for complex transformations and the building of custom code analysis tools. ASM is used by Cobertura (5.5.2) and Jacoco (5.5.3) to instrument classes in order to measure code coverage.
ASM provides an event-based API (often referred to as the visitor API because of similarities to the visitor pattern) and a tree-based API in order to actually perform the transformations. While ASM is similar to other Java byte-code frameworks, ASM makes it a clear statement that the focus of the project lies in performance.
The visitor API from ASM declares functionality based on the type of event that is visited. These actions in the visitor pattern can be extended, so that additional actions may be performed. Most of the functionality is performed using the ClassReader.accept() function, which makes use of an (extended) ClassVisitor instance. The list below shows an example overview of the various functions that are provided by ASM.
Concept Implementation Call
Find the class declaration ClassVisitor.visit ClassReader.accept line 524 Find methods ClassVisitor.visitMethod ClassReader.readMethod 1112 Find annotations MethodVisitor.visitAnnotation ClassReader.readMethod 1175
(visible), 1193 (invisible) Find fields MethodVisitor.visitFieldInsn ClassReader.readCode 2205
Find labels MethodVisitor.visitLabel ClassReader.readCode 2318
Find a specific line MethodVisitor.visitLineNumber Only used for labels, traces or manual calls
Find code-jumps (if-else, switch
statement, etc) MethodVisitor.visitJumpInsn and sim-ilar instructions ClassReader.readCode 2040+ Find the end of the method MethodVisitor.visitEnd classReader.readMethod 1279 Find the end of the class ClassVisitor.visitEnd classReader.accept 683
Table 1: Concept summary of ASM
Each of the mentioned classes have a corresponding writer variant, which contains the func-tionality in order to actually write the data from the aforementioned visitors.
5.1.2 BCEL
The Byte Code Engineering Library3 (BCEL) is a library that provides functionality to analyse,
create and manipulate (binary) Java .class files. Used by AspectJ (5.6.1) among others.
For the sake of reading in a class, BCEL has a Repository class that allows the developer to look up JavaClass objects. Every retrieved class has an array of iterable methods, which in turn have an array of iterable code. Analysing and instrumenting code is generally done through a visitor pattern. Noticeable of BCEL is that the API of BCEL is extremely low-level, and requires the developer to work with it as such.
During class-loading, the implementation of BCEL itself is triggered by a "JavaWrapper", which in turn creates a "ClassLoader". The ClassLoader has a "ClassLoaderRepository" which is responsible for returning loaded classes as "JavaClass" objects. The JavaClass essentially contains all the data that a Java .class file would have. A JavaClass object is created from a class-file through the usage of a "ClassParser", which reads the following data:
• Header info
• Constant pool, class information and interface information • Fields, methods and attributes
BCEL allows the developer to set up a set of required tools before instrumentation can be performed. These tools include classes such as the InstructionFactory and InstructionList. The instructions for BCEL need to be performed in such a manner that it feels more similar to writing in assembler rather than working with a Java object. Similar to other bytecode libraries, this functionality requires the knowledge of all possible instructions and flags. Instructions that are supplied to the factory make use of ClassGen, MethodGen and similar counterparts in order to provide the necessary data in an ordered manner.
5.1.3 Javassist
Javassist4 or Java Programming Assistant, is a Java bytecode manipulation framework. The
manipulation of the code is performed at load-time, through a provided class-loader. Javassist has the functionality to perform bytecode manipulation at source-level or on bytecode-level, and is used by Hibernate (5.7.1), SLF4J (5.4.2) amongst others (such as Montric 5.3.2).
Javassist makes use of a "CtClass" (compile-time class) in order to both read existing code and in order to write new instrumentations. Each CtClass is registered to a "ClassPool" container object, so that all instrumentation can be generated at compile-time. CtClass makes use of a "ClassLoader" in order to actually perform the in-depth instrumentation loading of an existing class. By extending this ClassLoader and passing the modified version, extended behaviour can be defined.
Methods can similarly be defined through the usage of the "CtMethod" class. Calls to obtain a method can be performed on the class which should contain a method, throwing an exception if the method could not be found. Furthermore, Javassist has the functionality to create new objects by calling the respective static classes of the desired item. An example would be how a new CtMethod can be defined making use of the static functions of "CtNewMethod". CtNewClass is an exception to this behaviour and does not contain static functions, which allows it to be an actual object so that it can be written as a proper file.
Upon finally writing a .class to disk, the toByteCode function is executed (which is inherited and extended for each CtNewClass). The behaviour of this function differs depending on the existence of a constructor in order to properly handle super classes.
The bytecode functionality of Javassist is slightly more underwater, but necessary in order to function. Functionality that is supported includes objects such as StackMaps in order to verify the produced Bytecode, information on how to read in bytecode, constants and variables and functionality in order to handle annotations amongst others. This functionality is called upon obtaining class from the ClassPool, to analyse the validity of the bytecode and to generate new instructions.
5.1.4 Byte Buddy
Byte Buddy5 is a code generation and manipulation library for the creation and manipulation of
Java classes during runtime without the help of a compiler.
Interestingly, Byte Buddy makes use of the visitor API from ASM in order to provide their runtime code generation. Similar to other libraries, Byte Buddy is able to create new classes and redefine existing classes. This is done using a ByteBuddyAgent to perform reloading into an existing JVM, while the ByteBuddy class contains most logic that handles defining and redefining classes. Byte Buddy is used by Hibernate ORM 5.7.1 and is a fairly recent tool with increasing popularity6. Byte Buddy aims at making the code "concise and easy to understand". Instead of
having to work with a ClassPool or CtClass objects, Byte Buddy works through a straightforward API (from a user-perspective) with the functionality to create a ByteBuddy object, redefine a class or method and then proceeding to write and reload the new object.
5http://bytebuddy.net/
5.2 Identified code-instrumentation approaches for the JVM
This section explains common usages of code-instrumentation and what they are. In order to inves-tigate the implementations, techniques and technologies used with code-instrumentation, we first have to identify for what purposes code-instrumentation is performed. The identified approaches are as follows:
• Profiling: Profiling is a form of code analysis that is used to measure aspects of the software. Through the use of profiling, aspects such as time between actions, the frequency of actions or the complexity of code can be measured. Profiling requires the execution of code in order to work, as additional profiling code is injected into the code (either the source-code or bytecode). Object-size estimation & Memory Analysis can also be considered to be possible using instrumentation, but both are often included in profiling tools in the modern day. Object size calculation can be performed to calculate the size of objects that are currently active in the JVM. This can be used to, for example, debug memory leaks or find memory bottlenecks in the application. Memory analysis is performed in order to check the current memory usage of an application. Standalone tools often create a snapshot of the current memory status without using instrumentation, such as the Eclipse Memory Analyzer7.
• Logging & Tracing: Through program logs, more information can be gathered about the executing software. Software tracing is slightly different than profiling, as it allows for paths through the code to be logged. Software traces are very similar to logging, and both forms are often used as a form of program debugging.
• Code-coverage analysis: Slightly more complex is the analysis of code-coverage. This is done by looking at testing frameworks and mapping them to the actual functions in the source code. The coverage requires information on what functions there are, what functions are being tested and especially which code inside each function is actually reached during the tests.
• Dynamic code-analysis: Code-analysis is as the name implies the analysis of an entire pro-gram. More complex actions for code-analysis might include null-pointer dereferencing. Tools that are able to analyse entire programs without producing false-negatives or false-positives are popular and often used as a part of a development stack. Different from static code analysis where the analysis is performed without executing the code, dynamic code analysis requires the execution of the program in order to function. Dedicated code-analysis tools will not be covered in this research, as static tools have been researched before. I was unable to find dynamic code-analysis tools for Java applications that were suitable for research.
• Aspect-oriented programming: Aspect-oriented programming and other language extensions stand out as they are different from other common uses of code-instrumentation. Aspect-oriented programming uses the concept "aspects" in order to generate modular code without changing the original code. This code is then "weaved" in the bytecode in order to create a runnable application.
• Language extensions: Besides conventional Java usage, frameworks and the likes have been created in order to allow for extensions on the Java language.
5.3 Profiling
This section lists tools that are able to perform profiling using code-instrumentation.
5.3.1 VisualVM
VisualVM8is a popular profiling tool for Java applications that includes the functionality to create
an accurate overview of CPU usage per function and memory usage amongst others. The tool makes use of instrumentation for various parts of the functionality that the tool provides. The actual instrumentation is implemented in a library calledJFluid[2], which was developed as part of the NetBeans profiler by Sun Labs9.
An example of how VisualVM makes use of instrumentation would be their CPU statistics dis-play. The visual side of the display is handled in the "CPULivePanel" class in the profiler package. This panel makes use of a "LiveCPUViewUpdater" in order to refresh the results. This updater, in turn, has a JFluid "ProfilerClient", which provides a set of Java profiling functions. Upon update, the method "getCPUProfilingResultsSnapshot()" is called, which literally provides a snapshot of the current profiling results. This function simply reads back data from the instrumentation that was registered before this point.
At start-up, JFluid creates a CPUCallGraphBuilder in order to mark all important points where profiling should be inserted. The "ClassManager" is able to filter these points based on which class they reside in. These classes are then put into a batch that need to be instrumented.
The actual instrumentation is called from the "ProfilerClient". Some basic actions that are re-quired at the start are to load the root class and to load follow-up methods. A "RecursiveMethod-Instrumentor" is then used to collect which data should be instrumented. An "InstrumentMethod-GroupData" class is then called to write the actual instrumentation.
Some key concepts from this that can be found are:
• Parse the code to an internal Java format (performed by JFluid) • Find the root (main) classes (provided by VisualVM)
• Find the root (main) method(s) (implemented in RootMethods.java)
• Find all methods (Implemented by inheritors of AbstractDataFrameProcessor.java)
• Find key-points to be instrumented (CPUCallGraphBuilder.java)
• Instrument the code (performed by JFluid)
It should also be mentioned that the way instrumentation was implemented was very custom-tailored for the scenarios of the multi-threaded JFluid profiler, which very much reduces the read-ability of how the various actions are performed. While the classes of RootMethod and Abstract-DataFrameProcessor are still of manageable size (around 100-200 lines of code), the CPUCall-GraphBuilder alone is about 1500 lines of code. The RecursiveMethodInstrumentor that is used to collect the necessary to-be-instrumented data is about 700 lines of code. Combining this with the client-server architecture and abundance of synchronized methods, this tool would be very time-consuming to analyse in more detail.
8https://visualvm.github.io/
5.3.2 Montric
Montric10, previously also known as EurekaJ, is an open-source Java profiler that is quite far in
development. Similar to other profilers, it contains functionality to monitor CPU- and heap usage, amongst others. Montric is a profiler that makes use of a combination of an Ember client, REST as intermediary and a server written in Java. Due to lack of news in recent years, the project can be considered to be on hiatus, albeit it still has most functionality that one would expect of a profiler. The Montric server makes use of a combination of native Java instrumentation functionality and Javassistin order to obtain the desired results
Instrumentation is performed in the "org.eurekaJ.agent" package, starting with the "Eureka-JTransformer". The "transform" method is the initial called function that starts off the process of redefining a class. Data is read in as a bytestream and transformed into a Javassist "CtClass" object. Additional data is read out during the transformation process in order to generate "ClassIn-strumentationInfo" which contains track of the package name, class name and if the class extends or implements other classes. Montric tries to obtain the uppermost level class to be instrumented in order to check if the implemented interface or abstract classes can be instrumented. Montric then proceeds by going through all declared methods (CtMethod) from the CtClass object, and runs instrumentMethod on each of these methods.
The way that a method is instrumented depends on the type of method. As of the time of writing this report constructors, getters and setters are not yet supported. It can be assumed that these methods would provide an overflow of data or are not properly parsed yet on the client-side of the application. A usual case of instrumentation continues to the "addTiming()" function. This method quite plainly appends timing information to the method that can be used to measure the execution performance.
What stands out from the rest is that the transformer makes use of a loadClassInClassLoader function that adds classes to the loader if this was not done yet. This seems to be an important prerequisite in order to support JEE environments, as is noted in the comments.
Some key concepts from this that can be found are:
• Parse the code to an internal Java format (Javassist)
• Find all methods (visitor pattern)
• Find the highest-level abstraction (ClassInstrumentationInfo)
• Find the lowest-level abstraction (ClassInstrumentationInfo)
• Identify the method type (Javassist)
• Instrument each method on the correct abstraction level (EurekaJTransformer)
5.4 Logging & Tracing
This section lists tools that are able to perform logging and tracing using code-instrumentation.
5.4.1 BTrace
BTrace11 calls itself a "safe, dynamic code tracing tool for Java". BTrace works through the use
of dynamic bytecode instrumentation, inserting traces into an active Java application and then hot-swapping the traced program classes. In order to perform the actual instrumentation, BTrace makes use of theASMbytecode library.
Btrace allows users of the tool to add annotations that define where to add a "probe" into the program. An example would be an interest in the class "java.lang.Thread" and the method "start()", which would add probes for each entry into "Thread.start()". A function can then be defined which specifies what behavior to execute when a Thread.start() has been called. It is notable that BTrace contains a "hacked" version of ASM in their own source-code. This "hacked" version allows for some custom modifications that the creators of BTrace found to be necessary, such as merging instrumentation invocations.
In essence, BTrace works by gathering all the probes that have been defined. These probes are collected in the "runtime" package of the tool. This package also specifies what data should be stored for a probe (in the "OnProbe.java" file) and what the bytecode of the probe should look like (in the "BTraceProbeNode.java" file). The actual injection of the bytecode contains the most expansive class, as the "Instrumentor.java" file contains 1743 lines of code, with most of it defining what to do when a specific OP-code has been encountered. A reason for the expansiveness of this instrumentation could be the support for complete CallGraphs and call traces that come from a specific probe.
The functionality for BTrace can be separated into two parts. The first is weaving instru-mentations into executing code based on the user-defined hook points. The second is to create a callgraph of the hook-points in order to create the logging statistics.
The functionality requirements in order to identify and weave probes can be summarised as follows:
• Find all probe points (BTraceProbe)
• Gather the instructions to execute on probe points (BTraceTransformer)
• Instrument the existing code
The functionality required in order to build call-graphs can be summarised as follows:
• Compute a complete trace-log from each probe point (CallGraph)
• Gather instructions to execute on each action in order to create a trace report
• Instrument the existing code
Similar to tools mentioned before this, BTrace also requires the functionality to read and write the actual bytecode and perform the necessary hot-swapping. All of this is done by extending the functionality of ASM.
5.4.2 SLF4J
SLF4J12 or "Simple Logging Facade for Java"13 is a façade or abstraction of various logging
frameworks, allowing developers to plug a logging framework to their application at the time of deployment. The logger for SLF4j is customizable and allows for easier output to files or custom event handlers. SLF4J makes use of Javassist as an optional compile dependency in order to extend logging to the entire application as opposed to select events14.
The instrumentation in SLF4J is, as expected, extremely simple. This is because the goal is to instrument each method with simple logging information. The actual instrumentation is performed in the "LogTransformer" of the "org.slf4j.instrumentation" package. The logging is added on load-time. In SLF4J, the code transformation is processed in the "transform()" function. This function quite simply calls the "doClass()" function for each available class. A class is then adjusted to contain the appropriate logging information (such as a "logger" instance). For each method (currently only non-empty, defined as "CtBehavior" from the library), the "doMethod()" function is called which adds an action using "method.insertBefore()" and "method.insertAfter()". The data to be added is obtained by retrieving the signature and the return value of the method. No timing information is added, as slf4j is a logger and not a profiler.
Important concepts can thus be summarized as:
• Find class and method information (such as the name)
• Find the start of each method (visitor pattern)
• Find the end of each method (visitor pattern)
• Instrument every method
12https://github.com/qos-ch/slf4j 13https://www.slf4j.org/
5.5 Code-coverage analysis
This section lists tools that are able to perform code-coverage analysis using code-instrumentation.
5.5.1 Clover
Clover15is a tool for Java and Groovy that aims to provide reliable code-coverage analysis. Clover
makes use of source-code instrumentation, meaning that they directly add instrumentations to the source-code. Clover makes use of their own implementation in order to perform these instrumentations.
Clover stores all data retrieved from the project in a database. This database is known as "Clover.db"16 before usage, and is used internally as the "Registry". The registry file is written
during the instrumentation process, and overwritten when a new instrumentation process is exe-cuted. The registry is read by the Clover-instrumented code when it is executed, during report generation or during coverage-browsing (such as through the IDE)17. This database contains the
information about the entire project, including classes and methods. Clover makes use of a set of predefined types listed as a set of "reservedContexts" that identify the various types of reserved names, such as for/while loops or if/else statements among others.
The preparation code for the code-instrumentation that Clover uses starts by gathering miscel-laneous data in order to start the instrumentation process. Such data includes the gathering of the amount of lines and the encoding used. In order to parse files, Clover makes use of JavaLexer and their own filter in order to hide whitespace and comments. This is used in order to parse the code to native Java classes that can be used for instrumentation. After generating the filter, the actual instrumentation is performed. The code-instrumentation makes use of the "CloverToken" class which contains a previous and next token, but also a set of pre- and post-emitters. These emitters are usually existing instructions, lambda expressions, method or exit-points or class entry-or exit-points18.
The primitive concepts of identifying classes and methods are implemented by Clover.db, us-ing their own filter and by parsus-ing the Java code. The instrumentation concepts of identifyus-ing statements and test-methods are then performed using the implemented CloverToken and emitter system. In order to work, Clover has to define the type of each emitter in a token. This can be either a pre- or post-emitter. Each of the emitter types are defined as a class that inherits from "Emitter" itself. Required functionality can be summarised as:
• Parse Java (JavaLexer)
• Create a database that records instrumented functions (Clover.db)
• Find the start of a test method (add pre-emitters)
• Find the end of a test method (add post-emitters)
• Instrument called functions • Instrument the test code
15https://www.atlassian.com/software/clover
16https://confluence.atlassian.com/clover/database-structure-420972456.html
17https://confluence.atlassian.com/clover/managing-the-coverage-database-72253456.html
5.5.2 Cobertura
Cobertura19 is a Java tool that can be used to calculate the amount of code that is covered by
tests. It makes use of offline code instrumentation. Cobertura works by loading in the byte-code of the software in the memory, performing instrumentation on the classes that were supplied. Cobertura makes use ofASMin order to perform the actual instrumentation for the code.
The pipeline of actions of Cobertura can be found in the "Cobertura.java" file. The constructor starts off by creating an empty report, reading in the arguments and creating an instrumentation task, a coverage task and a project data merge task. Of those tasks, code instrumentation is quite obviously handled starting with the CodeInstrumentationTask This task creates a "CoberturaIn-strumenter", preparing it in order to run for each class that was provided in the arguments. Before the actual instrumentation begins, a "ClassPattern" instance is generated in order to setup the required regex settings to check for matching class names. Along with this, more settings are pro-vided for the CoberturaInstrumenter itself by reading in all arguments. The instrumentation itself is called in the various addInstrumentation functions from the CodeInstrumentationTask. There exist various functions that provide different results, depending on whether the output needs to be stored in an archive or not. Instrumentation functions in the CoberturaInstrumenter each make use of an InputStream of the original file. The file is always converted before the actual instrumentation begins.
The comments in the CoberturaInstrumenter mention that a file is instrumented in three dif-ferent passes, as noted below. In each of these three steps, it is noticeable that each of these classes inherit the functionality of the "ClassVisitor" from ASM. This ClassVisitor contains all the functionality to visit practically each possible part of a class, returning the properties that were requested per method. An example would be that the visitMethod function would return the access flags, Opcodes, name, descriptor, signature and exceptions of a method. The base visit function of each class is triggered in the "accept" method of the "ClassReader" class from ASM.
The first pass performed by Cobertura is to make use of the DetectDuplicatedCodeClassVisitor, which is an extension of the ClassVisitor from ASM. It is used in order to detect duplicate code and store the data of where it was found. The class overrides the original visitMethod function from ASM, so that the function first obtains the original method data from the original ClassVisitor, before proceeding to create an instance of the "DetectDuplicatedCodeMethodVisitor" class. This class keeps track of the actual duplicated lines found. It makes use of a "CodeFootStamp" in order to keep track if two lines are identical or not, giving the visit of a footstamp priority, before proceeding to visit a line, label or other item depending on the function called. As an end result, the DetectDuplicatedCodeClassVisitor contains a mapping of line numbers (keys) with the duplicated lineId and origin lineId as values.
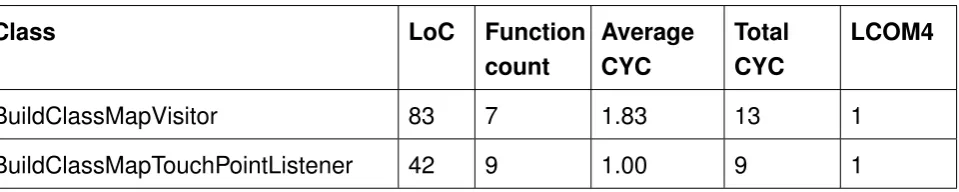
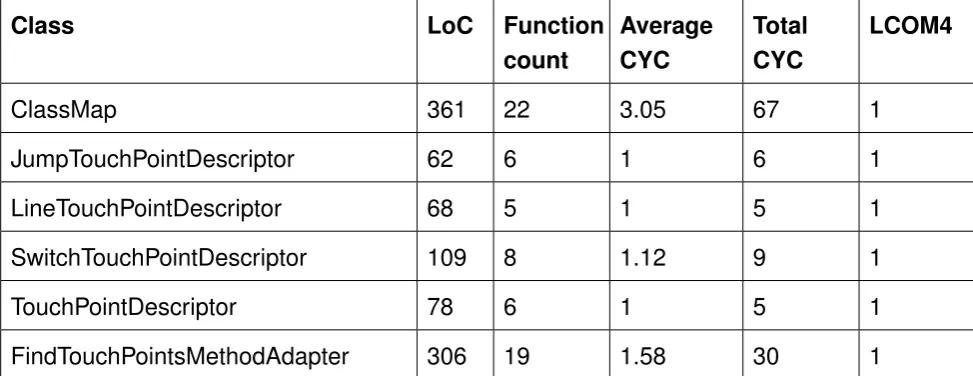
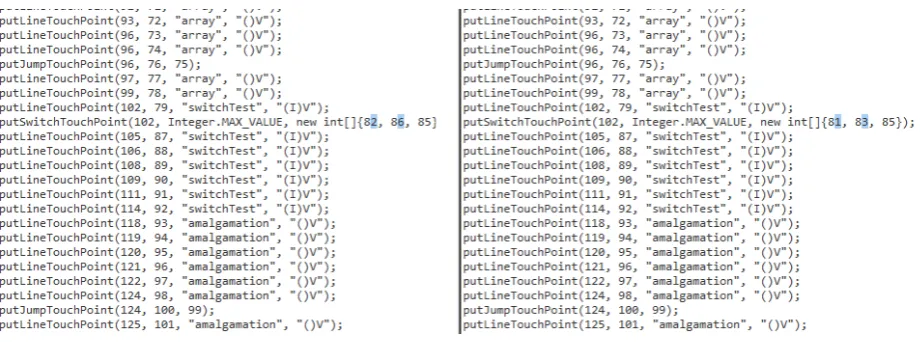
The second pass is the BuildClassMapClassVisitor, which finds all touch-points and other interesting information that are in the classes, and subsequently stores it in a ClassMap. Data that is stored contains the original class name and the original source code of the class. At the stage that the visitMethod function is called, it is checked if the class is yet to be instrumented. If this is the case, then a FindTouchPointsMethodAdapter is created. This adapter analyses a given method, which practically traverses the instructions in a method line by line, jumping when necessary. The goal of this step is to gather "Touch-points", which are points in the source code that Cobertura wants to monitor for usage in the third and final step. Touch points always contain an eventId and a lineNumber, and can contain more data depending on if it is a "JumpTouchPoint", "SwitchTouchPoint" or "LineTouchPoint".
The final step of the various passes performs the "real" instrumentation. It is implemented in the InjectCodeClassInstrumenter, which makes use of the previously generated ClassMap in order instrument the code.
The items below are a summary of the primitive concepts that are used by Cobertura in order to perform code-coverage analysis:
• Parse Java (ASM)
• Find dulicates (DetectDulicatedCodeMethodVisitor)
• Find touch-points (BuildClassMapVisitor and FindTouchPointsMethodAdapter)
5.5.3 JaCoCo
JaCoCo20 is a code-coverage analysis library for Java. It makes use of on-the-fly bytecode
instru-mentation. Similar to Cobertura, JaCoCO makes use ofASMin order to implement instrumenta-tion. The initial step is also similar, as the input classes are first transformed into an InputStream. This is performed in the "Instrumenter" class in the "core" package.
This instrumenter class creates the necessary readers and writers and proceeds by creating a "ProbeArayStrategyFactory". This class will essentially check if the given class is either a Mod-ule/Interface or a normal class. In the case of a normal class, it will create a "ClassFieldProbeAr-rayStrategy".
The generated strategy is used in order to "create a static field to hold the probe array and a static initialization method requesting the probe array from the runtime", this means that it is used in order to properly access and instrument static fields and methods. The instrumenter then proceeds by creating a "ClassVisitor" from ASM in the form of a "ClassProbesAdapter" as written by JaCoCo. This visitor accepts a delegated "ClassInstrumenter" with the previously created strategy.
The "ClassInstrumenter" implements the actions that should be performed upon visit, field visit and method visit and returns an instrumented version of the visited classes. The instrumented classes contain probes as created using a "ProbeInserter" on method visits. These probes are used to add probes into the control flow of a method, so that the code can be marked as executed or not21. In the visitMethod function of a ClassInstrumenter, a new MethodInstrumenter is created in
order to actually visit the various instrumentations of that method. This method is then similarly filled with probes where needed. The ClassProbesAdapter that delegates the visitor is used to calculate probes for each method, and to keep track of the current probeId. These probes can then be used for the code-coverage analysis itself.
It is noticeable that JaCoCo implements the instrumentation using probes by itself, and makes use of the visitor pattern by ASM in order to traverse through the actual code. The table be-low contains all functions that are called from the "classVisitor". JaCoCo defines two method visitors that are called in the overridden visitEnd function from ASM. The first is to eliminate consecutive duplicate frames, making sure that the generated code is actually valid. The second is the probeInserter which actually performs the tracking and inserting of probes. For the "Du-plicateFrameEliminator" The functions are all identical to the original, only setting a boolean for "instruction" to true or false and otherwise acting as a passthrough.
Below is a summary of the concepts that JaCoCO requires in order to perform code-coverage analysis:
• Parse Java (ASM)
• Gather probe points (ClassProbesAdapter)
• Eliminate "consecutive duplicate frames" (DuplicateFrameEliminator)
• Track and insert probes (ProbeInserter / ClassInstrumenter)
20https://www.eclemma.org/jacoco/
5.6 Aspect-oriented programming
This section lists tools that are able to perform aspect-oriented programming using code-instrumentation.
5.6.1 AspectJ
AspectJ22 is an aspect-oriented extension to Java that supports general-purpose aspect-oriented
programming. The goal of AspectJ is to allow for clean modularization of cross-cutting concerns, allowing for both design modularity and source code modularity. AspectJ makes use of their own, extended version of BCEL.
AspectJ allows for modularization through the usage of a Java overlay, namely dynamic join points. These dynamic join points are described as "points in the execution" of Java programs. The additions are pointcuts (selective join points and values at those points), advice (additional actions to take at join points in a pointcut), inter-type declarations ("open classes") and aspects ("a modular unit of crosscutting behavior, comprised of advice, inter-type, pointcut field, con-structor and method declarations"[3]). AspectJ implements these various extensions of the Java programming language by allowing the developer to program the functionality, and then "weaving" the newly added code to the original program.
The AspectJ compiler accepts both sourcecode as well as bytecode, and returns the newly formed bytecode as a result [4]. The compiler has been mentioned to be a 2-stage process. The first stage compiles both AspectJ and pure Java source code into pure Java bytecode annotated with the additions mentioned earlier. The back-end consists of the actual transformations encoded in these attributes in order to produce the final .class files.
As mentioned earlier, AspectJ makes use of their own extended version of BCEL. This is done as the original BCEL is not actively developed anymore and does not intergrate the patches that were made by the AspectJ development team23. As mentioned earlier, the weaving process in
AspectJ makes use of dynamic Join Points. These Join Points contain respective "shadows" in the original sourcecode or bytecode of the application. These static shadows may be of different types, where each shadow represents a location where the new code should be inserted. In the weaving process, each identified shadow is of the type "BcelShadow", which can be found in the "weaving" package. Each shadow has a "Kind", which may be a method, constructor or nearly any other Java type.
The weaving process usually starts in the "WeavingURLClassLoader" in the "weaver.loadtime" package. The classloader proceeds by making a "WeavingAdaptor" from the "weaver.tools" pack-age. This class then creates a "BcelWorld" object and a "BcelWeaver" with the "BcelWorld" as reference. This "BcelWeaver" contains the functionality to find pointCuts, optimize them, detect duplicity and to actually weave them together.
AspectJ also looks for an ASM library in its weaving process in order to add stack map attributes to the produced bytecode. This is done using ASM as BCEL did support this functionality, but is severely dated. Stack maps are used in order to allow for verification of the produced bytecode.
The various concepts of AspectJ can be summarised in the following list:
• Parse into Java code (BCEL adaption) • Gather join points (BcelShadow)
• Weave the new code into existing code (BcelWeaver)
22https://www.eclipse.org/aspectj/
5.6.2 Compose*
Compose*24(Compose-star) is a Java project that mainly focuses on aspect-oriented programming.
The goal of the project is similar to AspectJ, with the aim to "enhance the modularization capabili-ties of component- and object-based programming". The initial goals for the project upon research were to "provide a framework to experiment with new language concepts & features" and to "pro-vide the ability for researhers and practitioners to apply the Composition Filters language"[1]. While Compose* is cross-platform, this research will only take into account the parts that are used for the Java instrumentation process. Compose* has adoptedJavassistin order to provide concise Java instrumentation.
Compose* defines two important concepts in order to perform instrumentation. These concepts are the filtermodule and the superimposition. The filtermodule essentially defines what class or methods should be created and which functionality they provide, while the superimposition defines how this new class should be linked. Superimpositions and filters are essential in order to determine how a HookPoint in a class is defined, as can be found in the "getMethodInterceptions()" function of the "JavaWeaver" class. The actual weaving process is started off in the the "JavaWeaver" class, situated in the "ComposeStar.Java.WEAVER" package. Compose* makes use of instrumentation in order to weave selected hooks at compile-time[5].
As mentioned before, the instrumentation process for weaving is started in the JavaWeaver. The function "run()" is responsible for kicking off this process. At first, a "HookDictionary" is created. These hooks are all the locations where a call to the interpreter should be inserted by the weaver. The HookDictionary contains hooks for method calls and instantiations. The data for this is loaded in using the CommonResources object that is passed through to the function. A "ClassWeaver" is instantiated, and each file contained in the "CommonResources" has their classpath added to this weaver. This process is then continued in the "weave()" function from the "ClassWeaver" class.
The actual weaving process adds the processed class to the resoures file and creates a new directory. It makes use of the CtClass objects from Javassist (5.1.3). The process itself adds all classes-to-weave to a HashSet, after which an initializer class is generated which allows the class to initialize runtime of the class without optimizing it away by a Just-In-Time (JIT) Compiler. Each weaved object is then output to the corresponding file(s).
The weaving process can be summarized as follows:
• Parse into Java code (Javassist)
• Gather hook points (Create a dictionary of hook-points) (Compose*)
• Find all classes and methods (Javassist: ClassPool, CtClass)
• Instrument methods by appending created code (constructors, method initializers) to existing class files (Javassist: CtConstructor)
As Compose* is split up between a multi-language CORE and a Java-specific part, it should be noted that most of the actual code-generation is done at the CORE-level, while the weaving is done at the Java-specific level.
5.6.3 JAsCo
JAsCo25 defines itself as an "advanced aspect-oriented programming language", which was
origi-nally tailored for the component-based field. The official website also mentions that it supports a wide range of established AOP functionalities, such as AspectJ-like pointcuts. JAsCo introduces the concept of "aspect beans" and "connectors" as the main new concepts to work with. A major difference between JAsCo and the other AOP languages mentioned in this research is that JAsCo does not have the code available for study. It is mentioned that the code has been integrated in a tool called PacoSuite, but this tool is at the time of writing severely dated. It is mentioned in one of the original research papers that JAsCo makes use of acombinationof their own bytecode-manipulation library, in combination withBCELto "transform Java byte-code to human readable Jasmin assembler code"[6] (and the other way around).
As mentioned earlier, the idea behind JAsCo is the usage of "aspect beans" and "connectors". An aspect bean defines execution behaviour through the usage of "hooks". The original goal of JAsCo was to make use of these new concepts in order to not only integrate AOP with object-oriented programming, but to also integrate AOP with component-based software development, as it tends to suffer from similar issues. At the time of writing for the official report on JAsCo (2003[6]), JAsCo aimed to resolve the problem of non-reusability of aspects as used in AspectJ, while staying true to the native Java syntax. A hook in JAsCo has a simple syntax, containing a "when" and "what" component, for example to execute on a certain method, and to define extra functionality on the call of that method. A connector can then in turn instantiate an actual hook, or multiple hooks for that matter. Doing so creates some form of control-flow which allows for readable and reusable code.
The various connectors (containing hook instances) would be registered to a Connector registry, and all that would remain at this point would be to actually weave the code together. This could be performed at runtime, allowing for flexible code-changes. It can be assumed that the weaving process would need the following instrumentation functionality from a library in order to support the desired functionality:
• Find all classes and methods
• Gather hooks and connectors
• Allow users to create their own instrumentations in a readable format
• Append created code to code at hook-points
The actual management of hooks and connectors would be handled by JAsCo itself, making use of mentioned tools such as "CompileConnector" (add to classpath), "RemoveConnector" (remove from classpath), "CompileAspect" (compile an aspect to a normal Java bean) and "Introspect" (allows for GUI introspecting which connectors are loaded for a given classpath, and which hooks are instantiated).