77
Predicting the Unpredictable
Predicting surgical case durations and overtime probabilities
to maximise OR-efficiency at Thoraxcentrum Twente
Jasper A. Dute
Master of Health Sciences
Health Services and Management
Faculty Science & Technology
77
Master of Health Sciences
Predicting surgical case durations and overtime probabilities
to maximise OR-efficiency at Thoraxcentrum Twente
Jasper A. Dute
September 2016
University supervisors:
Mevr. C.G.M. (Karin) Groothuis-Oudshoorn, PhD.
Dhr. E.W. (Erwin) Hans, PhD.
External supervisors:
Dhr. J.G. (Jan) Grandjean, MD, PhD.
Dhr. F.R. (Frank) Halfwerk, MSc.
3
Preface
This is the thesis written in the context of the completion of my master’s program Health Sciences at the University of Twente. In the twelve-year long road from VMBO to the University of Twente I have always attempted to work as hard as I could and this has shaped me in the way that I am now. I am very proud of what I have achieved.
This research is performed on behalf of Thorax Centrum Twente (TCT) as a part of Medisch Spectrum Twente (MST) Enschede in the period of February to September of 2016. I am very thankful that I had the opportunity to perform this research in such a highly regarded hospital. MST is the hospital where I have learned the majority of my nursing skills throughout my internships at the cardiology and internal medicine department and my working period at the neurosurgical department. This hospital in particular has drawn my attention due to its pleasant working atmosphere and above all its innovating character. Although the last months have not been a walk in the park, I do consider these months very valuable, informative and interesting. It has been especially interesting to see the hospital from an other perspective than from the work floor as a nurse and meet many interesting people working at this hospital. Many people have been supportive to me in the last months. I would like to thank you all for your support, but some people in particular.
First of all, I would like to thank first external supervisor Jan Grandjean for granting me the opportunity to perform this challenging assignment at TCT and his support. Jan always guarded the project’s applicability for the work floor. This was not always easy for me, but eventually made the research very interesting and satisfying to perform. Second, external supervisor Frank Halfwerk. You were always there for quick tips and question answering. Your enthusiasm in learning new things every day worked very inspiring. Jan and Frank, thanks for your support and sharing your knowledge and expertise with me.
From the part of the University of Twente I would like to thank my first supervisor Karin Groothuis-Oudshoorn for her (statistical) support, her accessibility, her critical view and our motivating conversations to keep me going. This research showed me the gap between statistics courses and practice, but with your guidance I was able to bridge this gap. Thank you, Karin. I would also like to thank my second supervisor Erwin Hans as he always made the time to help me in my research, in and outside his busy schedule. I have enjoyed our occasional talks and was very motivated by your enthusiasm and knowledge in the field of healthcare logistics. Erwin, your teacher of the year award is well deserved in my opinion. Thank you for supervising me.
I would also like to thank Ben Fransen, Ton Dijkhuis, Paul Straalman, Thijs Schopman, Aad de Best,
Rob Damink, Wim Addink, Nicobert Wietsma, Wytze Vermeijden, Evelien Munnikhuis, Cindy van Goor, Marcel Bos, Marcelle Christjans, Patsy Ozdemir and Susanne Morshuis. All these professionals have supported me in my research in some way; from providing data, suggestions and insights to cooperating in the validation process. Without your help this research could never be performed, thanks!
4 During my internship at Thoraxcentrum Twente I was most often accompanied by my fellow interns
Max, Seraya, Pien, Denise and Mattiènne. I have enjoyed our lunches and coffee breaks together, thank you all and I wish you the best in your future careers. My housemates Tim, Alex and Rick were always there when I came home from the hospital to take my mind of the research at times, which I valued much. Thanks guys, the last two years have been fun! Last I would like to thank my parents,
Koen and Odilia, for their unconditional support. Not in anything study-related, but just in being there for me. Always. Thank you.
Jasper Dute,
5
Management summary
Introduction
Thoraxcentrum Twente (TCT) experiences a high rate of operating rooms (ORs) working beyond regular operating time and faces a need to decrease. High amounts of overtime result in unnecessary costs and low staff satisfaction. TCT would like to decrease overtime, while maintaining the current OR-utilisation rate. A recent study among Dutch hospitals suggests that more accurate predictions of surgical case duration and altering the sequencing of surgical cases on an OR-schedule can improve efficiency1.
Objective
This study aims to create a supportive planning tool for OR-planners at TCT to schedule the most efficient OR-schedules possible, maximising OR-utilisation and minimising OR-overtime.
Methods
Multiple linear regression analyses were used to develop two prediction models for surgical case duration. Model 1 used the predictors surgery type and surgeon only and model 2 used all potentially significant and available predictors at TCT. Both models were developed in a normal and a lognormal approach.
. The OR planning tool was developed in Microsoft Excel based on the regression results, visually outputting the scheduled program alongside the corresponding performance measurements. The OR planning tool was validated both retrospectively as prospectively. Retrospective validation measured the deviations between the planned and actual OR-program. The prospective validation evaluated the tool’s ability to actually maximise OR-utilisation and minimise overtime.
Results
The dataset for analysis comprised of 3,167 surgical cases performed from January 2013 to January 2016 at TCT. The lognormal model proved the best fit in both models.
. On average, the planning tool presented absolute deviations of
Overall, this is . In the
prospective validation,
Discussion
6 Other limitations of the tool
Conclusion
We conclude that we have developed a planning tool that is more accurate in its predictions
compared to OR-Suite, .
Recommendations
In order to increase effectiveness and efficiency of the planning tool, we recommend: 1)
Discussie
8
Conclusie
We concluderen dat we een planning tool hebben ontwikkeld die preciezer operatietijden kan schatten vergeleken met de huidige planningsmethodiek,
. Aanbevelingen
9
Table of Contents
1. INTRODUCTION ... 12
1.1RESEARCH CONTEXT ... 12
1.2PROBLEM DESCRIPTION ... 14
1.3RESEARCH OBJECTIVE ... 14
1.4RESEARCH QUESTIONS ... 15
2. CONTEXT ANALYSIS ... 17
2.1PROCESS DESCRIPTION ... 17
2.2PLANNING AND CONTROL ... 19
2.3PERFORMANCE ANALYSIS ... 20
2.4CONCLUSIONS AND DEMARCATION OF THE RESEARCH SCOPE... 25
3. LITERATURE RESEARCH ... 26
3.1INTERVENTIONS TO INCREASE OR-EFFICIENCY ... 26
3.2STATISTICAL TECHNIQUES FOR MODELING SURGICAL CASE DURATIONS ... 27
3.3FACTORS INFLUENCING SURGICAL CASE DURATION ... 28
4. METHODOLOGY ... 30
4.1STUDY DESIGN ... 30
4.2DATA COLLECTION ... 30
4.3SURGICAL CASE DURATION PREDICTION MODELS ... 30
4.4OR-PLANNING TOOL ... 32
5. RESULTS ... 34
5.1SURGICAL CASE DURATION PREDICTION MODEL ... 34
5.2OR PLANNING TOOL RETROSPECTIVE VALIDATION ... 38
5.3OR PLANNING TOOL PROSPECTIVE VALIDATION ... 43
6. CONCLUSION ... 45
6.1DISCUSSION ... 45
6.2CONCLUSION... 47
6.3RECOMMENDATIONS ... 47
7. IMPLEMENTATION ... 49
7.1STAKEHOLDER ANALYSIS ... 49
7.2IMPLEMENTATION ... 51
BIBLIOGRAPHY ... 52
10
Abbreviations
2-logN Two-parameter lognormal (distribution)
3-logN Three-parameter lognormal (distribution)
AV(P/R) Aortic Valve (Plasty / Replacement)
AUC Area Under the Curve
CABG Coronary Artery Bypass Grafting
MPSM Managerial Problem Solving Method
MSS Master Surgical Schedule
MST Medisch Spectrum Twente (hospital)
MV(P/R) Mitral Valve (Plasty / Replacement)
OR Operating Room
OT Operating Time
PVI Pulmonary Vein Isolation
ROC Receiver Operating Characterics (curve)
TCT Thoraxcentrum Twente
TV(P) Tricuspid Valve (Plasty)
VATS Video Assisted Thoracic Surgery
Glossary
Changeover time The time in minutes after a surgical case to prepare the OR for the next surgical case.
Efficiency The productivity in relation to the optimal productivity.
Operating time (OT) Regular working time at the OR (7:45 to 16:45), defined in consultation with the thorax OR manager.
OR-day The operating capacity in minutes of one OR within one working day.
OR-overtime The time in minutes that an OR-program exceeds the end of operating time (OT).
Surgical case Process from the patient entering to exiting the OR, possibly consisting of one or more surgical procedures.
Surgical procedure Surgical activities that are part of a surgical case, defined under only one surgical code.
Utilisation rate Fraction of time of that a specific resource is utilized.
12
1. Introduction
In 2001 the Institute of Medicine (IOM) published the article ‘Crossing the Quality Chasm’, reporting on the shortfall of quality of care in US hospitals. The authors distinguished six important aspects in their definition of quality of care; safety, effectiveness, timeliness, patient-centeredness, equity and efficiency2. Alongside a few other publications this article had tremendous impact on healthcare, providing the best well-known and goal-oriented definition of healthcare quality and creating a roadmap for quality improvement3. Although this article was published in the US, this definition is quite similar to the definition defined in the Dutch Quality of Care Institutions Act4.
Efficiency is defined as the ratio of the productivity (outputs/inputs) realised to the optimal productivity. Hospitals nowadays attempt to treat as much patients with as less a possible resources, but only since a few decades. There are several reasons why efficiency was neglected in healthcare relative to industrial settings. First, there was a lack of interest and support on the part of healthcare managers. Second, there was the attitude that investing in efficiency diverts funds from direct clinical care and research. Other reasons mentioned are the dreadful state of healthcare information systems and data, a healthcare reimbursement system that does not encourage efficient processes and the significant difference of the healthcare sector from industry.5 Healthcare organisations are complex working organisations, with often lacking cooperation between several parties involved. These parties have their own objectives, which can be conflicting. Managers and physicians usually lack a holistic vision, failing to look beyond their own department or specialty.6
In modern healthcare, healthcare organisations face the challenge of delivering more and better quality care with less human and financial resources7. This is mainly due to rising demand for healthcare and increasing expenditures6. Several authors conclude that efficiency is directly linked with quality, as inefficient care processes use up valuable resources and displace more useful care3,8. These reasons in particular make efficiency improvements very valuable for hospitals. Thoraxcentrum Twente (TCT), as a part of Medisch Spectrum Twente (MST), is no exception. In this thesis, we will present our efficiency improvement research at TCT.
In order to perform a structured research, we consider the managerial problem solving method (MPSM) as proposed by Heerkens & Van Winden9. The MPSM is a general, systematic approach for any organisation to solve managerial problems. The approach contains seven phases to complete, which are presented in box 1 at the end of this chapter.
1.1 Research context
13 The organisation of clinical functions at MST distinguishes eight groups. Group 1 represents Thoraxcentrum Twente, as presented in the organisation chart presented in Figure 110–12.
Figure 1: Organisation chart of Medisch Spectrum Twente12
Thorax Centrum Twente (TCT) is a center within Medisch Spectrum Twente, specialising in diagnosis and treatment of cardiothoracic diseases. Multidisciplinary medical care is delivered through several cardiothoracic-related specialties such as cardiology and cardiac surgery. TCT is one of the 16 thorax centers in the Netherlands and has grown rapidly after its establishment in September 2004. One reason for this is their short waiting list for open heart surgery, making TCT an interesting medical center for patients. Figure 2 presents a map of northeastern Netherlands indicating hospitals regularly referring patients to TCT. TCT is currently allocated three ORs within MST, which is similar to the capacity used in the former hospital. TCT performs approximately 1,100 to 1,200 open-heart
surgeries per year, mainly coronary and heart valve surgeries.13 Figure 2: Map of hospitals regularly referring to
[image:13.595.392.563.555.759.2]14 Figure 3 provides a distribution of surgical cases performed at TCT in 2015.
1.2 Problem description
This study was conceived by one of the thorax surgeons at TCT, who sees more potential in the OR-scheduling process at TCT. According to him, OR-planners at TCT lack clinical knowledge to schedule the most efficient programs possible for that particular day. This results in occasional offline OR-schedule adjustments by thorax surgeons. Despite these adjustments, many OR-days still run into overtime.
1.3 Research objective
Our main objective is to support OR-planners at TCT in making the most efficient OR-schedules with a tool at the offline operational level. This offline operational level will be further explained in paragraph 2.2. In the context of this thesis, efficient OR-schedules are defined as schedules that:
1. Minimise OR-overtime
OR-overtime is the time in minutes that an OR-team is operating beyond 16:45 hours.
2. Maximise OR-utilisation
The OR-utilisation rate is the fraction of time that an OR is utilised over a specific period.
We state our research objective:
15
1.4 Research questions
Based on the research objective as proposed in the previous paragraph, several research questions are drafted. These research questions are based on the before mentioned MPSM. Note that we already identified and described the problem in paragraph 1.2. We will evaluate the intervention through retrospective and prospective validation and propose an implementation strategy to implement the intervention. Therefore phases 6 and 7 are altered in sequence.
Q1 How is the surgical process at TCT is organised?
16
Box 1: The managerial problem solving method
The seven-phase managerial problem solving method as proposed by Heerkens & Van Winden9:
1. Identifying the problem
In this phase the research problem is identified and described.
2. Planning the problem-solving process
In phase 2 it is formulated where information can be found that can help solve the problem and describe how problems can be split into sub problems.
3. Analyzing the problem
After planning the problem-solving process, the causes, magnitude and consequences of the problem will be analyzed.
4. Generating alternative solutions
Different possible solutions are generated and described to solve this problem.
5. Choosing a solution
After formulating all possible solutions, one solution or set of solutions has to be chosen to implement.
6. Implementing the solution
The solution chosen in phase 5 will be implemented in this phase.
7. Evaluating the solution
17
2. Context analysis
In this chapter, we will elaborate the surgical process at TCT. First we will describe the surgical process as in paragraph 2.2 will give insight into the planning functions using a framework of planning and control as proposed by Hans, Van Houdenhoven & Hulshof6. Eventually we will present the results of our efficiency performance measurement of the surgical process at TCT.
2.1 Process description
18 The patient process starts when a patient is referred to a thorax surgeon for treatment. The patient will be discussed in a multidisciplinary heart team discussion. In this discussion the (semi) definite decision is made on which surgical treatment to perform by a thorax surgeon in consultation with a cardiologist. From the moment that the patient will is discussed in the heart team discussion, the patient will be placed on a surgery waiting list by the planning department. The access time for open heart surgery is usually two weeks for open heart surgery, which is exceptionally short compared to all other Thorax Centers in the Netherlands. As a reference: Dutch thorax centers had a waiting list for open heart surgery fluctuating between five and six weeks from 2005 to 201314.
From this waiting list, the OR-planners allocate surgical cases to a specific day usually a few weeks in advance in a provisional schedule. This schedule will be checked by the OR manager on feasibility. When the provisional schedule is approved, the patient receives a surgery date. The patient will not receive the time of surgery yet. The time of surgery is scheduled the day before surgery, often approved by a thorax surgeon just before the end of the working day. The planners can usually plan five surgical cases per day offline over these three ORs: two in OR 1, two in OR 2 and a longer case is usually planned in OR 3. All clinical patients on the waiting list should be planned within one week after placement on the waiting lists. Elective cases are served first come, first served. On the day planning, children (Nuss procedures) and longer cases are usually planned first.
Surgical case durations are generated by the planning program OR-Suite (IntegraSys Software Systems Inc., Knoxville, Tennessee, USA), which estimates surgical case durations based on the historical averages per surgery type and surgeon. The software program picks the quantile specified by the user as the predicted surgical case duration. Figure 5 shows a simplified scheme of how OR-Suite assigns a case duration to a specified case. In this example the 80th quantile is specified. For the sake of simplicity this example uses only ten cases per sub dataset, but in reality this dataset is much bigger. The minimum of cases can be specified by the user, the default setting is 20 cases15,16.
19 Patients are admitted to thorax surgical ward A5/C5 the day before surgery. The next day the patient will be prepared for surgery and brought to the holding. At the holding, several safety checks are performed to ensure that the patient is still eligible for surgery. After the administration of anesthesia, the patient is transferred to the OR for surgery. After surgery, the patient will recover at the thorax ICU and thorax surgical ward A5/C5 before discharge.
2.2 Planning and control
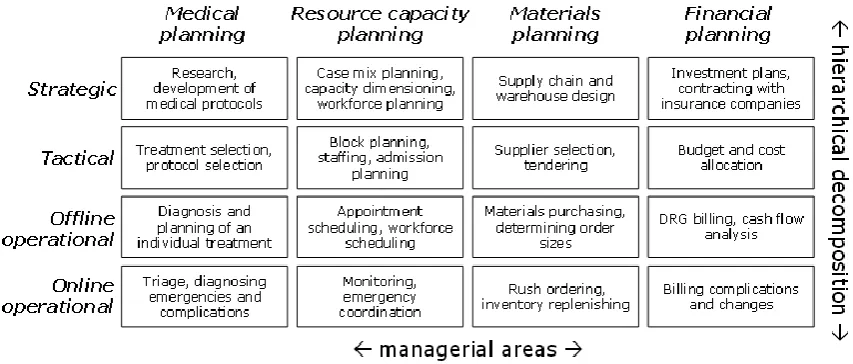
[image:19.595.79.506.411.593.2]Hans, Van Houdenhoven & Hulshof6 proposed a framework to structure and control planning functions. This framework is shown in Figure 7. The framework distinguishes four managerial areas; medical planning, resource capacity planning, materials planning and financial planning.
Figure 7: A framework for hospital planning and control as proposed by Hans et al.6
20 Strategic level
The strategic managerial level addresses structural (long-term) decision making. The time horizon of this level is usually one to several years. Managers at MST establish the mission and vision at this level to navigate MST towards meeting their long-term goals. It is MST’s mission to increase health of the inhabitants of the region by delivering top clinical medical care, education and research. MST’s core values are passion, attention and vigor13. The main operator within strategic level decision making is the board of directors. Within the managerial area of resource capacity planning, long-term decisions regarding for example which surgical types to perform at TCT are made or how much OR-capacity is allocated to TCT.
Tactical level
The tactical level lies in between strategic and operational levels and, like operational level, addresses the execution of the healthcare delivery process but decisions are made on intermediate-term planning horizon. Tactical planning refers to how the mission and goals of an organisation can best be achieved when demand is predicted. The main actors at the tactical level at TCT are the business administration manager and the OR-manager. They make decisions regarding for example how many full time equivalents (FTEs) to allocate for operations. At a lower hierarchal level, the offline operational level, this workforce is assigned to the specific ORs or surgical cases.
Operational level
The operational level is subdivided into two levels; offline and online operational levels. Offline operational level deals with in advance decision making and online operational planning with reactive, real-time decision making. Within the surgical process, offline operational planning in the context of this study refers to the work of TCT’s OR-planners that schedule surgical cases for the elective program. Online operational planning refers to the work of managers or planners at the OR who ad hoc alter surgical schedules to prevent unutilised OR-time, overtime or schedule an emergency case. The time horizon of this level is short-term: for the offline operational level usually one to two weeks, as for the online operational level this is usually one working day.
It is good to realize that all hierarchal levels are related to each other. A decision at strategic or tactical level can have huge impacts on the operational level. Conversely, a bottleneck at operational level can impact decision making at higher managerial levels.
2.3 Performance analysis
In this paragraph we will present the results of a performance analysis at TCT based on a dataset that we acquired from the OR-Suite database. We selected a set of performance indicators as developed by Van Hoorn and Wendt17 to clarify the current problems at TCT concerning the research objective. The performance indicators that will be measured at the operational level are the following:
o OR-utilisation rate o Overtime
o Planning deviation
21 Initially we measured and graphically presented more performance indicators and patient flow patterns in the surgical process of TCT. These measurements were eventually excluded from the research scope due to time limitations and will therefore not appear in this thesis. We did include these figures in appendix III, so this would not result in a loss of valuable information for other researches.
OR-utilisation rate
The utilisation rate at the thorax OR is subdivided into gross and net utilisation. We measured both
22
Overtime
a software error or registry fault. The planning deviation seems to be higher in longer lasting cases, which is to be expected as there usually is more variability in longer cases compared to shorter cases. The distinct groupings of shorter and longer cases can also be observed in Figure 11: the shorter
To see whether the surgery case durations estimated by OR-Suite differ statistically significant from the actual case durations, we performed a paired samples t-test assuming normally distributed surgical case durations. Table 1 presents the results of this t-test. Based on the t-test results we conclude that the planned and actual surgical case durations show highly significant differences at the .05 significance level.
25
2.4 Conclusions and demarcation of the research scope
In our performance analysis we found several points for improvement. In the following paragraphs we will conclude these findings and demarcate our research scope.
26
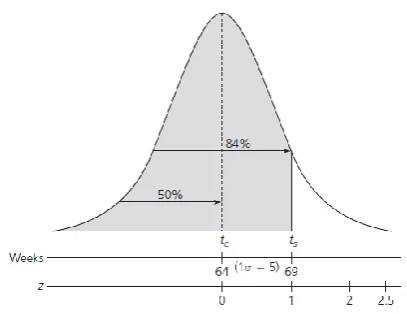
Figure 12: Project completion probability calculation according to Ozcan38
3. Literature research
In this section we answer research questions 3 and 4 as posed in paragraph 1.4. We describe possible interventions that can help us achieve our research objective. One or more interventions will be chosen and in the remaining paragraphs we describe how this intervention should be developed.
3.1 Interventions to increase OR-efficiency
We are interested in minimising OR-overtime as where we also want to maximise the OR-utilisation rate. In the following paragraphs we will present interventions possible to meet this objective. Improve the accuracy of surgical case duration predictions
Improving the accuracy of surgical case duration predictions is suggested by Van Veen-Berckx, Elkhuizen, Van Logten et al.1 in order to improve efficiency. At the end of the schedule, OR-planners can either plan an extra surgical case and risk overtime or choose not to and leave the OR unused, risking a decrease in OR-utilisation. Usually there is a trade-off between OR-utilisation and overtime. According to Van Houdenhoven, Hans, Wullink & Kazemier36, this trade-off is also very dependent on the variability in surgical case durations. When there is one hour left on an OR-program, a one hour case with less variability is more likely to be scheduled as there is less uncertainty in running into overtime. This intervention focuses on decreasing this variability.
Master Surgery Scheduling (MSS)
Van Oostrum, Parlevliet, Wagelmans & Kazemier37 propose a master surgical schedule (MSS) in order to increase OR-utilisation, schedule robustness and decrease overtime. A MSS is a repetitive cycle of sequenced surgery type clusters. The building blocks of a MSS are clusters of medically and logistically comparable surgical cases. As surgical cases are highly comparable, newly arrived patients can be assigned to the cluster that fits their surgery. By arranging the block length, frequency and sequencing on a standardised week of two-week schedule, OR and ward capacity can be utilised more effectively and workload can be leveled.
Planning based on the probability of overtime Ozcan38 proposes a calculation used in project management. This is a probabilistic approach which assumes that project duration variances are normally distributed. Using a weighted average and the variance of the tasks in a project, the expected completion time and its standard deviation can be calculated. In Figure 12, 64 weeks is the expected project completion time, which will be equal to the mean of the normal probability curve. By specifying a time at which the project should be completed at its latest, the probability of exceeding this is determined by the normal
27 Altering offline scheduling approaches
Hospitals can either plan their surgical cases using open or closed block planning. Using open block planning, specialties can plan their surgical cases at any OR in the hospital when there is sufficient capacity left that certain day. In closed block planning specialties get assigned certain ORs, OR-days or parts of OR-OR-days to plan their surgeries25. TCT uses closed block planning approach, as they are allocated three thorax ORs for cardiothoracic surgery. Elective cases can be assigned to an OR using basically four allocation algorithms, each with a different effect on OR-efficiency40:
First fit: allocating the surgical case to the OR with the first fitting time block found. This algorithm can be used for quick planning, but can potentially lead to a waste of valuable OR-capacity.
Best fit: allocating the surgical case to the OR with the smallest time block available in which the case fits. This algorithm requires more planning time, but makes the best use of the OR-capacity.
Level fit: allocating the surgical case to the OR with the least amount of minutes planned yet. This algorithm can be used to level the workload at the ORs.
Random fit: allocating the surgical case to the ORs at random. As this algorithm is based on random probabilities, the effect will also be random.
At TCT, a best fit allocation algorithm is used. Conclusion
In the previous paragraphs we described interventions which can be used to maximise the OR-utilisation rate and decrease OR-overtime. Developing a MSS seems to be inconvenient with the short waiting lists at TCT and altering the OR allocation algorithm used also does not seem the key to achieve our research objective. The intervention will mainly focus on decreasing variability in surgical case duration predictions, supplemented by planning based on overtime probabilities.
3.2 Statistical techniques for modeling surgical case durations
Studies found in which surgical case durations were modeled all made use of multiple linear regression techniques to model surgical case durations41–44. Two studies used ANOVA for multiple linear regression43,44 and one used artificial neural networks next to multiple linear regression for comparison41. Validation was performed internally in all cases and most often using a data splitting technique. Notable outcomes are that mainly the characteristics of surgery, surgeon and surgery team are significant predictors of surgical case duration. Only few patient characteristics proved significant predictors in final prediction models. In the next paragraph we will attempt to find potential predictors of surgical case duration.
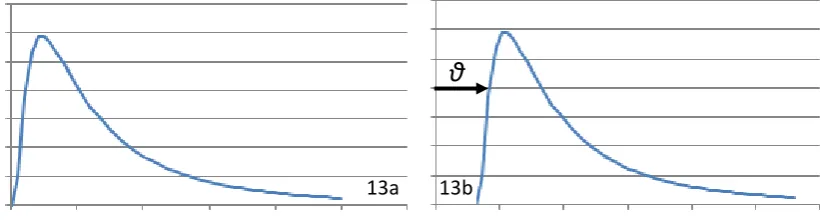
28 Figure 13 shows a 2-logN (a) and a 3-logN (b) distribution. The 2-logN distribution has a location parameter of zero. The 3-logN distribution has a location parameter greater than zero; the arrow indicates the impact of this location parameter on the distribution.
Figure 13: A two parameter lognormal (a) and a three parameter lognormal (b) distribution
For dual procedure surgical cases the lognormal distribution was the best fit model for a majority of surgical case durations48. When data is scarce, prediction modeling is difficult and uncertain. Literature suggests calculating prediction bounds and comparing them to actual surgical case durations, these bounds can predict the proportional variation in surgical case time49.
3.3 Factors influencing surgical case duration
In order to determine which factors (predictors) influence surgical case duration, databases Scopus and Pubmed were searched. Used terms are Predictor (or Prediction, Estimator, Estimation), Thorax (or Thoracic or Cardiac), Surgery (or Surgical case, Operation), Duration (or Time, Length). Using the snowballing method additional articles were found. Table 3 presents the results of this study. According to the literature the main predictors of surgical case duration are related to the surgery, surgeon and surgical team. It has to be noted that the study by Dexter, Dexter, Masursky & Nussmeier50 report predictors found in thoracic surgery specifically. The other studies are conducted in other specialisms. Most predictors were expected, but it is notable that the presence of hypercholesterolemia decreases surgical case duration. The authors that reported this predictor do not explain this finding. Another predictor worth highlighting is the number of surgeons, as this is an indirect predictor. The number of surgeons is usually inherent to the severity of the surgery, influencing its case duration. The inoperative mortality risk assessor Euroscore was not used as an input in the studies found.
θ
30
4. Methodology
In order to meet our research objective, quantitative research methods were used to create an offline planning tool to support OR-planners at TCT. In this chapter we elaborate how this research was performed.
4.1 Study design
We developed and validated two prediction models using multiple linear regression in order to explain variation in surgical case durations at TCT. Regression was the statistical technique most widely used to model surgical case durations. These predictions are the basis for our planning tool. OR-utilisation and overtime probability calculations were added to the tool to support decision making. Both models were modeled in a normal and a lognormal approach. The normal linear regression models for surgical case duration resulted in a linear regression equation as shown in equation 1:
In this equation, represents the predicted surgical case duration, the constant, predictor variable n and the corresponding béta-coefficient of predictor variable n. In the lognormal linear regression models, the dependent variable was transformed using its natural logarithm. Using regression equation 2 the surgical case durations can be predicted:
4.2 Data collection
Based on the predictors found in the literature research, data was requested from two separate databases;
. Data was handled confidentially following the data management plan, which can be found in appendix IV. Some patient-related factors were also requested from the MCS-database to test whether patient-related factors could be significant predictors of surgical case duration. The two datasets were merged into one master dataset using an unique case code, which was generated in Microsoft Excel by combining the hospital’s patient identification number and the date of surgery. A description of the dataset merging procedure can be found in appendix V. Surgical case duration was defined as the time from the patient’s complex arrival to the patient’s OR-complex departure in minutes.
4.3 Surgical case duration prediction models
We performed data analysis by developing two regression models. Regression model 1 only contained the variables expected to be most predictive, namely surgery type and surgeon. For the second regression model we used all predictors present in the dataset. Data analysis was conducted per regression model in a modified six-step process, as proposed by Steyerberg & Vergouwe55:
1. Problem definition and data inspection
(Equation 1)
31 As the research problem and questions were defined earlier in this thesis and there was already an understanding of the predictors that determine surgical case duration, only data inspection was necessary in this first step. The data inspection consisted of a visual inspection on the feasibility of the data. We inspected the amount of missing data and the presence of sufficient endpoints and endpoint frequency. An endpoint frequency of at least fifteen events per variable was used as a threshold for reliable prediction modeling. A high amount of missing data would decrease the statistical power of the models. To minimise this loss of statistical power, the dataset was statistically imputed by a qualified statistician.
2. Coding of predictors
In this process step predictor variables were coded for regression analysis. All categorical variables were recoded into dummy variables. An overview of all created dummy variables can be found in appendix VI. Categorical variables that contained categories with infrequent occurrence were collapsed with others when possible. Continuous variables were not categorised, as this would result in a loss of valuable information.
3. Model specification
In a linear regression model, there were a few assumptions that could not be violated.
(a) Linearity
A linear relationship between independent and dependent variables was tested by visual examination of the observed versus expected Q-Q plot. The plotted line should be along the diagonal to prove linearity.
(b) Normality of residuals
We assessed normality of residuals by visual examination of the residuals histogram and the observed versus expected Q-Q plot. The histogram should present a typical bell-shape and the Q-Q plot should not deviation heavily from the diagonal.
(c) Absence of high multicollinearity
Correlations among predictor variables were assessed using the variance inflation factors (VIF). Several authors recommended a maximum VIF-value of 1056–59. Any predictor variable with a VIF-statistic greater than 10 and a corresponding tolerance below 0.10 was omitted from the regression analysis.
(d) Absence of autocorrelation
Serial correlations among predictor variables were tested by the Durbin-Watson test. The Durbin-Watson test output should ideally be 2 (uncorrelated). A value greater than 2 indicates a negative correlation and a value below 2 indicates positive correlations. We considered a value between 1 and 3 acceptable in terms of autocorrelation60.
(e) Absence of heteroscedasticity
To assess whether there were equal error terms along the regression line, visual examination of a scatter plot plotting standardised residual versus the standardised predicted values was performed. A typical cone shape on the scatter plot was considered an indication of heteroscedasticity.
(f) Outliers
32 outlier. A thorax surgeon at TCT was asked to gain insight into the minimum time of case durations per surgery type. Outlier cases were omitted from further analysis.
4. Model estimation
Non-significant predictor variables were omitted from the regression equation.
5. Model performance & validity
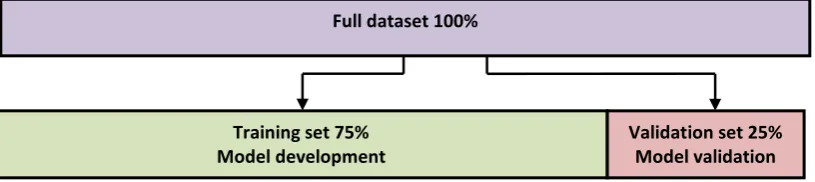
[image:32.595.115.523.289.380.2]The model’s performance was assessed using the R-squared statistic. In order to be able to generalise these results to a broader patient population at TCT, we split our dataset in a 75% training set and a 25% validation set as shown in Figure 14. The model was developed using the training dataset and performance was validated using the validation dataset. The R-squared value of the training dataset was compared to the R-R-squared value of the validation dataset. The models were only validated internally. External validation was not performed as a similar external dataset was hard to acquire.
Figure 14: Splitting of the dataset for validation
6. Model presentation
The models were eventually presented in regression equations. Using this equation, surgical case durations in minutes could be predicted and used in the OR planning tool.
4.4 OR-planning tool
OR-planning tool development
The regression equations from the regression analysis were implemented into an interactive tool created in Microsoft Excel. We chose Excel because of its simplicity and wide availability. The OR planning tool presents three panels; an input panel, a control panel and an output panel. Cases can be loaded into the system by specifying the parameters that proved significant in the regression analysis. From this, a predicted surgical case duration can be generated using the regression equations.
Using the control panel the user can specify at what time the OR-program starts, which cases and in what order should be performed and what amount of changeover time should be planned. The tool automatically presents the program’s utilisation and probability that of the created OR-program will exceed a specified time. This probability of overtime is calculated using a method proposed by Ozcan38 as shortly described in paragraph 3.1. Appendix VII presents the full calculation which is used in the planning tool. The OR-utilisation rates are calculated using equations as defined in appendix II.
Full dataset 100%
Training set 75% Model development
33 OR-planning tool validation
The created OR-planning tool was validated both retrospectively as prospectively over at least a two-week period each (10 working days). In the retrospective validation, we randomly selected two non-consecutive weeks to validation our planning tool on. The historically planned programs were entered into the tool. We compared the outputted schedule of our planning tool with the schedule as this was actually performed at the OR. We also assessed the initially planned schedule by the OR-planners, to use this as a reference to measure our planning tool’s results with. OR-schedules were assessed on whether the planning tool:
1) predicted individual surgical case durations accurately. 2) predicted the OR-utilisation accurately.
3) Predicted overtime accurately.
The accuracy at which overtime is predicted was measured in two measurements. In the first measurement we measured the deviation of the planned program end and the actual OR-program end. In the second measurement we assessed the accuracy of the overtime probability indicator to diagnose overtime. This accuracy was presented in sensitivity and specificity as presented in equations 3 and 4:
In the prospective validation, OR-planners based their planning on the planning tool’s output in a pilot study over two consecutive weeks. After two weeks of planning with this tool, the performance was evaluated. We asked the OR-planners how they perceived this new tool. We asked OR-planners what limitations they encountered and whether or not they see potential in using an improved planning tool. We again measured the OR-utilisation and the frequency and duration of overtime and compared it to baseline.
Appendix VIII presents screenshots of the planning tool’s interface and a manual of how the schedule an OR-day using the tool.
(Equation 3)
34
5. Results
In this section we will present the results of our regression models. For this regression, we assume that the registered data is properly registered and therefore data is reliable.
5.1 Surgical case duration prediction model
Model development
In this paragraph we try to explain variation in surgical case durations through two models, which will both require a different set of variables. First, we explored the outcome variable. We found that
[image:34.595.62.550.200.477.2]
Figure 15: Histogram of all surgical types (a), only shorter types (b) and only longer types (c)
Table 4 provides descriptive statistics of the durations per surgery type and the performing surgeons. All histograms per surgery type are presented in appendix IX. The original dataset contained
isolated heart valve surgery.
[image:34.595.72.527.553.676.2]35
Table 4: Descriptive statistics of surgery durations per surgery type
regression analyses, the dependent variable was transformed using its natural logarithm. This transformation resulted into a more symmetrical distribution of residuals and a less heteroscedastic distribution. In model 2, we found unacceptable multicollinearity in the variables
. Appendix XII presents the syntaxes used for SPSS-analyses.
In model 1 we attempted to explain variation in surgical case durations using predictor variables , which were assumed most predictive.
In model 2 we performed a regression analysis to explain variation in surgical case durations using the predictors from model 1 and six additional surgery and 18 patient-related predictors. Most variables had a moderate amount of missing data (below 20%). Five variables had higher amounts of missing data:
36 In the pooled estimates of the transformed approach, six additional predictor variables proved significance relative to model 1:
. Figure 16 presents a tornado diagram of all significant dummy variables, indicating the impact of all parameters on the constant. The constant is estimated using
[image:36.595.49.561.115.733.2].
37 Model performance
In this paragraph we will present the performance evaluation of our regression models. We tested the models’ performance using the R-squared statistic and validated the model using a data splitting technique.
In both models, transforming the dependent variable resulted in a less heteroscedastistic and more symmetric distribution.
[image:37.595.71.544.154.373.2]
Table 5: Regression model performances
In Figure 17 we plotted actual case durations against the regression predicted durations for both transformed models. The red lines represent equation y=x (perfect prediction). By visual examination is notable that values predicted in both models
[image:37.595.55.550.423.685.2]
38
5.2 OR planning tool retrospective validation
[image:38.595.69.561.59.234.2]In this paragraph we present our performance analysis of the OR planning tool created from the full regression model. We validated the planning tool both retrospectively as prospectively. In the retrospective validation we compared both the OR-Suite’s as the new planning tool’s planned schedules of 20 working days over four weeks with the actual schedules. Table 6 presents the distribution of surgery types in the retrospective validation dataset. This distribution is approximately comparable to the distribution of the dataset used for modeling. No surgery type occurred more or less than 6% in the validation dataset compared to the full
39 We assessed the deviations in surgical schedules based on three indicators:
. In these four weeks
Planning deviation
In all surgeries in the dataset, surgical case durations were on average more
[image:39.595.73.537.175.513.2]
Figure 18: Deviation in predicted and actual surgical case durations per surgery type (n=73)
Figure 18 presents a box plot of the deviations between the actual and planned case durations by .
This figure confirms that surgical cases are more
[image:39.595.72.526.555.761.2]40
OR-utilisation rate deviation
The actual net OR-utilisation was calculated over all OR-days. OR-utilisation rates generated by our OR-planner were compared to the actual OR-utilisation rates.
[image:40.595.57.537.308.746.2]
41 OR-program’s end prediction (OR-overtime)
In order to properly analyse OR-overtime we omitted seven OR-days from the analysis for the same reason as in the utilisation rate measurements. We adjusted OR-program end times to compensate for the occasional online case rescheduling. Case rescheduling was often performed to reduce overtime and therefore the measured overtime would not be representative to what was predicted during planning. We adjusted rescheduled OR-days by adding up the durations of all surgical cases initially planned in a certain OR-day to the actual starting time of the OR-program.
It was notable that the majority of OR-days
[image:41.595.70.544.378.738.2]
Figure 20 presents that both planning approaches most often predicted the OR-day’s ends
42
The optimal discrimination threshold depends on the choice what probability is more acceptable:
43 Figure 22 presents a Receiver Operating Characteristic (ROC) curve corresponding to the
5.3 OR planning tool prospective validation
In the prospective validation we tested our planning tool in practice to see the applicability of our planning tool and which challenges we face. Over a two-week consecutive period from
, OR-days were planned based on outcomes of our OR-planner.
[image:43.595.49.532.57.324.2][image:43.595.73.523.340.782.2]
44 The prospective dataset is in a lesser degree
In the prospective validation process we encountered a few practical challenges.
The prospective validation presented a similar planning deviation result as in the retrospective validation. The predictions of surgical case duration of our OR-planner were more
[image:44.595.71.526.71.297.2]
Table 9: Comparison of prospective validation measurements to baseline
45
6. Conclusion
In this chapter we will conclude our research. We will discuss the limitations of our research, draw conclusions and pose future recommendations to TCT.
6.1 Discussion
In this paragraph we will discuss our research and compare our results to the literature. First, we recall the research objective:
In this research we developed an OR planning tool based on two regression models to predict surgical case durations for patients undergoing cardiothoracic surgeries at We found
The variables accounted for an explained variance of as where adding other significant predictors improved the explained variance to In accordance with several studies, a lognormal approach resulted in a
In our validation process the planning deviation resulted in a . The OR-planning tool showed
A new OR planning tool is
. Results from the prospective validation study Two main reasons with several sub reasons can be identified to explain this result:
1)
Ideally, the thorax
46 A limited variety of surgery types
2)
The surgical cases to be planned at a certain day are determined several weeks before in the current planning process.
Another matter of discussion is
A perceived future limitation of our OR-planner compared to the is that
47
6.2 Conclusion
We conclude that our developed OR-planner overall performs better compared
6.3 Recommendations
Based on our study, we present our recommendations in this paragraph.
.
48
52
Bibliography
1. Van Veen-Berkx E, Elkhuizen SG, Van Logten S, et al. Enhancement opportunities in operating room utilization; With a statistical appendix. J Surg Res. 2015;194(1):43-51.
doi:10.1016/j.jss.2014.10.044.
2. Institute of Medicine & Committee on Quality of Health Care in America. Crossing the Quality Chasm: A New Health System for the 21st Century. Vol 323.; 2001.
doi:10.1136/bmj.323.7322.1192.
3. Ransom SB, Joshi MS, Nash DB. The Healthcare Quality Book: Vision, Strategy, and Tools.; 2005. doi:10.1016/j.patrec.2005.01.006.
4. Stepaniak PS. Modeling and management of variation in the operating theatre (Doctoral dissertation, Erasmus University Rotterdam). 2010.
5. Carter M. Diagnosis: mismanagement of resources. OR/MS Today. 2002:26-32.
6. Hans EW, Houdenhoven M Van, Hulshof PJH. A Framework for Healthcare Planning and Control. Handb Healthc Syst Sched. 2012;168:303-320. doi:10.1007/978-1-4614-1734-7_12. 7. Kortbeek N. Quality-driven Efficiency in Healthcare (Master’s thesis, University of Twente).
2012.
8. Donabedian A. The quality of care. How can it be assessed? JAMA. 1997;260(12):1743-1748. doi:10.1001/jama.260.12.1743.
9. Heerkens H, Winden A van. Geen Probleem: Een Aanpak Voor Bedrijfskundige Vragen En Mysteries. Buren: Business School Nederland; 2012.
10. MST. Jaarrekening 2014. https://www.mst.nl/wps/wcm/connect/www/1a7134c1-045a-427f-
bd7c-522d363ef9fa/Jaarrekening-MST- 2014.pdf?MOD=AJPERES&CONVERT_TO=url&CACHEID=1a7134c1-045a-427f-bd7c-522d363ef9fa. Accessed May 11, 2016.
11. MST. Jaarverslag 2014. https://www.mst.nl/wps/wcm/connect/www/1f7e34bd-13d2-4bd7-
8197-0315be403b22/Jaarverslag-MST- 2014.pdf?MOD=AJPERES&CONVERT_TO=url&CACHEID=1f7e34bd-13d2-4bd7-8197-0315be403b22. Accessed May 11, 2016.
12. MST. Jaarverslag 2015. https://www.mst.nl/wps/wcm/connect/www/711fa96f-1a05-44f7-
a736-e841b8148b4d/MST16001-01+Jaarverslag+2015+Interactief+LR.pdf?MOD=AJPERES&CONVERT_TO=url&CACHEID=ROOT
WORKSPACE.Z18_11A62AC0JGFLB0AOKJK1NH29U1-711fa96f-1a05-44f7-a736-e841b8148b4d-lmxdbYG. Accessed August 14, 2016.
13. MST. Medisch Spectrum Twente. www.mst.nl. Accessed February 17, 2016.
14. NVT. De Nederlandse Dataregistratie Hartchirurgie: Resultaten van Samenwerking Tussen 16 Nederlandse Hartchirurgische Centra.; 2012.
15. Schopman T. Scheduling with OR-Suite. Interviewed by J Dute. 2016.
16. OR-Suite. Program Release Document: Historical Times Version 3.3.xx.; 2014.
53 18. Jansma AM. Analysis of the performance of the operating room department of Scheper
hospital (Master’s thesis, University of Twente). 2009.
19. Apenhorst G. Improving elective OR planning at general ORs of Medisch Spectrum Twente (Master’s thesis, University of Twente). 2010.
20. Veldhuis S. Optimization of the thorax operating room capacity (Master’s thesis, University of Twente). 2010.
21. Vollebregt R. Breaking down the walls between OR and ward (Master’s thesis, University of Twente). 2011.
22. Bosch J. Better utilisation of the OR with less beds (Master’s thesis, University of Twente). 2011.
23. Tyler DC, Pasquariello CA. Determining Optimum Operating Room Utilization. 2003:1114-1121. doi:10.1213/01.ANE.0000050561.41552.A6.
24. Van Houdenhoven M. Healthcare Logistics: The Art of Balance (Doctoral dissertation, Erasmus University Rotterdam). 2007.
25. Hans EW. Operations Research and Health Care: Operating Room Planning and Scheduling. https://www.utwente.nl/choir/en/education/PhDstudents/LNMB_ORinHealthcare_coursePh Ds/College 2 (operating room scheduling).pdf. Accessed July 15, 2016.
26. Magerlein JM, Martin JB. Surgical demand scheduling: a review. Health Serv Res. 1978;13(4):418-433.
27. Rose M, Davies D. Scheduling in the operating theater. Ann R Coll Surg Engl. 1984;66.
28. Kelley MG, Eastham A, Bowling GS. Efficient OR scheduling. A study to decrease cancellations.
AORN J. 1985;41(3):565-567. http://www.scopus.com/inward/record.url?eid=2-s2.0-0022037679&partnerID=40&md5=aa5f340f0742fb0f47b0967f2aec4867.
29. Shukla RK, Ketcham JS, Ozcan YA. Comparison of subjective versus data base approaches for improving efficiency of operating room scheduling. Heal Serv Manag Res An Off J Assoc Univ Programs Heal Adm / HSMC, AUPHA. 1990;3(2):74-81. doi:10.1177/095148489000300201. 30. Macario A, Dexter F. Estimating the duration of a case when the surgeon has not recently
performed the procedure at the surgical suite. Anesth Analg. 1999;89:1241-1245.
31. Dexter F, Epstein RH, Marsh HM. A statistical analysis of weekday operating room anesthesia group staffing costs at nine independently managed surgical suites. Anesth Analg.
2001;92(6):1493-1498. doi:10.1097/00000539-200106000-00028.
32. Dexter F, Epstein RH, Traub RD, Xiao Y. Making management decisions on the day of surgery based on operating room efficiency and patient waiting times. Anesthesiology.
2004;101(6):1444-1453. doi:10.1097/00000542-200412000-00027.
33. Dexter F, Epstein RH. Operating room efficiency and scheduling. Curr Opin Anaesthesiol. 2005;18(2):195-198. doi:10.1097/01.aco.0000162840.02087.15.
34. Friedman DM, Sokal SM, Chang Y, Berger DL. Increasing operating room efficiency through parallel processing. Ann Surg. 2006;243(1):10-14. doi:10.1097/01.sla.0000193600.97748.b1. 35. McIntosh C, Dexter F, Epstein RH. The impact of service-specific staffing, case scheduling,
54 36. Van Houdenhoven M, Hans EW, Wullink J, Kazemier GPD. A Norm Utilisation for Scarce
Hospital Resources: Evidence from Operating Rooms in a Dutch University Hospital. J Med Syst. 2007;31:231-236. doi:DOI 10.1007/s10916-007-9060-5.
37. Oostrum JM Van, Parlevliet T, Wagelmans APM, Kazemier GPD. A method for clustering surgical cases to allow master surgical scheduling. Inf Syst Oper Res. 2011;49(4):254-260. doi:http://dx.doi.org/10.3138/infor.49.4.254.
38. Ozcan YA. Quantitative Methods in Health Care Management. 2nd ed. San Francisco: John Wiley & Sons; 2009.
39. Hans EW, Wullink G, Van Houdenhoven M, Kazemier GPD. Robust Surgery Loading. Eur J Oper Res. 2008;185(3):1038-1050. doi:10.1016/j.ejor.2006.08.022.
40. Hans EW. OK-planning en Scheduling: Een overzicht van het onderzoek binnen CHOIR, Universiteit Twente.
https://www.utwente.nl/choir/evenementen/archiefseminars/20130517/E.W.Hans_CHOIRse minar_OK planning_17mei2013.pdf. Accessed July 15, 2016.
41. Dravenstott R, Reich E, Strongwater S, Devapriya P. B1-3: improving surgical case duration accuracy with advanced predictive modeling. Clin Med Res. 2014;12(1-2):93.
doi:10.3121/cmr.2014.1250.b1-3.
42. Eijkemans MJCPD, van Houdenhoven MPD, Nguyen TMS, Boersma EPD, Steyerberg EWPD, Kazemier GPD. Predicting the Unpredictable: A New Prediction Model for Operating Room Times Using Individual Characteristics and the Surgeon’s Estimate. [Miscellaneous Article].
Anesthesiol January 2010. 2010;112(1):41-49. doi:10.1097/ALN.0b013e3181c294c2. 43. Stepaniak PS, Heij C, De Vries G. Modeling and prediction of surgical procedure times. Stat
Neerl. 2010;64(1):1-18. doi:10.1111/j.1467-9574.2009.00440.x.
44. Strum DP, Sampson a R, May JH, Vargas LG. Surgeon and type of anesthesia predict variability in surgical procedure times. Anesthesiology. 2000;92(5):1454-1466. doi:10.1097/00132586-200106000-00009.
45. Barnoon S, Wolfe H. Scheduling a multiple operating room system: a simulation approach.
Health Serv Res. 1968;3(4):272-285.
46. Hancock WM, Walter PF, More RA, Glick ND. Operating room scheduling data base analysis for scheduling. J Med Syst. 1988;12(6):397-409. doi:10.1007/BF00992688.
47. Strum DP, May JH, Vargas LG. Modeling the uncertainty of surgical procedure times: comparison of log-normal and normal models. Anesthesiology. 2000;92(4):1160-1167. doi:10.1097/00000542-200004000-00035.
48. Strum DP, May JH, Sampson AR, Vargas LG, Spangler WE. Estimating times of surgeries with two component procedures: comparison of the lognormal and normal models.
Anesthesiology. 2003;98(1):232-240. doi:0000542-200301000-00035.
49. Dexter F, Ledolter J. Bayesian prediction bounds and comparisons of operating room times even for procedures with few or no historic data. Anesthesiology. 2005;103(6):1259-1167. doi:10.1097/00000542-200512010-00023.
55 51. Kalfa N, Allal H, Lopez M, et al. Thoracoscopy in pediatric pleural empyema: a prospective
study of prognostic factors. J Pediatr Surg. 2006;41:1732-1737.
52. Kalfa N, Allal H, Montes-Tapia F, et al. Ideal timing of thoracoscopic decortication and drainage for empyema in children. Surg Endosc. 2004;18:472-477.
53. Cassera MA, Zheng B, Martinec D V., Dunst CM, Swanström LL. Surgical time independently affected by surgical team size. Am J Surg. 2009;198(2):216-222.
doi:10.1016/j.amjsurg.2008.10.016.
54. Zheng F, Cammisa FP, Sandhu HS, Girardi FP, Khan SN. Factors predicting hospital stay, operative time, blood loss, and transfusion in patients undergoing revision posterior lumbar spine decompression, fusion, and segmental instrumentation. Spine (Phila Pa 1976).
2002;27(8):818-824. doi:10.1097/00007632-200204150-00008.
55. Steyerberg EWPD, Vergouwe Y. Towards better clinical prediction models: Seven steps for development and an ABCD for validation. Eur Heart J. 2014;35(29):1925-1931.
doi:10.1093/eurheartj/ehu207.
56. Marquardt DW. Generalized inverses, ridge regression, biased linear estimation, and nonlinear estimation. Technometrics. 1970;12(3):591-612.
doi:10.1080/00401706.1970.10488699.
57. Neter J, Kutner M, Wasserman W, Nachtsheim C. Applied Linear Regression Models. Homewood: Irwin; 1989.
58. Kennedy P. A Guide to Econometrics. Vol 2.; 2003. doi:10.1016/0164-0704(93)90038-N. 59. Hair JF, Black WC, Babin BJ, Anderson RE. Multivariate Data Analysis. Vectors. 2010:816.
doi:10.1016/j.ijpharm.2011.02.019.
60. Field A. Discovering Statistics Using SPSS. Third edit. London: Sage; 2009. 61. Allison P. When Can You Safely Ignore Multicollinearity?
http://statisticalhorizons.com/multicollinearity. Published 2012. Accessed June 29, 2016. 62. Parikh R, Mathai A, Parikh S, Sekhar C, Thomas R. Understanding and using sensitivity,
specificity and predictive values. Indian J Ophthalmol. 2008;56(1):45-50.
63. Mitchell RK, Agle BR, Wood DJ. Toward a Theory of Stakeholder Identification and Salience: Defining the Principle of Who and What Really Counts. Acad Manag Rev. 1997;22(4):853-886. doi:10.5465/AMR.1997.9711022105.
64. Grol R, Wensing M, Eccles M, Davis D. Improving Patient Care. 2nd ed. San Francisco: John Wiley & Sons; 2013.
65. Rogers EM. Diffusion of Innovations. New York: Free Press; 1995.
69
Appendix IV: Data Management Plan
Name of student Jasper A. Dute
Name of project Predicting surgery durations Description of research In this study,
Funding body(ies) None
Partner organisation(s) Medisch Spectrum Twente, University of Twente Project duration 01-02-2016 to 01-08-2016
Date written 15-03-2016
Date last update 23-06-2016
Version 1
Names & roles
1. Data collection
Data will be extracted from two databases;
2. Data storage and back-up
The original raw datasets will be stored
70
3. Data documentation
The analysed data will be
4. Data access
Datasets can only be accessed by the
5. Data sharing and reuse
When other researchers request the datasets used for analysis in this research, permission must be granted by
6. Data preservation and archiving
Data containing personal information shall be deleted
75
Appendix VII: Calculation of over probabilities
The probability of overtime will be calculated using a method proposed by Ozcan. The author describes a method used in project management. All tasks of a project have an optimistic (o), most likely (m) and pessimistic (p) duration and eventually these components form a project. In our study, the tasks are surgical cases (and changeover times) and these form an OR-day (the project). The most likely, optimistic and pessimistic durations are represented by the predicted OR-durations, the upper and lower 95% confidence intervals respectively using our regression model. First, we calculate an expected time (te) and a variance (σ2) per OR-day by using the following equations:
The variance indicates the degree of uncertainty in a surgical case’s duration. We make use of these expected times and variance rather than the regression outputted times and variance as they take into account the uncertainty around the estimates. After this, the OR-day’s expected duration (t OR-day) is calculated by summing up all expected times in the OR-day:
The standard deviation corresponding to this expected OR-day duration (σOR-day) is then calculated by summing the variances of the surgical cases in the OR-day and taking the square root of that number:
When expected OR-day durations and the corresponding standard deviations are calculated, the probability that the OR-day will exceed the specified time can be calculated. We will assume that the standard deviation of an OR-day follows a normal distribution. In the following we will calculate what the probability is that an OR-day finishes before a specified time (ts). The time before an OR-day should be completed is at the end of operating times, which is 16:45 hours.
We will first calculate a z-score (z):
Finally we find the matching probability in a standard-normal distribution table. This is the
probability that the OR-day will finish within the specified time (16:45). We are not interested in this probability, but rather in the probability that an OR-day exceeds the specified time. To calculate this probability, we subtract the probability of not exceeding ts from 1: