University of Warwick institutional repository: http://go.warwick.ac.uk/wrap This paper is made available online in accordance with
publisher policies. Please scroll down to view the document itself. Please refer to the repository record for this item and our policy information available from the repository home page for further information.
To see the final version of this paper please visit the publisher’s website. Access to the published version may require a subscription.
Author(s): Speight, R. J., Rourke, J. P., Wong, A., Barrow, N. S., Ellis, P. R., Bishop, P. T. and Smith, M. E.
Article Title: 1H and 13C solution- and solid-state NMR
investigation into wax products from the Fischer–Tropsch process Year of publication: 2011
Link to published article : http://dx.doi.org/10.1016/j.ssnmr.2011.03.008 Publisher statement: NOTICE: this is the author’s version of a work that was accepted for publication in Solid State Nuclear Magnetic
1
H and
13C solution- and solid-state NMR investigation into wax
products from the Fischer-Tropsch process
R. J. Speighta, J. P. Rourkeb, A. Wonga, N. S. Barrowa,c, P. R. Ellisc, P. T. Bishopc, M. E. Smitha*
a
Department of Physics, University of Warwick, Coventry, UK, CV4 7AL. b
Department of Chemistry, University of Warwick, Coventry, UK, CV4 7AL. c
Johnson Matthey Technology Centre, Blounts Court, Sonning Common, Reading, UK, RG4 9NH.
Keywords: Fischer-Tropsch wax, average carbon chain length, 13C, 1H, MAS,
solid-state NMR, Solution-solid-state NMR.
* Correspondence to Mark E. Smith, Department of Physics, University of Warwick, Gibbet Hill Road, Coventry CV4 7AL, United Kingdom,
Fax: +44 24 7652 4578
Abstract
1
H and 13C solid- and solution-state NMR have been used to characterise
waxes produced in the Fischer-Tropsch reaction, using Co-based catalysts either
unpromoted or promoted with approximately 1 wt% of either cerium or rhenium. The
aim was to measure average structural information at the submolecular level of the
hydrocarbon waxes produced, along with identification of the minor products, such as
oxygenates and olefins, which are typically observed in these waxes. A parameter of
key interest is the average number of carbon atoms within the hydrocarbon chain
(NC). A wax prepared using an unpromoted Co/Al2O3 catalyst had NC ~20, whilst
waxes made using rhenium- or cerium-promoted Co/Al2O3 catalysts were found to
both have NC ~21. All three samples contained small amounts of oxygenates and
alkenes. The subtle differences found in the waxes, in particular the minor species
produced, demonstrate that the different promoters have different effects during the
reaction, with the Re-promoted catalyst producing the fewest by-products. From a
technique point of view it is shown that the longer chain (compared to the lengths of
chain in previous studies) waxes that the lack of resolution and the complexities
added by the differential cross-polarisation (CP) dynamics mean that it is difficult to
accurately determine Nc from this approach. However the Nc determined by 13C CP
magic angle spinning NMR is broadly consistent with the more accurate solution
approaches used and suggest that the wax characteristics do not change in solution.
On this basis an alternative approach for determining Nc is suggested based on 1H
solution state NMR that provides a higher degree of accuracy of the chain length as
Introduction
In the early 1900s it was discovered that the formation of hydrocarbons from
the reaction of H2 and CO at high temperatures (200oC) and pressures (20 bar) was
possible in a process known as the Fischer-Tropsch (FT) reaction.1-4 Although the
exact mechanism of the reaction is still the subject of debate,5-6 the reaction converts
synthesis gas (a mixture of hydrogen and carbon monoxide) into long chain paraffins,
with chain lengths of 100 or more carbons in some cases. These waxes are further
processed to the diesel hydrocarbon fraction (n ~ 12-22). The FT process is therefore
a key part of processes to convert non-oil feedstocks such as gas, coal or biomass into
liquid transportation fuels. The catalysts of interest in the current work are
cobalt-based, supported on alumina; either cobalt-only or containing approximately 1% of a
promoter, rhenium (Re),7-10 or cerium (Ce).11 Promoters are added to the catalyst to
improve performance in different ways.
Three waxes produced using the above catalysts are analysed here. The waxes
are characterised using both solid- and solution-state NMR in order to measure the
average number of carbon atoms within the hydrocarbon chain (NC), as well as
characterising subtle differences in the by-products, such as oxygenates and alkenes.
The FT process is known to produce small amounts of these by-products,12 and the
amount produced depends on the choice of catalyst and reaction conditions. It is
hoped that information on the products generated by the different catalysts will give a
greater understanding of the catalysts used.
Little structural information on the by-products in these waxes is available and
hence the aim of this work is to use both solution- and solid-state NMR to
characterise them. The waxes contain a complex mixture of molecules, although it is
the complication with various forms of carbon chains, the identification of every
compound present is not feasible. For this reason NMR spectroscopy is of great use,
in particular with the goal of deducing average structural information at the
submolecular level on the wax materials. The waxes produced are usually
characterised by gas chromatography, which separates each component. NMR
analysis offers the opportunity to analyse the whole sample and so has significantly
better sensitivity for non-hydrocarbon functionalities present in low levels.
NMR of hydrocarbons has been used to characterise many different
compounds in both solution-state13-16 and solid-state NMR.17-20 However, because of
the low natural abundance of 13C, 1.1%, the Cross-Polarisation (CP) experiment21-23 is
used to enhance the signal sensitivity for 13C. For solid-state NMR, CP is often
combined with Magic Angle Spinning (MAS).24-25 The 13C and 1H isotropic chemical
shifts have been well documented for long chain hydrocarbons in the solution state,
26-28
however, only 13C data has so far been reported in the solid state.29-32 To gain
further information on the product waxes in solution a combination is used of
one-dimensional experiments along with both Polarisation Enhancement During Attached
Nucleus Testing (PENDANT)33-34 and Heteronuclear Multiple-Quantum Coherence
(HMQC)35-36 approaches.
Although solid-state 13C NMR was first used to characterise hydrocarbons in
the late 1970s37-38 it was not until 1985 that Cookson and Smith quantified NC in
hydrocarbon fuels using 13C NMR spectroscopy.39 The fractional abundances of CHn
groups were measured (n = 0 to 3) by using a gated spin-echo (GASPE) technique.
The GASPE technique gives subspectra for each of the CHn groups for ease of
calculating fractions of each group. However, due to the advances in high-field NMR
with some resolution of the different CHn. Hence, the complicated GASPE approach
is not necessary in the current work.
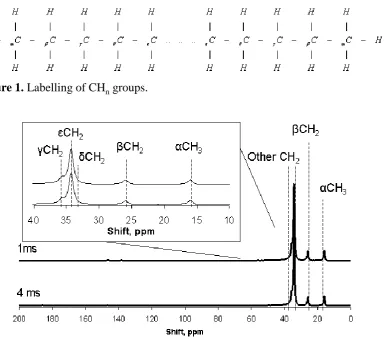
For a linear alkane such as in Figure 1, the empirical formulae takes the form
of CnH2n 2. Assuming no branching, Cookson and Smith found one resonance
corresponds to the terminal CH3 groups, and four ( , , δ and ε) to the CH2 groups.
Moreover, it was also found that any CH2 groups beyond εCH2 have negligible effect
on the chemical shift of the CH3 terminations. The observed five resonances are found
in the 13C NMR spectra to be at 14.3 ppm (αCH3), 23.0 ppm (βCH2), 32.2 ppm
(γCH2), 29.7 ppm (δCH2) and 30.0 ppm (εCH2) for a hydrocarbon chain of
(αCH3)2(βCH2)2(γCH2)2(δCH2)2(εCH2)y.39
The average n-alkane chain length, NC, can be calculated from Cookson’s
Formula:39 ) , , , ( ) , , , , ( 8 I I
NC (1)
where I is the total 13C NMR intensity of different carbon groups listed in parenthesis.
With modern NMR instruments, in some cases the different carbon groups can be
resolved allowing each resonance to be integrated separately. Thus, the Cookson
formula can be rewritten as,
) ( ) ( ) ( 8 2group CH I groups CH all I groups CH all I N n n
C (2)
where n = 2 or 3. The Cookson formula has also been used to calculate NC for alkenes
and alkanes synthesised from Fischer-Tropsch products40 and waxes similar to those
studied in the current work.41
In solution-state, NC is determined from 1H NMR as 13C NMR is potentially
non-quantitative due differential effects of 1H decoupling. The integrated intensity of
number of protons responsible for each peak. A similar analytical method is used to
calculate the cetane number of diesel fuels.42
Experimental Details
Materials
Before any Fischer-Tropsch waxes were examined, some standards were
measured. The standards used were Docosane (C22H46) (99%, Alfa-Aesar) and
Octacosane (C28H58) (99%, Alfa-Aesar). The three Fischer-Tropsch waxes have been
collected over the entire duration of a 120 hour FT reaction using Co-only, or Re- or
Ce-promoted Co/Al2O3 catalysts. The measured NC of these waxes reflect the nature
of the collection process as much as any property of the catalyst performance or test
method. The waxes are referred to as “Co-wax”. “ReCo-wax” and “CeCo-wax”
throughout this paper.
NMR experimental details
Standard 1D 1H and 13C solution-state NMR spectra were taken of the waxes
using a 270 MHz BSX 270 Jeol spectrometer (6.35 T). The 1H NMR spectra were
acquired using a single pulse with a pulse delay of 2 s and 16 acquisitions. 13C NMR
spectra were acquired with a pulse delay of 0.25 s and 25000 acquisitions. Deuterated
chloroform, CDCl3, was used as a solvent for all waxes and the 13C chemical shift
reference. The waxes showed good solubility in CDCl3 and there was no evidence of
insoluble residues.
To gain further information on the by-products in selected waxes, a 500 MHz
Bruker spectrometer (11.7 T) was used to perform solution-state 13C PENDANT and
2D HMQC NMR correlation experiments between 13C and 1H. Samples were held in
acquisitions, a 90o pulse length of 6.6 μs and a pulse delay of 2 s. The 2D HMQC
correlation experiments were taken with 40 acquisitions at each 1H position, a 90o
pulse length of 8.8 μs and a pulse delay of 1.8 s.
Standard 1D solid-state 13C CP/MAS NMR spectra were taken of the waxes
using either a Varian InfinityPlus 300 MHz (7.05 T) or Bruker Avance II+ 600 MHz
(14.1 T) spectrometer. Samples were held in a 4 mm Bruker MAS rotor and spun at
10 kHz or 15 kHz. A CP pulse sequence was used with a 90o pulse length of 2.5 μs,
pulse delay of 3 s, the contact time between 1H and 13C spins was set to either 1 ms or
4 ms. 20000 transients were acquired over 17 hours. 1H MAS NMR was performed on
a Bruker Avance II+ 600 MHz spectrometer under identical sample conditions as for
the 13C MAS NMR described above. The 1H 90o pulse length was 2.75 μs and 972
Results and discussion
13
C NMR Spectra
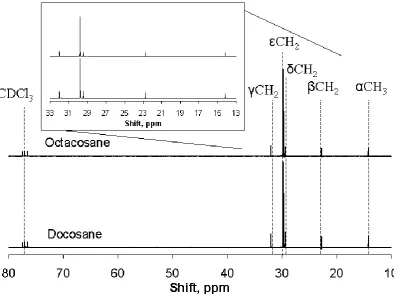
Solid state 13C NMR spectra were obtained for docosane (Figs 2, 3), as well as
solution spectra, including that of octacosane (Fig. 4). Similar combinations of solid
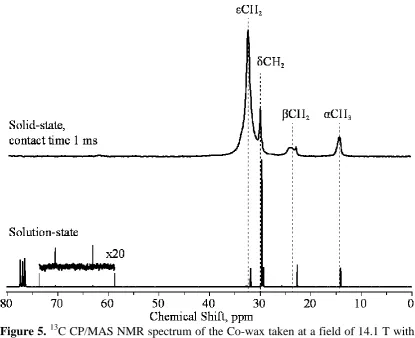
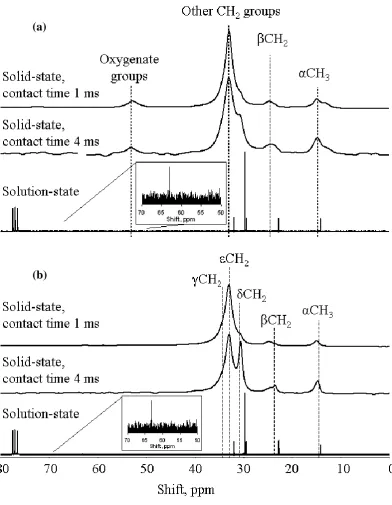
and solution state 13C NMR data is shown from the three wax samples – Co-wax (Fig.
5), ReCo-wax, Fig. 6(a) and CeCo-wax, Fig. 6(b). The spectra were fitted using
DMFit43. All four spectra show peaks for the -carbon at 14-16 ppm, the -carbon at
24-26 ppm and the other carbon atoms ( , and ) in a complex peak or group of
peaks at 28-38 ppm. These are in broad agreement with the results of Cookson and
Smith39 for their shorter-chain alkanes in solution-state 13C NMR. However, the
chemical shifts observed in this work are slightly higher than those analysed by
Cookson and Smith by 2-5 ppm. This is likely to be a consequence of (1) a longer
carbon chain length and (2) the packing of the alkane chains in the solid wax, giving
an extra intermolecular van der Waals force which is not observed in the solution
state. An additional peak is observed at 53 ppm in the spectrum of ReCo-wax. This is
assigned as an oxygenated species, such as C-OH.
Attempts were made to determine NC using the Cookson formula, but these
were hampered by the poor resolution of the - and -carbon peaks from the -carbon
peak. The -carbon peak is much larger in these longer chain wax samples than the
kerosene and diesel peaks analysed by Cookson and Smith. The other difficulty in
determining NC from 13C MAS NMR data is the effect of contact time on the
spectrum. Spectra were measured at 1 and 4 ms contact times for ReCo-wax and
CeCowax, and a modified Cookson formula applied normalised to the four and
) ( ) ( ) ( 4 2 3groups I CH group
CH I groups CH all I N n C (4)
The NC values calculated using this approach were not consistent at the two contact
times, and this was initially thought to be due to a different enhancement of the
-carbon, which has three protons attached to it. A second modification of the Cookson
formula normalised on the -carbon only was applied:
) ( ) ( 2 2group CH I groups CH all I N n C (5)
However, this did not yield improved values and so the method was deemed
unreliable. This is due to (1) poor resolution of the -, - and -carbon peaks and (2)
the non-linear enhancement of the signal with CP contact time. Interestingly, the
standard docosane does not change as much as the FT waxes with contact time. This
could suggest a role of minor impurities or variable chain length as the cause of the
difficulties in determining NC.
The samples were also analysed by solution state NMR, dissolved in
deuterochloroform (Figs 4-6). All the samples showed good solubility in the solvent
at room temperature. The same chemical shifts were observed for all the samples: 14,
23, 32, 29.5 and 30 ppm for the -, -, -, - and -carbons respectively. These were
slightly lower than the values obtained by 13C MAS NMR above, and in good
agreement with the data of Cookson and Smith39. NC calculations were not attempted
using this data as the spectra were obtained in proton-decoupled mode and therefore
are not quantitative.
A smaller peak was observed in the spectrum of the ReCo-wax and CeCo-wax
samples at 64 ppm (although not the Co-wax or the standard materials). As it is a
weak signal in both cases, the samples were investigated by solution-state 13C
major peaks (the -carbon is negatively phased as a CH3 group, whilst the others are
positively phased as CH2 groups). The PENDANT spectra also show a number of
small peaks in both samples – positively-phased peaks at 61 and 74 ppm, and
negatively phased peaks in the 120-140 ppm region. The former are in the region
usually assigned to carbon-carbon triple bonds (alkynes), oxygenates or quaternary
carbons. The positive phasing means that a C-OH functionality is ruled out as the
carbon will only have one hydrogen attached. However, an ether-type linkage (-CH2
-O-CH2-) would be consistent with the data. There are multiple peaks in the 120-140
ppm range, and they are less intense than the peaks at 64 and 71 ppm. These are
assigned to alkene functionalities, with the exact position of the peak depending on its
position in the chain. The PENDANT NMR shows that these alkenes are
predominantly internal alkenes (-CH=CH-) rather than terminal alkenes (H2C=CH-)
as all the peaks are negatively phased. Cobalt catalysts in the FT process do not make
aromatics44 (they are only produced using iron catalysts, and even then are thought to
be secondary products45) and so these are unlikely to be due to benzene ring species.
1
H NMR Spectra
To investigate the application of solid-state 1H NMR to the analysis of the
waxes, the ReCo-wax and CeCo-wax samples were analysed (Fig. 8). These showed
the expected resonances for methyl (0.7 ppm) and methylene (1.0 ppm) protons. The
latter was a poorly-resolved peak. In addition, in both spectra an additional peak was
observed at 4.1 ppm. This is assigned to oxygenate groups, such as CH-OH or CH2-O.
The chemical shifts observed in the solid state proton spectra for methyl and
methylene protons are both slightly lower than those in the solution state spectra (see
As for the solution state 13C spectra above, solution-state 1H data were
obtained in deuterochloroform solution. The solution-state 1H NMR spectra of the
standards (docosane and octacosane) and Co-wax (Fig. 9), alongwith ReCo-wax and
CeCo-wax (Fig. 10) were all recorded. The peaks for methylene and methyl protons
were located at 1.2-1.25 and 0.85-0.95 ppm respectively, in line with previous work42.
The average carbon chain length was calculated by careful integration of these peaks,
using a modification of the Cookson approach39:
I I N 6 2 1 (6)
where N is the number of CH2 carbons, I is the total intensity of the methylene
protons and I is the intensity of the six methyl protons. The total chain length is then
found by adding two methyl carbons to the number of methylene carbons:
2 3
I I
NC (7)
This assumes that there is no branching in the wax – i.e. that there are only two
methyl groups per chain. This is a reasonable assumption for FT waxes as the
mechanism strongly favours straight chain alkane over branched chain alkane
formation46. The results calculated using equation 7 are shown in Table 1. The results
for the two standards, docosane and octacosane, were in excellent agreement with the
expected values. The three wax samples were all close in average chain length, being
20-22 carbons long. This may be a reflection of the sampling method as much as of
the different catalysts used to make the wax.
Additional peaks were observed in the wax samples using 1H NMR. Some of
these are trivial to account for – tetramethylsilane at 0 ppm, water around 1.6-2.0 ppm
and acetone from tube cleaning at 2.15 ppm. The other peaks are more interesting and
standards, which is not surprising as they were purchased as high-purity materials
from commercial suppliers. In contrast, the FT wax samples contained small peaks
which fell into two groups – 3.2-4.2 ppm, assigned to oxygenated species, and 4.5-5.5
ppm, assigned to alkenes. It is interesting to note that the peaks were different for the
three FT wax samples. The amount of these impurities was calculated using the
following formula tot imp imp I I
H (%) 100 (8)
where Himp is the percentage of the protons in the sample which are present in the
impurity, Iimp is the integrated intensity of the impurity, and Itot is the intensity of all
the protons in the sample. The relationship to the number of functional groups of a
different type will depend on the nature of the group.
The values calculated using equation 8 are tabulated in Table 2, which show
them all to be minor phases compared with the alkane methylene and methyl protons.
This is expected as a consequence of the mechanism of the FT reaction, which is very
selective for straight chain alkanes, especially when cobalt catalysts are used46.
In order to further understand the nature of the impurities, 2D HMQC analyses
were performed on the ReCo-wax and CeCo-wax samples. This solution-state
technique allows the 1H and 13C NMR spectra to be correlated, allowing extra
information to be derived from the experiments. Figure 11(a) shows the 2D HMQC
spectrum of the ReCo-wax sample. The main peaks for methyl and methylene groups
are strongly correlated, as expected.
More interesting are the impurity peaks. The peaks at 3.3 and 3.7 ppm in the
1
H spectrum are strongly correlated with the 13C peaks at 80 and 63 ppm respectively.
were observed by 13C NMR, either in the solid state or in solution, so a group such as
–CH2-C=O is not likely to be present. The chemical shift value suggests that the
protons are directly attached to the carbon containing the oxygenate, and therefore the
two resonances are tentatively assigned to –CH(OH)- and –CH2-O-CH2- at 3.7 and
3.3 ppm respectively. The 13C chemical shift of –CH(OH)- will be lower than that of
–CH2-O-CH2- as its carbon is bonded to two other carbons and one hydrogen,
compared with two hydrogens and one carbon. Oxygenate groups are thought to arise
in FT products as a consequence of the incorporation of undissociated CO molecules
or by hydrolysis of alkene functionalities47, and both these groups would be in
agreement with this hypothesis.
The peaks at 5.0 and 5.4 ppm in the 1H spectrum are correlated to peaks in the
13
C spectrum at 160 and 130 ppm respectively, and are assigned to alkene groups. It
seems likely that the 5.0 ppm peak relates to an -carbon CH2 group and the larger
peak relates to internal CH alkene groups. There is a third peak at 5.8 ppm which may
also be alkene in origin, but is not correlated to any peaks in the 13C NMR spectrum.
This may mean that the 13C spectrum is too weak for the resonance to be observed.
The CeCo-wax was also analysed by the 2D HMQC technique (Fig. 11(b)) and
similar peaks were found for methyl and methylene peaks as the ReCo-wax. There
were also oxygenate peaks as observed in the ReCo-wax, and a large doublet at 4.7
ppm in the 1H spectrum. This peak was not correlated to any signal in the 13C
spectrum, which suggests that it may be a hydroxyl peak from an alcohol group. The
position of OH peaks in 1H NMR is known to depend strongly on the environment
Summary of results
Both the standards, Docosane and Octacosane, show straight chain
hydrocarbons with no evidence of by-products such as oxygenates or alkenes. The
waxes produced by the Fischer-Tropsch reaction show small amounts of oxygenates
and alkenes, up to 0.5 % in the ReCo-wax, 2.0 % in the Co-wax and around 3.3 % in
the CeCo-wax. The levels of minor products are tabulated in Table 2. NC was
calculated for each sample and the results are summarised in Table 1. It can be clearly
observed that for the solution-state results both standards show good agreement with
the known values.
Conclusions
It has been demonstrated that both solid-state and solution-state (1H, 13C)
NMR spectroscopy provide data that can potentially be used for characterising
hydrocarbon waxes produced by the FT reaction. In general, solution-state NMR
gives better results; however solid-state NMR provides results that are broadly
consistent with the corresponding solution-state NMR results. Similar values were
calculated for NC using both approaches, and this suggests that the carbon
composition in the solution phase is consistent with that in the solid phase, although
the effects of resolution and differential CP dynamics create relatively large
uncertainty in the 13C solid state NMR results. We have examined the method used
previously to analyse hydrocarbon fuels39 and applied a modified version of the
formula. However, our new solution-state 1H NMR method is preferred due to better
signal-to-noise ratio and quicker acquisition.
The waxes have a NC value around 20–21 by solution state 1H NMR. The
However, addition of as little as 1wt % of different promoters (Re or Ce) affects the
product distribution. The low level of minor products in the different product waxes
were characterised by the high-resolution 2D heteronuclear correlation experiment,
and were found to be oxygenates and alkenes.
In this study, the waxes were sampled across the course of a long reaction and
the product sampled by melting point, so the NC values obtained are not related to the
performance of the catalyst so much as the sampling method. This may explain why
the numbers obtained are in such a small range (NC = 20-21). However, the
differences in the minor products observed do give some indication that the promoters
change the product distribution observed. We believe that the NMR methods
presented here can be used to give a good understanding of product selectivity in the
higher carbon-number products of the Fischer-Tropsch reaction.
Acknowledgments
RJS thanks EPSRC and Johnson Matthey for funding for an industrial CASE
studentship. AW thanks BBSRC and NSERC for a post-doctoral fellowship. EPSRC
and the University of Warwick are thanked for partial funding of NMR equipment.
Drs B. Moore and L. Ashfield (Johnson Matthey Technology Centre) are thanked for
preliminary 1D solution-state NMR spectra as well as useful discussion. Work
between Warwick and Johnson Matthey is also funded through KTP programme
References
1. M. E. Dry, Catal. Today 71, 227 (2002).
2. M. E. Dry, Appl. Catal. A 276, 1 (2004).
3. B. Shi, R. A. Keogh and B. H. Davis, J. Mol. Catal. A 234, 85 (2005).
4. H. Schulz, Appl. Catal. A 186, 3 (1999).
5. J. Cheng, X. -Q. Gong, P. Hu, C. M. Lok, P. Ellis and S. French, J. Catal. 254,
285 (2008).
6. S. Storsaeter, D. Chen and A. Holmen, Surf. Sci. 600, 2051 (2006).
7. G. Jacobs, J. A. Chaney, P. M. Patterson, T. K. Das and B. H. Davis, Appl.
Catal. A 264, 203 (2004).
8. M. D. Shannon, C. M. Lok and J. L. Casci, J. Catal. 249, 41 (2007).
9. S. Vada, A. Hoff, E. Ådnanes, D. Schanke and A. Holmen, Top. Catal. 2, 155
(1995).
10. A. Moen, D. G. Nicholson, B. S. Clausen, P. L. Hansen, A. Molenbroek and
G. Steffensen, Chem. Mater. 9, 1241 (1997).
11. D. A. I. Xiaoping, Y. U. Changchun, L. I. Ranjia, S. H. I. Haibo and S. H. E.
N. Shikong, Chin. J. Catal. 27, 904 (2006).
12. I. N. Yates, and C. N. Satterfield, Energy & Fuels 6, 308 (1992).
13. H. Kessler and H. –O. Kalinowski, Angew. Chem. Internat. 9, 641 (1970).
14. D. Purdela, J. Magn. Reson. 5, 37 (1971).
15. H. G. Kuivila, J. L. Considine, R. H. Sama and R. J. Mynott, J. Organomet.
Chem. 111, 179 (1976).
16. C. I. Ratcliffe and J. A. Ripmeester, J. Phys. Chem. 90, 1259 (1986).
18. J. -M. Dereppe, J. -P. Boudou, C. Moreaux and B. Durand, Fuel 62, 575
(1983).
19. Y. H. Chin, C. Zhang, P. Wang, P. T. Ingefield, A. A. Jones, R. P. Kambour,
J. T. Bendler and D. M. White, Macromol. 25, 3031 (1992).
20. M. Hervé, J. Hirschinger, P. Granger, P. Gilard, A. Deflandre and N. Goetz,
Bioch. Biophy. Acta 1204, 19 (1994).
21. A. Pines, M. G. Gibby and J. S. Waugh, J. Chem. Phys. 56, 1776 (1972).
22. A. Pines, M. G. Gibby and J. S. Waugh, J. Chem. Phys. 59, 569 (1973).
23. K. J. D. MacKenzie and M. E. Smith, p 85, Mulitinuclear Solid-state NMR of
Inorganic Materials, (Pergamon, Amsterdam, 2002).
24. E. R. Andrew, A. Bradbury and R. G. Eades, Nature 183, 1802 (1951).
25. I. J. Lowe, Phys. Rev. Lett. 2, 285 (1959).
26. R. J. Abraham, J. Fisher and P. Loftus, Introduction to NMR Spectroscopy,
(Wiley, New York, 1988).
27. A. –U. Rahman, p10, Nuclear Magnetic Resonance – Basic Principles,
(Springer – Verlay, New York, 1986).
28. P. A. Mirau, p22, A practical guide to understanding the NMR of polymers,
(Wiley, New York, 2005).
29. J. C. C. Freitas, F. G. Emmerich, G. R. C. Cernicchiaro, L. C. Sampaio and T.
J. Bonagamba, Sol. Stat. Nucl. Magn. Reson. 20, 61 (2001).
30. R. K. Harris, NMR and the Periodic Table, (Academic Press, London, 1978).
31. E. Breitmaier, 13C NMR Spectroscopy, (Harwood academic publishers, Chur,
1984).
32. R. Bates, Carbon-13 NMR Spectral Problems, (The Humana Press, Clifton,
33. J. Homer and M. C. Perry, J. Chem. Soc. Chem. Commun. 4, 373 (1994).
34. J. Homer and M. C. Perry, J. Chem. Soc. Perkin. Trans. II 4, 533 (1995).
35. L. Müller, J. Am. Chem. Soc. 101, 4481 (1979).
36. G. E. Martin and R. C. Crouch, J. Natural Products 54, 1 (1991).
37. K. D. Bartle, D. W. Jones, and H. Pakdel, Molecular Spectroscopy, (Heydon,
London, 1976).
38. D. A. Netzel, Synthetic Fuels from Oil Shale Symposium, Atlanta, p 271, (Dec
1979).
39. D. J. Cookson and B. E. Smith, Anal. Chem. 57, 864 (1985).
40. D. J. Cookson and B. E. Smith, Fuel 68, 776 (1989).
41. S. Kumar, S. P. Nautiyal, H. U. Kahn, K. M. Agrawal and J. K. Dimri, Petrol.
Sci. Tech. 23, 939 (2005).
42. Ö.L. Gülder, B. Glavinčesvski, Ind. Eng. Chem. Prod. Res. Develop. 25, 153
(1986).
43. D. Massiot, F. Fayon, M. Capron, I. King, S. Le Calvé, B. Alonso, J. -O.
Durand, B. Bujoli, Z. Gan, and G. Hoatson, Magn. Reson. Chem. 40, 70
(2002).
44. C.G. Visconti, E. Tronconi, L. Lietti, R. Zennaro and P. Forzatti, Chem. Engr.
Sci., 62, 5338 (2007)
45. J. Gaube and H.-F. Klein, “Studies on the Reaction Mechanism of the
Fischer-Tropsch Synthesis: Co Feeding Experiments and the Promoter Effect of
Alkali”, Advances in Fischer-Tropsch Synthesis, Catalysts and Catalysis, B.H.
Davis and M.L. Occelli (eds), CRC Press, Boca Raton, FL, USA, 2010, pp.
199-214.
47. J. Cheng, P. Hu, P. Ellis, S. French, G. Kelly and C.M. Lok, J. Phys. Chem. C,
Figure captions
Figure 1. Labelling of CHn groups.
Figure 2.Solid-state 13C CP MAS NMR spectra of the standard Docosane (C22H54) taken at a field of 7.05 T, with contact times of 1 and 4 ms.
Figure 3. An expansion, between 10–45 ppm, of the solid-state 13C CP/MAS NMR spectrum and fit of the standard Docosane, taken at 7.05 T with a contact time of 4 ms and MAS frequency of 15 kHz. The spectrum is shown in blue and overall fit is shown in red.
Figure 4. 13C solution-state NMR spectra of the standards Docosane (C22H46) and Octacosane (C28H58) taken at a field of 6.35 T.
Figure 5.13C CP/MAS NMR spectrum of the Co-wax taken at a field of 14.1 T with contact time 1 ms and MAS frequency of 10 kHz, and 13C NMR solution-state spectrum of the Co-wax taken at a field of 6.35T.
Figure 6. 13C CP MAS NMR spectra at a field of 7.05 T, with contact times of 1 and 4 ms, and solution-state NMR spectra at a field of 6.35 T for (a) ReCo-wax and (b) CeCo-wax.
Figure 7. Solution-state 13C PENDANT NMR spectra taken at 11.75 T of (a) ReCo-wax and (b) CeCo-ReCo-wax.
Figure 8. 1H MAS NMR spectrum obtained at 14.1T with spinning at 30 kHz of (a) ReCo-wax and (b) CeCo-wax.
Figure 9. 1H solution-state NMR spectra taken at a field of 6.35 T of (a) octacosane (C28H58), (b) docosane (C22H46) and the Co-wax.
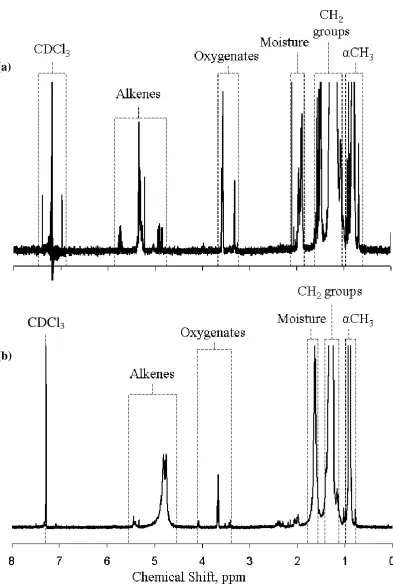
Figure 10. Solution-state 1H NMR spectra taken at a field of 11.75 T of (a) ReCo-wax and (b) CeCo-ReCo-wax.
Figure 1. Labelling of CHn groups.
Figure 6. 13C CP MAS NMR spectra at a field of 7.05 T, with contact times of 1 and 4 ms, and solution-state NMR spectra at a field of 6.35 T for (a) ReCo-wax and (b) CeCo-wax.
(a)
Figure 7. Solution-state 13C PENDANT NMR spectra taken at 11.75 T of (a) ReCo-wax and (b) CeCo-ReCo-wax.
(a)
Figure 8. 1H MAS NMR spectrum obtained at 14.1T with spinning at 30 kHz of (a) ReCo-wax and (b) CeCo-wax.
(a)
Figure 9. 1H solution-state NMR spectra taken at a field of 6.35 T of (a) octacosane (C28H58), (b) docosane (C22H46) and the Co-wax.
(a)
(b)
Figure 10. Solution-state 1H NMR spectra taken at a field of 11.75 T of (a) ReCo-wax and (b) CeCo-ReCo-wax.
(a)
CDCl
3 [image:30.595.100.494.82.669.2]Figure 11. 2D HMQC correlation NMR spectra taken at a field of 11.75 T of (a) ReCo-wax and (b) CeCo-wax. The x-axis displays the 1H spectra and the y-axis displays the 13C spectra.
[image:31.595.109.482.378.635.2]Tables
Table 1. Summary of results of the calculated values for NC for a range of hydrocarbon waxes calculated using solution-state 1H NMR.
Sample NC calculated using solution-state NMR (± 0.5)
Docosane (C22H46) 22.4
Octacosane (C28H58) 28.4
Co-wax 20.0
ReCo-wax 21.4
[image:32.595.91.507.155.263.2]CeCo-wax 21.0
Table 2. Summary of the calculated concentrations of olefins and oxygenates in the waxes. The values were calculated using solution state 1H NMR.
Sample Olefins / mol% Oxygenates / mol%
Docosane (C22H46) - -
Octacosane (C28H58) - -
Co- wax 0.43 1.63
ReCowax 0.46 0.35
[image:32.595.88.508.317.423.2]