Planning the asphalt paving and compaction process The alignment between paver output, roller capacity and available tme for compaction
24
0
0
Full text
(2) When considering the above, it is highly remarkable that the current working methods in road construction are often based on tacit knowledge, experience and craftsmanship, as frequently demonstrated by research conducted by the ASPARi reseach unit. Operators work on the basis of gut feeling and based on experience gained in previous projects [Dorée and to Huerne, 2006] [Simons & to Huerne, 2008] [Miller, 2010] [Bijleveld, 2015]. Research of Bijleveld [2015] has demonstrated that a wide variability exists in important parameters of the asphalt construction process and in operational practices and that operational instructions for the asphalt crew are unclear or even missing. In order to improve the current operational working methods as used on-site and to reduce variability and increase consistency, it is necessary to work more on basis of explicit operational strategies instead of on tacit knowledge [Bijleveld, 2015]. In order to achieve this, it is necessary to identify the relevant operational parameters and to examine the relationships between these parameters [Simons & ter Huerne, 2008]. By reducing the variability and increasing the uniformity/consistency and continuity during the construction process, it is likely that this will result in an improved final quality of the asphalt layer [Bijleveld, 2015]. An uniform and continuous paving process is a prerequisite for a good quality asphalt layer [Asphalt Institute, 1989] [Bijleveld, 2015]. This in turn requires a proper work preparation and organization of the paving process. An alignment between the four traditional phases of the asphalt construction process – production, transport, paving and compaction – is essential [VBW Asfalt, 2000]. However, this can be a complex task because of the fact that many (operational) variables have to be taken into account. Nevertheless, the speed of the paver appears to be a good indicator for the degree of continuity in the paving process [Bijleveld, 2015]. A key issue in determining the speed of the paver is to consider the available roller capacity and making sure the roller capacity will not be exceeded [Bijleveld, 2015]. If the output of the paver exceeds the roller capacity, the roller or rollers will fall behind on the paver. On the other hand, if the roller output exceeds the paver output, the roller(s) will catch up the paver [Simons, 2007]. Both situations affect the consistency of the paving process negatively. Ideally, the paver output rate equals the roller output rate [Floss, 2001]. Another issue that complicates the planning and execution of the paving and compaction process, is the fact that the temperature of the asphalt layer decreases under influence of several environmental factors. This makes that roller operators have a limited period of time in which the compaction process has to be performed [Miller, 2010] [Vasenev, Bijleveld, Hartmann & Dorée, 2012]. According to Kari [1967] as cited by [Miller, 2010], two problems can occur during the compaction of asphalt mixtures. An asphalt mixture can be overstressed (often at too high temperatures) or the mixture can be understessed (often at too low temperatures). In an overstressed situation, a lack of stability of the asphalt layer results in the situation that the layer cannot support the weight of the rolls, while in a understressed situation the compaction force is too low to increase the density of the of the asphalt mixture. Thus, this results in an optimal temperature and time interval. Considering the relationships that exist between optimal compaction, available time for compaction and the quantity of asphalt to be compacted (in m2 or tonnes) as a result of the paver and roller output rate, choices have to be made regarding the number, type, dimensions and sequence of rollers and roller speed [VBW Asfalt, 2000]. For the compaction process, multiple roller types are available and various rolling procedures or strategies can be applied, also depending on the geometry of the road [VBW Asfalt, 2000] [Vasenev, 2015]. However, currently the selection of working methods and equipment allocation is largely based on experience [Simons & ter Huerne, 2008], while the choices made will have a major impact on the final quality of the asphalt layer. By making the selection procedure of working method 2.
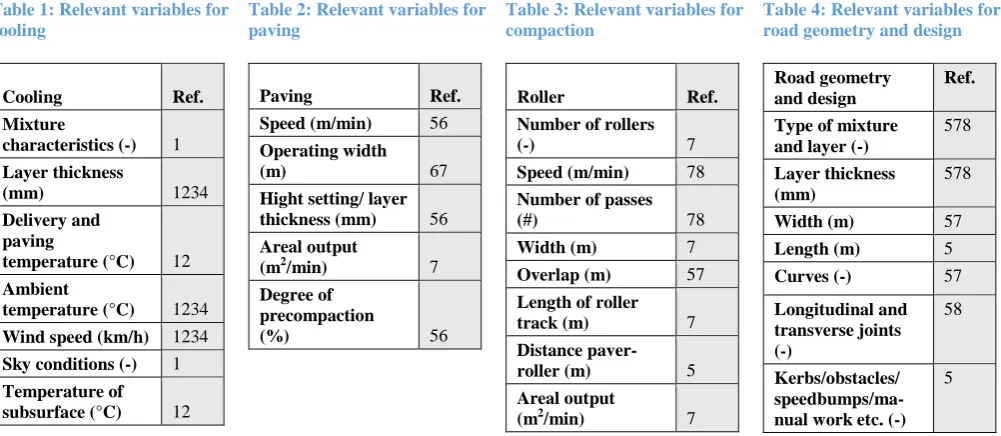
(3) and equipment allocation more explicit, this can contribute to the further professionalization of the road construction sector. In conclusion; Roller operators have to accomplish the asphalt compaction process within a limited time and temperature interval. In order to deliver a good quality asphalt layer, roller operators should use this time interval as good as possible. However, until now, less is known how this time interval should be used in an effective and efficient, but also in a consistent manner with respect to operational variables such as paver speed, number of rollers, type of rollers, average roller speed, characteristics of the road to be constructed and the relevant relations between these variables. This lack of knowledge complicates the tactical planning of equipment to be used and the operational compaction strategy to be followed for each specific construction project. This paper presents a method to align the paver output with the roller capacity based on various operational variables and taking the available time for compaction into account. When paver output and roller capacity are aligned, this will result – at least theoretically – in a more uniform and continuous paving and compaction process. The method should help planners with decisions regarding the number of rollers required and with generating and operational strategies in terms of different values for different operational variables, which in turn the machine operators can apply in their machine settings. This article is structured in the following way; After this introduction, the objective and approach of this research are described. The third section presents the results of the literature study on relevant variables of the compaction process and the relations between these variables. Section four describes the alignment procedure, which can be seen as the result of this research. The paper concludes with the discussion and conclusions in section five and six respectively. 2. Objectives and approach The objective of this research was to set up a supportive method which can help decision making in the field of equipment allocation and operational compaction strategies to be followed, such that an asphalt layer – given the prevailing conditions at the construction site – can be compacted efficiently and uniformly within the limited time interval. Overall, the aim was to give more insight in the different relevant operational variables and to improve the understanding of the relations between these variables. If these relations are well understood, the consequences for the paving and compaction process can be assessed when values of the different variables are altered. In order to achieve the objective of this research, relevant variables of four aspects of the asphalt construction process (cooling of asphalt and characteristics of paver, roller and road geometry/design) have been defined based on a literature study. Subsequently, the relations between these variables have been defined both qualitatively and quantitatively. Based on these variables and relations, together with some basic characteristics of the asphalt construction process, a basic planning procedure has been defined. Basically, this planning procedure serves as a decision support model. 3. Relevant variables and relations Based on a literature review, this section describes the most relevant variables and characteristics on four aspects of the asphalt construction process. The variables are presented in Table 1, 2 3 and 4. The variables influencing the cooling of the asphalt layer can be categorized into three categories; Mixture characteristics, weather conditions and subsurface conditions. All paver variables defined can be chosen/adjusted (within the limits) by the paver operator. The same applies for the variables of the roller, except for the roller width. All characteristics of the road geometry are set during the design phase and cannot be changed 3.
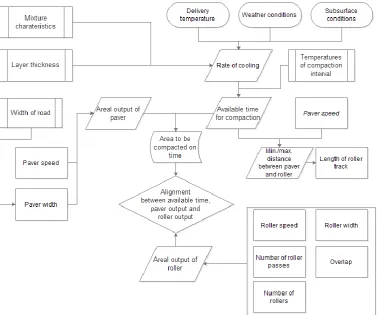
(4) during the construction phase. However, the road design will affect the method of construction in terms of roller patterns [Floss, 2001], mechanic or manual spreading of the mixture [Simons, 2007], and other operational settings of the equipment. Also, it is likely that this in turn will affect the output rate of both the paver and the roller. Table 1: Relevant variables for cooling. Cooling. Ref.. Mixture characteristics (-). 1. Layer thickness (mm). 1234. Table 2: Relevant variables for paving. Paving Speed (m/min). Table 3: Relevant variables for compaction. Ref. 56. Table 4: Relevant variables for road geometry and design. Ref.. Road geometry and design. Ref.. Roller Number of rollers (-). Type of mixture and layer (-). 578. 7. Operating width (m). 67. Speed (m/min). 78. 578. Hight setting/ layer thickness (mm). 56. Number of passes (#). Layer thickness (mm). 78. Width (m). 57. 12. Areal output (m2/min). Width (m). 7. Length (m). 5. 7. Ambient temperature (°C). Overlap (m). 57. Curves (-). 57. 1234 1234. Length of roller track (m). 7. Sky conditions (-). 1. Distance paverroller (m). Longitudinal and transverse joints (-). 58. Wind speed (km/h). Degree of precompaction (%). 5. 12. 7. Kerbs/obstacles/ speedbumps/manual work etc. (-). 5. Areal output (m2/min). Delivery and paving temperature (°C). Temperature of subsurface (°C). 56. 1= [NCAT, 1996] , 2 = [Bijleveld, 2010], 3 = [VBW Asfalt, 2000], 4 = [Asphalt Institute, 1989], 5 = [Simons, 2007], 6 = [Fischer & Schug, 2012], 7 = [Floss, 2001], 8 = [ Schröder, 2010].. The variables as defined in Table 1 to 4 are related to each other in a greater or lesser extent. In Figure 1 these relationships are illustrated. For example; the areal output of the paver is influenced by the paver speed and the paver width. The paver width in turn is influenced by the width of the road to be constructed. In the center of the figure, the symbol representing the alignment between available time for compaction, paver output and roller output is placed. In section 4, the relations are defined quantitatively.. 4.
(5) Figure 1: Relations between relevant variables. 4. Basic setup of the planning procedure The leading factor; paver or roller(s)? In the planning/preparation phase, the method for aligning the paver output with the roller output can be applied in two different ways, as can be seen from Figure 1. From two sides, arrows lead to the ‘alignment symbol’. One has to make a choice what will be the leading factor in the model. The first option is to take the paver output as the leading factor. I.e. theoretically the speed of the paver can be chosen freely, without any constraints. As a consequence, the operational values of the roller variables (speed and length of the roller track) will be imposed values in order to match the roller output with the paver output. If the paver speed is decided to be leading, one should critically examine whether the intended roller equipment allocation (in most cases the standard roller set) offers sufficient capacity. If not, an extra roller should be allocated to the project. However, availability and cost aspects have to be taken into account as well. The second option is to take the roller output as the leading factor. In this case, the speed of the roller(s) can be chosen freely, without any (theoretical) constraints. As a result, the speed of the paver will have an imposed value. However, in this case one should critically examine whether the productivity targets will be met. It can debated what the most favourable option is. In general, two rationales have to be balanced. One can increase the paver speed at the costs of the extra resources needed (extra roller, operator, fuel etc.) (rationale underlying option 1) or one can deliberately limit the roller capacity and thus decreasing the paver speed, which may result in a reduced productivity (rationale underlying option 2). For each specific project both options have to be assessed. 5.
(6) If the alignment calculation has to be made on-site just before the paving and compaction process starts, always method 2 should be applied. This due to the fact that the roller capacity is fixed at this moment. The six steps of the alignment procedure The core of the alignment method is formed by a number of formulas. Floss [2001] drafted five rather simple formulas (form. 1-5), which express most of variables and relationships as defined in section 3 quantitatively. By applying these formulas, the paver output and roller output can be calculated. In order to plan a uniform compaction process, the basic thought is that values should be selected in such a way that the output of the paver equals the output of the roller or rollers. This alignment procedure comprises six steps. The first 4 steps are of general nature and have to applied for both option 1 and option 2. Starting from step 5, one has to choose whether to follow option 1 or 2. To assist planners in applying the alignment procedure, an Excel-based interface has been created, in which all relevant formulas are predefined. Thus, planners only have to insert values for a limited number of variables. This increases usability and decreases the time required for applying the method. In the following section, the six steps are explained in more detail. For purposes of illustration, for each step the Excel-based interface is presented. It should be noted that the variables presented on the interface screenshots serve as an example. Step 1: Definition of type of layer, asphalt mixture and layer thickness The first step comprises the definition of general characteristics of the asphalt layer. This includes the selection of layer type (base, binder or surface layer), type of asphalt (asphalt concrete, stone mastic asphalt or porous asphalt) and layer thickness (normally in the range of 20 mm to 90 mm, with 5 mm intervals).. Step 2: Definition of compaction phase and required number of roller passes In the second step, the different compaction phases have to be taken into account, as the alignment has to be made for each of the three compaction phases. The three compaction phases are; breakdown rolling, intermediate rolling and finishing rolling. Each compaction phase is characterized by a specific temperature interval range. [Mansell, 2016] [Bijleveld, 2015]. The temperature boundaries have to be known in order to calculate the available time for compaction for that specific roller phase. Step 2 also comprises the definition of the required number of passes, taking the characteristics as defined step 1 into account. The required number of passes should be determined with the help of the Quality Control department, by taking nuclear density readings after each roller pass [Mansell, 2016]. When determining the required number passes, the type of roller and operation mode have to be taken into account [Floss, 2001]. This 6.
(7) makes the presented method an iterative process, as the type of roller is defined in step 3 and the operation mode in step 5.. Step 3: Definition of roller type to be used In the third step, the type of roller per specific roller phase must be specified. In particular, the operating width of the roller has to be known, as this variable is required for calculating the roller output rate.. . Step 4: Determining the available time for compaction (e.g. with aid of PaveCool) In the fourth step the available time for compaction has to be determined, e.g. with the aid of the PaveCool software tool (developed by Chadbourn et al. [1998]). This tool requires among others weather forecast data input. The available time for compaction should be determined based on the maximum and minimum compaction temperatures for that particular compaction phase. Also, the delivery temperature should be taken into account.. Step 5a – option 1: Calculation of operational roller variables Step five encompasses the calculation of the roller speed and the length of the roller track, given the assumption the machine output is leading. This can be done by applying the formulas below. The premise is that Fm,o = Fw,o. These formulas and premise are implemented in the Excel-based interface.. 7.
(8) 1. 𝐹𝑚,𝑜 = 𝐵 ∗ 𝑣𝑚 ∗ 𝑓𝑛 𝑏𝑒𝑓𝑓 ∗ 𝑣𝑤 ∗ 𝑓𝑛 𝑛 𝐵 = 𝑁. 5.. 𝐿=. 𝑇 ∗ 𝑣𝑤 𝑛 ∗ 𝑁. (𝑇𝑏 − 𝑇𝑚𝑎𝑥𝑣 ) ∗ 𝑣𝑚 𝐶 (𝑇𝑏 − 𝑇𝑚𝑖𝑛𝑣 ) = ∗ 𝑣𝑚 𝐶. 2.. 𝐹𝑤,𝑜 =. 6.. 𝑋𝑚−𝑤,𝑚𝑖𝑛 =. 3.. 𝑏𝑒𝑓𝑓. 7.. 𝑋𝑚−𝑤,𝑚𝑎𝑥. 𝐵 4. 𝑁 = 𝑏∗0,9. Factor 0,9 due to overlap with previous roller track. Fm,o = Areal output of paver (m2/min) B = Operating width of paver (m) vm = Average speed of paver (m/min) fn = Efficiency factor (-) Fw,o = Areal output of one roller (m2/min) beff = Effective roller width (m) vw = Average speed of roller (m/min) n = Number of roller passes (-). L = Length of roller track (m) T = Time available for compaction (min) Xm-w,min = Minimal distance between paver and roller (m) Tb = Temperature of asphalt behind screed (°C) Tmaxv = Maximum asphalt temperature of compaction window (°C) C = Average cooling rate of asphalt (°C/min) Xm-w,max = Maximum distance between paver and roller (m) Tminv = Minimum asphalt temperature of compaction window (°C). N = Number of parallel roller tracks (-). For the initial estimation of the desired paver speed, a planner should know the length of the road and the time available for the paving process. E.g., if a road with a length of 1500 meters should be paved within 5 hours, the desired average paver speed is 5,0 meters per minute. Based on the desired paver speed, paver operating width and expected efficiency factor for paving, the average roller speed and length of the roller track can be calculated, given the expected efficiency factor for rolling. Efficiency factors for paving are introduced to capture the effect of decreasing paver speed as a result of changing trucks in front of the hopper or as a result of complex road designs (i.e. maneuvering the paver). Efficiency factors for rolling are introduced to capture the effect of changing direction laterally and transversally. Paver speed are generally expressed in meters per minutes, while the roller speeds on machine displays are expressed in kilometers per hour. However, to be consistent, roller speeds are expressed in meters per minute too.. Step 5b – option 2: Calculation of operational paver speed 8.
(9) Step five encompasses the calculation of the paver speed, given the assumption the roller output is leading. This can be done by applying the formulas as presented above. Again, the premise is that Fm,o = Fw,o. These formulas and premise are implemented in the Excelbased interface.. Step 6: Assess model output on operational boundary conditions The final step in the procedure is to assess whether the calculated values are within the interval boundaries of possible values. E.g. if the calculated speed is lower than the maximum operational speed. Criteria can be defined on minimum and maximum paver and roller speeds and minimum length of the roller tracks. If criteria are not met, output rates have to be adjusted or extra capacity has to be allocated, thus applying step 5a or 5b again. Also, one has to check whether the output rates of both paver and roller(s) are equal.. 5. Discussion and future research Although we succeeded in drafting a method which can help planners with decisions regarding roller equipment allocation and with generating operational compaction strategies in terms of paver and roller speeds and lengths of the roller tracks and, there are still various points to address. For simplicity, the method as drafted assumes a standard, fixed rolling pattern. This pattern neglects the time required for changing between the transverse parallel roller tracks and between the longitudinal road sections. Thus, in fact the method overestimates the roller 9.
(10) output. Also, it can be debated if and to which extent this pattern is followed under all circumstances. First visual observations confirm this pattern is followed to a great extent, especially on the straight sections. However, additional research could be devoted to the patterns followed on non-standard sections. Aditionally, it is interesting to find out whether operators wield different rolling patterns during the three different compaction phases. At this time, no financial aspects are included in the planning/alignment method. However, when operational costs (e.g. costs of operator/crew, fuel usage, depreciation, transport etc.) are included in the method, one can assess the financial impacts of choices made. This in turn allows further optimization of the paving and compaction process, as benefits and costs of increased productivity can be calculated and balanced. E.g. a planner can calculate if it is beneficial to allocate an extra roller to the project and whether this will result in reduced overall costs as a result of the increased productivity rate. Moreover, if (weather) conditions for paving and compaction are perceived as not that critical (e.g. high ambient temperatures, low wind speeds, thick layers etc.), a planner can decide to allocate less roller capacity that normal in order to reduce operational costs. Thus, he can balance the risk (and consequences) of an insufficient degree of compaction against reduced operational costs. However, one should not forget that final quality always prevail costs. Thus, including operational costs in the method seems beneficial. To achieve this, future research should focus on categorization and quantification of all relevant operational costs. In order to conduct planning calculations, a planner should be thoroughly acquainted with operational values for paver speeds, roller speeds, number of roller passes and efficiency factors under all possible circumstances (e.g. type of layer, roller phase, road geometry etc.). Only then a planner is able to generate realistic and meaningful paving and compaction strategies. Notwithstanding the fact that some general operational values for general conditions are known in literature (see e.g. [Floss, 2001][Schröder, 2010][Fischer and Schlug, 2012]), further research effort should be devoted to this issue in order to create insights in operational values under specific conditions. The proposed method appears appropriate for planning the asphalt paving and compaction process. However, the main drawback of the presented alignment method has to be addressed. The main drawback of the proposed method is that it only generates single average values to target for during the entire paving and compaction process (on the assumption that the road geometry does not change). Thus, one average paver speed, one average roller speed and one length of the roller track, given the average speeds. However, as a result of the complex interactions with other phases of the asphalt construction process (asphalt production and transport), large variation in operational variables can be expected while the presented method is based on single average values only. Working using single average values also suggests that variation is allowed to a greater or lesser extent as long as the planned average values are achieved. However, good average results over the entire road section do not immediately imply good results on each subsection of the road. Therefore, when aiming for consistent process, one has not only to plan the process, but also to monitor the process on regular interval scale. Future research effort should be devoted to the monitoring of the paving and compaction process. 6. Conclusions A uniform and continuous paving process is a prerequisite for a good quality asphalt layer. This in turn requires a proper work preparation and organization of the paving process. However, currently the selection of working methods and equipment allocation is largely based on experience, while the choices made will have a major impact on the final quality of the asphalt layer. By making the selection procedure of working method and equipment. 10.
(11) allocation more explicit, this can contribute to the further professionalization of the road construction sector. This paper has described a method which can help planners with making decisions regarding the number of rollers required and with generating and evaluating operational strategies in terms of different values for different operational variables, based on the alignment between the paver output and the roller output. When paver output and roller capacity are aligned, this will result – at least theoretically – in a more uniform and continuous paving and compaction process. The method comprises six steps, and one has to make the decision whether either the paver output or the roller output will be the leading factor. The method must be applied for each of the three compaction phases and has an iterative character. The first step focuses on the definition of layer characteristics. The second step encompasses the definition of the roller phase and required number of roller passes. In the third step the roller type is stipulated, while in the fourth step the available time for compaction has to be calculated e.g. by means of the PaveCool tool. In the fifth step the operational values for both paver and rollers are defined and calculated. The last step encompasses the assessment of the model output on operational boundary conditions. In order to assist planners in applying the alignment procedure, an Excel-based interface has been created, in which the calculations required for each step are predefined. Thus, planners only have to insert values for a limited number of variables. This increases usability and decreases the time required for applying the method. As mentioned earlier, the proposed method appears appropriate for planning the asphalt paving and compaction process. However, various aspects require further consideration. These include the assumed rolling pattern and extension of the method with financial aspects, yet the most important aspect is the monitoring of paving and compaction processes. The planning method is based on single average operational values, while during the actual paving and compaction process, variation in operational values can be expected. Good average results over the entire road section do not immediately imply good results on each subsection of the road. Therefore, when aiming for a consistent process, one has not only to plan the process, but also to monitor the process on regular interval scale. Future research effort should be devoted to the monitoring of the paving and compaction process. The data gathered during actual paving and compaction process can serve as a starting point for future planning calculations. 7. Acknowledgements I would like to acknowledge André Dorée and Seirgei Miller (University of Twente/ASPARi) and Marco Oosterveld (BAM Infra Asfalt) for their feedback, help and general support during this research project and also for giving me the opportunity to conduct this research at the BAM Infra construction company. 8. References Asphalt Institute. (1989). The Asphalt Handbook. Lexington, KY: Asphalt Institute. Bijleveld, F.R. (2010). Asfaltwegenbouw, op weg naar professionalisering - Op basis van mechanische eigenschappen het bepalen van temperatuur‐ entijdsvensters voor het verdichten van Nederlandse asfaltmengsels. Enschede, Nederland: Universiteit Twente. MSc Thesis, 2010. Bijleveld, F.R. (2015). Professionalising the asphalt construction process - Aligning information technologies, operators' knowledge and laboratory practices. Enschede, Nederland: Universiteit Twente. PhD Thesis, 2015. Chadbourn, B., Newcomb, D., Voller, V., Desombre, R., Luoma, J., & Timm, D. (1998). An asphalt paving tool for adverse conditions. St. Paul: Minnesota Department of Transportation.. 11.
(12) Dorée, A.G., & ter Huerne, H.L. (2006). Professionalisering asfaltwegenbouw sector; van ambacht naar industrie. Dorée, A.G., Miller, S.R., & ter Huerne, H.L. (2008). Asfalt, wat bakken we ervan? CROW Infradagen, 25-26 juni 2008. Delft. Fischer, A., & Schug, R. (2012). Vögele Booklet on Paving. Ludwigshafen: Joseph Vögele AG. Floss, R. (2001). Compaction technology in earthwork, highway and transportation engineering Volume 1 Basic principles of vibratory compaction, compaction of soil and rock, compaction of asphalt. Boppard: BOMAG GmbH. Hartmann, A. (2015, April 20). Infrastructure Management lecture sheets. Importance of infrastructure and infrastructure management. Enschede: Universiteit Twente. Klatter, L., Vrouwenvelder, T., & van Noortwijk, J.M. (2009). Societal and reliability aspects of bridge management in the Netherlands. Structure and Infrastructure Engineering, 5(1), 11-24. Mansell, T. (2016). A practical approach to managing density. World of Asphalt Show and Conference, 24th March. Nashville, TN.. 22-. Miller, S.R. (2010). Hot Mix Asphalt Construction - Towards a more professional approach. Enschede: Universiteit Twente. PhD Thesis, 2015. NCAT. (1996). Hot Mix Asphalt Materials, Mixture Design and Construction. Lanham, Maryland: National Center for Asphalt Technology. Schröder, R. (2010). Compaction in asphalt construction and earthworks. Tirschenreuth: HAMM AG. Simons, B. (2007). Op weg naar een beheerst asfaltverwerkingsproces. Enschede: Universiteit Twente. MSc Thesis 2007. Vasenev, A. (2015). Visualizing Asphalt Roller Trajectories in Context - Acquiring, Processing and Representing Sensor Readings. Enschede: Universiteit Twente . PhD Thesis, 2015. Vasenev, A., Bijleveld, F., Hartmann, T., & Dorée, A.G. (2012). A real-time system for prediction cooling within the asphalt layer to support rolling operations. 5th Eurasphalt & Eurobitume Congress 13-15th June. Istanbul. VBW-Asfalt. (2000). Asfalt in wegen- en waterbouw. Breukelen: Vereniging tot Bevordering van Werken in Asfalt.. 12.
(13) Monitoring the asphalt construction process Towards more consistent paving and compaction operations Christiaan G. Arbeider Master’s programme Civil Engineering and Management, Faculty of Engineering Technology, University of Twente, Enschede, The Netherlands. Abstract: A uniform and continuous asphalt construction process is a prerequisite for a good quality asphalt layer. In practice, this implicates that the paver output rate should be aligned with roller output rates/roller capacity. In earlier work, a method for planning and aligning the paving and compaction process has been developed. But when aiming for a consistent process, one has not only to plan the process, but also to monitor the process on regular interval scale. The aim of this research was to evaluate actual asphalt construction projects on consistency/uniformity in terms of the degree of alignment between paver and roller over the entire road section. Based on literature review, a framework for monitoring and evaluating the paving and compaction process on operational level has been developed. Using this framework, 12 asphalt construction projects have been monitored. Data on road geometries, paver speed, roller speed and number of roller passes have been collected with aid of several systems. Based on this data, output rates have been calculated. Evaluation of data indicate large variability in output rates during the whole process, especially during the paving and compaction of the first 200-500 meters asphalt. In conclusion; applying the drafted method on interval scale seems an appropriate method for monitoring and evaluating the paving and compaction process and for steering it towards an consistent process. However, future research effort is required to improve the framework with respect to accuracy, automatization, real-time steering, continued data collection and validation of monitoring framework in combination with the planning method. Keywords: Road construction, monitoring, asphalt compaction, roller capacity, roller output, paver output, asphalt cooling 1. Introduction Since the 90s innovative contract types have emerged in the Dutch construction industry. These innovative contract types are (among others) characterized by longer warranty periods guaranteed on the work delivered by the contractor [Dorée, Miller, & ter Huerne, 2008]. Since contractors will be liable for defects noticed within the warranty period, they have to professionalize their operations and improve process and quality control during the construction phase [Bijleveld and Dorée, 2014]. It is the construction phase in which the desired quality of the asphalt layer is realized or not [Dorée, Miller, & ter Huerne, 2008] [Bijleveld, 2015]. When considering the above, it is highly remarkable that the current working methods in road construction are often based on tacit knowledge, experience and craftsmanship, as frequently demonstrated by research conducted by the ASPARi reseach unit. Operators work on the basis of gut feeling and based on experience gained in previous projects [Dorée and to Huerne, 2006] [Simons & to Huerne, 2008] [Miller, 2010] [Bijleveld, 2015]. Research of Bijleveld [2015] has demonstrated that a wide Corresponding author. Tel.: +31(0)681570148. E-mail adress: [email protected]. 1.
(14) variability exists in important parameters of the asphalt construction process and in operational practices and that operational instructions for the asphalt crew are unclear or even missing. In order to improve the current operational working methods as used on-site and to reduce variability and increase consistency. By reducing the variability and increasing the uniformity/consistency and continuity during the construction process, it is likely that this will result in an improved final quality of the asphalt layer [Bijleveld, 2015]. A uniform and continuous paving process is (thus) a prerequisite for a good quality asphalt layer [Asphalt Institute, 1989] [Bijleveld, 2015]. This in turn requires a proper work preparation and organization of the paving process. An alignment between the four traditional phases of the asphalt construction process – production, transport, paving and compaction – is essential [VBW Asfalt, 2000]. However, this can be a complex task because of the fact that many (operational) variables have to be taken into account. In a first step to assist in this complex task, in earlier work a method has been proposed for aligning the paving and compaction process, also taking the available time for compaction into account [Arbeider, 2016]. The method comprises six steps and can assist planners in making decisions regarding roller equipment allocation and in generating operational compaction strategies, based on aligned both paver and roller output rates. The drafted method seems an appropriate method for planning the paving and compaction process. However, the method is based on single average operational values, while during the actual paving and compaction process, variation in operational values can be expected. Good average results over the entire road section do not immediately imply good results on each subsection of the road. Therefore, when aiming for a consistent process, one has not only to plan the process, but also to monitor the process on regular interval scale. In this light, for this research project 12 asphalt construction projects have been monitored. During the monitoring, in particular attention was paid to the operational variables which are required as input for the planning model. Also, to great extent the same formulas underlying the planning method are used for analysis purposes in order to preserve consistency. This paper is structured in the following way; After this introduction, the objective and approach of this research are described. Section three describes the monitoring framework, followed by the empirical results of the monitored projects in section four. The paper concludes with the discussion and conclusions in section five and six respectively. 2. Objectives and approach The objective of this research project was to twofold. The first objective was to create more insight in different operational values of model variables under different conditions in order to provide planners with practice-based values which in turn can serve as a starting point for actual planning calculations. The second aim was to evaluate actual asphalt construction projects on consistency/uniformity in terms of the degree of alignment between paver and roller over the entire road section. Overall, the aim was to improve the understanding of the operational aspects of the paving and compaction process and to assess whether applying the devised theoretical concepts are appropriate and valuable with respect to the desired professionalization of the road construction process sector and thus the final quality of the asphalt layer. In order to achieve the objectives of this research, first a framework for monitoring asphalt constructions project on interval scale has been drafted. This framework is based on relevant variables of four aspects of the asphalt construction process (cooling of asphalt and characteristics of paver, roller and road geometry/design), which have been defined based on. 2.
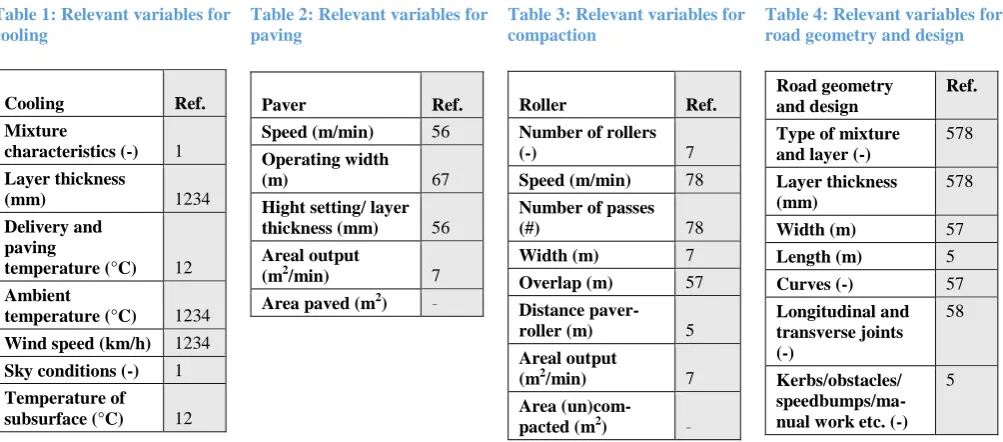
(15) a literature study. Formulas have been drafted for expressing the relations between these variables quantitatively. The second phase of this research comprised the monitoring and data collection of actual road construction projects. In total, 12 projects have been monitored. Data of the rollers (Hamm DV+ 70i or DV+ 90i) is collected by means of the Hamm Compaction Quality (HCQ) intelligent compaction system (with a claimed positional accuracy of 15 cm). In turn, the intelligent compaction data is analyzed with the help of Veta 4.0 software. Data of the paver is derived from the Thunderbuild Apex application. Based on this data the paver speed could be estimated. Data collection took place at construction projects with varying characteristics in terms of types of asphalt mixtures (AC and SMA), type of layer (base/bind/surf) and with different road geometries and other characteristics (e.g. joints, kerbs, crossroad head sections etc.) 3. Monitoring framework Based on literature review, this section presents the framework which can be used for monitoring asphalt paving and compaction processes on the degree of alignment and on deviations from the planned single operational variables. First some general principles are described. These principles indicate important aspects for monitoring paving and compactions processes. After the general principles, the operational variables and formulas are presented. General principles The speed of the paver appears to be a good indicator for the degree of continuity in the paving process [Bijleveld, 2015]. A key issue in determining the speed of the paver is to consider the available roller capacity and making sure the roller capacity will not be exceeded [Bijleveld, 2015]. If the output of the paver exceeds the roller capacity, the roller will fall behind on the paver. On the other hand, if the roller output exceeds the paver output, the roller will catch up the paver [Simons, 2007]. Both situations affect the consistency of the paving process negatively. Ideally, the paver output rate equals the roller output rate [Floss, 2001]. Thus, a the first key issue in monitoring is to assess output rates of both paver and roller(s). Another issue that complicates the operational accomplishment of the paving and compaction process, is the fact that the temperature of the asphalt layer decreases under influence of several environmental factors. This makes that roller operators have a limited period of time in which the compaction process has to be performed [Miller, 2010] [Vasenev, Bijleveld, Hartmann & Dorée, 2012]. According to Kari [1967] as cited by [Miller, 2010], two problems can occur during the compaction of asphalt mixtures. An asphalt mixture can be overstressed (often at too high temperatures) or the mixture can be understessed (often at too low temperatures). In an overstressed situation, a lack of stability of the asphalt layer results in the situation that the layer cannot support the weight of the rolls, while in a understressed situation the compaction force is too low to increase the density of the of the asphalt mixture. This results in an optimal temperature and time interval. In turn, this temperature and time interval result in an area which has to be compacted on time and thus a maximum uncompacted area. This is the second key in issue with respect to monitoring. Operational variables and formulas Based on a literature review, this section describes the most relevant variables and characteristics on four aspects of the asphalt construction process. The variables are presented in Table 1, 2, 3 and 4. Variables influencing the cooling must be monitored in order to estimate the available time for compaction. The variables on the paver are important for calculating the paver output and area paved. The same applies for the variables on the roller or. 3.
(16) rollers. Monitoring characteristics of the road design allows evaluating the effect of (changing) road geometries on output rates of both paver and roller. Table 1: Relevant variables for cooling. Table 2: Relevant variables for paving. Cooling. Ref.. Mixture characteristics (-). 1. Layer thickness (mm). Operating width (m). 1234. Hight setting/ layer thickness (mm). Paver Speed (m/min). Delivery and paving temperature (°C). 12. Table 3: Relevant variables for compaction. Ref.. Road geometry and design. Ref.. Roller Number of rollers (-). Type of mixture and layer (-). 578. 7. 67. Speed (m/min). 78. Layer thickness (mm). 578. 56. Number of passes (#). 78. Width (m). 57. Width (m). 7. Length (m). 5. 57. Curves (-). 57. Longitudinal and transverse joints (-). 58. Kerbs/obstacles/ speedbumps/manual work etc. (-). 5. Ref. 56. Areal output (m2/min). 7. Overlap (m). Area paved (m2). -. Distance paverroller (m). 5. Ambient temperature (°C). 1234. Wind speed (km/h). 1234. Sky conditions (-). 1. Areal output (m2/min). 7. 12. Area (un)compacted (m2). -. Temperature of subsurface (°C). Table 4: Relevant variables for road geometry and design. 1= [NCAT, 1996] , 2 = [Bijleveld, 2010], 3 = [VBW Asfalt, 2000], 4 = [Asphalt Institute, 1989], 5 = [Simons, 2007], 6 = [Fischer & Schug, 2012], 7 = [Floss, 2001], 8 = [ Schröder, 2010].. For the monitoring of actual road construction projects, it is proposed to calculate not only the actual output rates but also the theoretical output rates. This allows not only to assess whether the output rates on each interval section were aligned to each other (comparing actual paver output to actual roller output), but also to assess whether the paving and rolling process was performed efficiently (comparing actual output rates to theoretical output rates). Below, all relevant formulas for monitoring/evaluating purposes are summarized. Formulas 1-4 are drafted by [Floss, 2001]. These are of rather theoretical nature, while formulas 7-10 are of rather practical nature. For formulas 5 and 6 this distinction is less clear. 1. 𝐹𝑝,𝑡 = 𝐵 ∗ 𝑣𝑝 ∗ 𝑓𝑛. 6.. 𝐹𝑟,𝑡 =. 3.. 𝑏𝑒𝑓𝑓. 7.. 𝐵 4. 𝑁 = 𝑏∗0,9. Factor 0,9 due to overlap with previous roller track. 5.. 𝑋𝑝−𝑟,𝑚𝑖𝑛 =. (𝑇𝑠 − 𝑇𝑚𝑎𝑥𝑣 ) ∗ 𝑣𝑝 𝐶. Fp t = Theoretical areal output of paver (m2/min) Fr,t = Theoretical areal output of one roller (m2/min) B = Operating width of paver (m) vp = Average speed of paver (m/min) fn = Efficiency factor (-) beff = Effective roller width (m) vr = Average speed of roller (m/min). (𝑇𝑠 − 𝑇𝑚𝑖𝑛𝑣 ) ∗ 𝑣𝑝 𝐶. 𝐴𝑐,𝑝(𝑡𝑒𝑛𝑑 ) 𝑡𝑒𝑛𝑑,𝑝 − 𝑡𝑠𝑡𝑎𝑟𝑡,𝑝 𝐴𝑐,𝑝(𝑡𝑖 ) 8. 𝐹𝑝,𝑎,𝑖𝑛𝑡 = 𝑡𝑖 − 𝑡𝑠𝑡𝑎𝑟𝑡,𝑝 𝐴𝑐,𝑟(𝑡𝑒𝑛𝑑 ) 9. 𝐹𝑟,𝑎 = 𝑡𝑒𝑛𝑑,𝑟 − 𝑡𝑠𝑡𝑎𝑟𝑡,𝑟 𝐴𝑐,𝑟(𝑡𝑖 ) 10. 𝐹𝑟,𝑎,𝑖𝑛𝑡 = 𝑡𝑖 − 𝑡𝑠𝑡𝑎𝑟𝑡,𝑟. 𝑏𝑒𝑓𝑓 ∗ 𝑣𝑟 ∗ 𝑓𝑛 𝑛 𝐵 = 𝑁. 2.. 𝑋𝑝−𝑟,𝑚𝑎𝑥 = 𝐹𝑝,𝑎 =. Fp,a = Actual areal output of paver (m2/min) Fr,a = Actual areal output of roller (m2/min) Fp,a,int = Actual areal output of paver on interval (m2/min) Fr,a,int = Actual areal output of roller on interval (m2/min) Ac,p (t,end) = Area covered by paver at end (m2) Ac,p (ti) = Area covered by paver till moment ti (m2) Ac,r (t,end) = Area covered by roller at end (m2). 4.
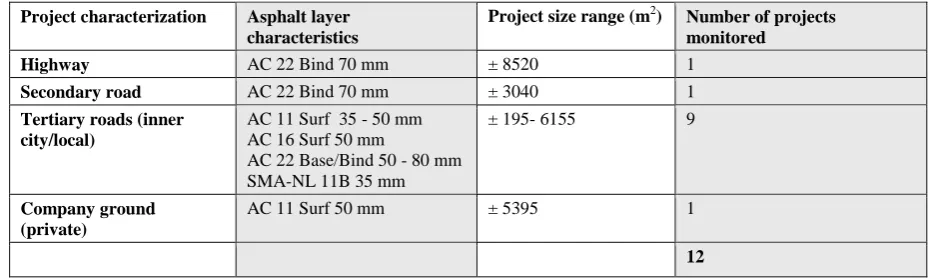
(17) N = Number of parallel roller tracks (-) n = Number of roller passes (-) Xp-r,min = Minimal distance between paver and roller (m) Xp-r,max = Maximum distance between paver and roller (m) Ts = Temperature of asphalt behind screed (°C) Tmaxv = Maximum asphalt temperature of compaction window (°C) Tminv = Minimum asphalt temperature of compaction window (°C) C = Average cooling rate of asphalt (°C/min). Ac,r (ti) = Area covered by roller till moment ti (m2) tend,p = End time of paving (min) tstart,p = Start time of paving (min) tend,r = End time of rolling (min) tstart,r = Start time of rolling (min) ti = Time at end of interval (min). Formulas 1-4 can be used for calculating the theoretical output rates of both paver and rollers. Formulas 7 and 9 can be used for calculating the actual output rates when the paving and compaction processes have been finished. This yields only one average output rate for the paver and the roller. Therefore, formulas 8 and 10 are introduced. By means of these formulas the output rates can be calculated on interval scale. When monitoring and evaluating on small discrete time interval scale during (or after/ex post) a paving and compaction process, one can check whether the roller output is (or was) in line with the paver output and thus evaluate whether the current process was a consistent process. Also, the interval approach allows evaluating the effect of changing road geometries on the output rates. Thus, monitoring on interval scale results in more detailed information, more opportunities for analysis and thus more input, recommendations or lessons learned for future projects. 4. Empirical results In this section the empirical results of the 12 actual road construction projects are presented. Details of the projects monitored are summarized in Table 5. In the first subsection of this paragraph, representative values of operational variables are presented. The following aspects were assessed in detail and will be addressed: roller speed, pass count (recorded by HCQ system), machine speed (based on Thunderbuild Apex) and theoretical versus the actual output. The information presented in this section can be used as input for the planning method as presented in earlier work. In the second subsection, an example of the interval approach will be presented. Both the key issues (as mentioned in section 3) will be addressed. Table 5: Details of projects monitored Project size range (m2). Highway. Asphalt layer characteristics AC 22 Bind 70 mm. ± 8520. Number of projects monitored 1. Secondary road. AC 22 Bind 70 mm. ± 3040. 1. Tertiary roads (inner city/local). AC 11 Surf 35 - 50 mm AC 16 Surf 50 mm AC 22 Base/Bind 50 - 80 mm SMA-NL 11B 35 mm. ± 195- 6155. 9. Company ground (private). AC 11 Surf 50 mm. ± 5395. 1. Project characterization. 12. 5.
(18) Representative values of operational variables Roller speed The average roller speed during all projects varies between 2,6 km/h (43 m/min) and 5,1 km/h (85 m/min). For relatively small projects (195 – 440 m2), the average speed turns out to be 3,5 km/h (58 m/min). For the larger construction projects (1845 – 8520 m2) the average roller speed was 4,6 km/h (77 m/min). Almost no differences in speeds are observed when comparing the speed on base/bind layers to the speed on surf layers. The same applies for the speeds during the breakdown/intermediate compaction phase and during the finishing compaction phase. Also, the speeds in curves are almost equal to the speeds on straight sections. Thus, the presence of curves in the road geometry does not affect the compaction process with respect to the operational rolling speed. However, the presence of ‘special’ objects in the road design does affect the average roller speed. For rolling transverse joints, along kerbs, speedbumps and crossroad head sections the average speeds are 4,1 km/h, 2,9 km/h, 2,9 km/h and 3,6 km/h respectively (= 68 m/min, 48 m/min, 48 m/min and 60 m/min). Roller operators can define a maximum operational speed based on their own preference. During the monitored projects, these maximum speed settings varied between 3,56,0 km/h (= 58 m/min - 100 m/min). The maximum speeds settings can be related to the overall average roller speed. From the intelligent compaction data, it can be derived that the set maximum speed is approximately 20% higher than overall average speed over the entire road section. Thus, the calculated desired average roller speed in planning calculations should be multiplied by a factor 1,2. This is the speed that should be instructed to the roller operator. Number of roller passes Per project monitored, one of the two or three rollers was equipped with the HCQ Intelligent Compaction system. The average number of roller passes, applied by one single roller, varies between 3 and 11 machine passes (thus front + rear drum = 1 pass), while the maximum number of passes per roller varies between 10 and 34 passes. In most cases, the maximum number roller passes are applied at the special sections (joints, crossway head sections etc.). Overall, the average number of passes at regular sections is 4,8, while at the special sections the average number of passes turns out to be 7,9. The differences in number of passes applied per type of layer and per compaction phase are negligible. In addition, the so-called 'compaction contour plots (CCP)’ as devised by Miller [2010] indicate a lot of variability in the number of passes (both longitudinal as transverse). Paver speed and actual paver output For some projects monitored, the average paver speeds are estimated based on the registered truck unloading times and corresponding GPS locations. The average speeds over the entire road section vary between 3,5 m/min and 4,9 m/min. On subsections speeds are generally higher. When multiplying the paver speed by the operating width, the output rate can be calculated. For the monitored projects, actual output rates vary between 1195 m2/h and 1662 m2/h. Theoretical roller output vs. actual roller output For each project monitored, the theoretical and actual roller have been calculated. The theoretical output is the output as can be calculated with the formulas 1-4. The actual output is the area covered by a roller, divided by the elapsed operating time (formula 9). The actual output rates are calculated manually with aid of the Veta 4.0 software. Actual overall roller output rates vary between 996 m2/h and 1826 m2/h. The corresponding theoretical outputs are 1197 m2/h and 2040 m2/h. Based on the actual and theoretical output rates, the efficiency factor fn can be calculated. Efficiency factors vary between 0,832 (irregular road geometry, 6.
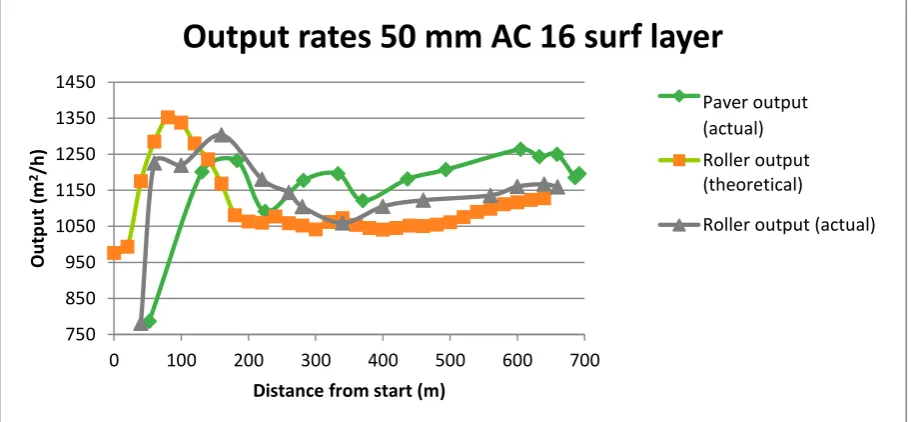
(19) kerbs and obstacles) and 1,221 (straight highway section) Also, this may imply that the roller output can be calculated on beforehand within a range of app. 20% accuracy, irrespective of the road geometry. Monitoring on interval scale When applying the formulas on interval scale, the ongoing output rates can be evaluated over time and location. In this way, one can check whether the output rates of the paver and roller are aligned to each other during the entire asphalt construction process, and thus whether the current process is a uniform and continuous process. If not, corrective actions can be suggested. For five (of twelve) projects monitored, the actual interval output rates are calculated. Actual output rates (for both paving and compaction) are defined as the area paved/compacted devided by the time (in hours) elapsed since start of operations. For one particular project (AC16 surf, 5,5 m width, breakdown + intermediate compaction phase) the results are plotted in Figure 1. Also, the theoretical roller output (as a result of the number of passes and speed per section) is plotted in Figure 2. Theoretical roller output is defined as the theoretical productivity in m2/h based on actual speed, number of roller passes and the effective operating width of the roller (see formula 2). Figure 3 indicates the areas paved and compacted, and the area which still has to be compacted.. Output rates 50 mm AC 16 surf layer 1450. Machine output Paver output (actual) (actual). Output (m2/h). 1350 1250 1150. Roller output (theoretical). 1050. Roller output (actual). 950 850 750 0. 100. 200. 300. 400. 500. 600. 700. Distance from start (m) Figure 1: Output rates over location. From Figure 1, it can be concluded that the output rates vary to a greater or lesser extent during the process. The most variation can be observed in the first 200 meters of the road to be constructed. From up there, the output rates are more constant. This pattern can also be observed from the other four monitored projects, where the variation in output rates is highest in the first 200 – 500 meter and output rates are more constant in the remaining 500 – 700 meter. When comparing the theoretical roller output to the actual roller output, in general it can be stated that the lines follow the same pattern. However, it seems that a time lag exists regarding the changes in the theoretical output and the moment they can be observed in the actual output. Also - in this case- the actual output is approximately 100 m2/h higher. Figure 1 makes clear that the paver output is below the roller output during the app. first 250 m. Thereafter the paver output exceeds the roller output, which means that in this case the breakdown + intermediate roller is getting behind on the paver. However, at the end of this asphalt construction project, output rates of both paver and roller are app. 1150 m2/h. This implies that overall, the average output rates of paver and roller were aligned to a great 7.
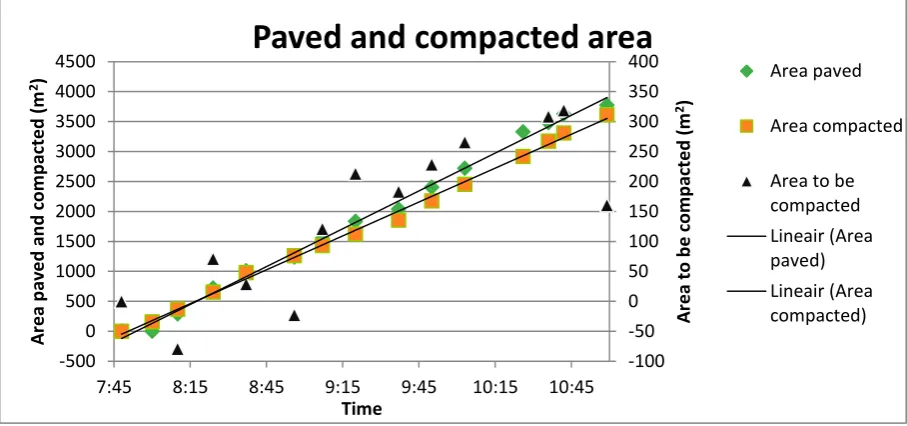
(20) 6,5. Roller speed, number of passes and resulting theoretical output 1400. 6. 1300. 5,5. 1200. 5. 1100. 4,5. 1000. 4. 900. 3,5. 800. Roller output (m2/h). Nummer of passes (-)/ Roller speed (km/h). extent, while clearly a great variation can be observed during the project. This precisely emphasises the benefit of the interval approach.. Number of passes Speed Theoretical output. 0 50 100 150 200 250 300 350 400 450 500 550 600 650 700 Location from start (m). Figure 2: Theoretical roller output over location. An issue when striving after aligned paver and roller outputs, is the fact that roller operators to some extent have the possibility to ‘cheat’. I.e. in order to achieve a certain output rate, an operator can apply less roller passes than specified or can drive faster than instructed. Thus, the fact that output rates were aligned does not immediately imply that the process was executed correctly. Therefore, analysis of the monitored projects should not focus on output rates only but also on the number of roller passes and roller speed. In Figure 2, the theoretical roller output on interval scale is plotted as a result of the ongoing average number of passes and roller speed. From this figure, clearly the effect of changing number of passes and speeds can be seen. E.g. at app. 50-100 m, the average speed increases, while the number of passes decreases. This clearly results in an increased theoretical roller output. From app. 200 m, the roller speed has a constant value of 5 km/h, while the number of passes decreases from 5,75 to 5,25. This results in a continuously increasing theoretical roller output.. Paved and compacted area. 400. 4000. 350. 3500. 300. 3000. 250. 2500. 200. 2000. 150. 1500. 100. 1000. 50. 500. 0. 0. -50. -500. -100 7:45. 8:15. 8:45. 9:15 9:45 Time. 10:15. Figure 3: Paved and compacted area over time. 8. 10:45. Area paved. Area to be compacted (m2). Area paved and compacted (m2). 4500. Area compacted Area to be compacted Lineair (Area paved) Lineair (Area compacted).
(21) Based on the GPS locations of both paver and roller, an estimation of the paved and compacted area can be made. The difference between both is the area still to be compacted within the available time for compaction. In Figure 3, these values are plotted. The linear trend lines slightly indicate that the area to be compacted increases over time, which means that the roller is getting behind on the paver. This corresponds with the results presented in Figure 1. The area to be compacted varies from app. 0 – 350 m2. Two measurement values indicate a negative area to be compacted. This suggests that the roller would have passed the paver, which is obviously not true and thus a measurement error must be the cause of this. For this specific project conditions, the PaveCool tool suggests that after app. 8 minutes the breakdown and intermediate compaction phase should have been finished. At an average paver speed of 4,6 m/min, the theoretical maximum distance between the paver and roller is approximately 37 meter (Formula 6). As the paver screed width was set on 5,5 m, the maximum area to be compacted should not exceed 204 m2. As can been seen from Figure 3, this value is exceeded several times. This may indicate that the compaction process took place outside the time and temperature boundaries of the optimal compaction interval. This theorem is supported by the corresponding temperature data, as to great extent compaction took place below the minimum compaction temperature. This pattern can be observed for other monitored projects too, which may indicate that the area still to be compacted exceeded the maximum uncompacted area, and thus paver output and roller output were not aligned properly. 5. Discussion and future research We succeeded in creating more insight in different operational values of model variables under different conditions (objective 1) and in monitoring and evaluating actual asphalt construction projects on consistency/uniformity in terms of the degree of alignment between paver and roller during over the entire road section (objective 2). However, there are still various points to address. For this research project, 12 different projects with different characteristics have been monitored. However, during all projects only one roller was equipped with the HCQ system, thus, only a part of the compaction process was registered. In most cases, the finishing compaction phase was registered. Also, the system was mounted on a tandem roller only. For future data collection, it would be valuable to equip other types of rollers (e.g. rubber wheeled rollers or combination rollers) with the HCQ system and to focus on the monitoring of all compaction phases, thus including breakdown and intermediate compaction phases. Further, the quality of the collected empirical data heavily depends on the quality and accuracy of the GPS signal. This applies for the (discontinuous) GPS registration of the paver position, but is especially true for the continuous GPS registration of the roller position. Inaccurate GPS signals will result in incorrect dimensions of the compacted area and thus incorrect roller outputs. With respect to monitoring, especially the transversal accuracy is important, as errors in the transverse position will have the strongest influence on the output rates. Sometimes, clearly the GPS signal was disturbed during compaction of road sections adjacent to trees/canopies. In cases of inaccurate GPS signals and in order to improve the accuracy of the equipment locations and thus of output rates, manufacturers of Intelligent Compaction systems may consider to make use of Dead-reckoning techniques. Applying the alignment method on interval scale seems an appropriate method for monitoring the paving and compaction process and for steering it towards an uniform process. However, still some points needs to be addressed. First, the roller output rates are calculated by manually specifying the time intervals (i.e. time filters) in the Veta 4.0 software and then evaluating the covered area. Ideally, one would automate this process. This can be achieved by e.g. writing MatLab scrips which use the exported IC data files as input. Also, here lies an 9.
(22) opportunity or task for the equipment manufacturers, in this case Hamm A.G.. Second, a drawback of the method for calculating the actual roller output rate on interval scale is that the covered area also partly includes an area which has been covered with only one pass and thus reasonably cannot be regarded as finished. I.e. the actual output rates may be overestimated. This is especially true when a relatively large part of the area is covered with only one or two passes, while on average e.g. 5 to 6 passes are applied. In this research, monitoring the alignment on interval scale has only been done ex post. However, by then, if paver output rates deviate from roller output rates, no corrective actions can be applied. Thus, the possibility of real-time monitoring and steering will be very beneficial. However, for steering the process in real-time, an application has to be developed which calculates and visualizes the actual output rates to both paver and roller operators. Likely, this will require substantial research effort though. Recently, within the ASPARi research unit Machine2Machine (M2M) communication have received attention. This outlined issue perfectly fits in this M2M research topic, as the output rates of both machines have to be calculated and communicated. Finally, the methods for planning and monitoring as presented in this paper and in earlier work, has not yet been validated as such. I.e. that on beforehand the presented formulas are used for calculating the output rates. This was only done after the paving and compaction process was finished. By now, the data gathered should provide a good starting point for a planning calculation. Thus, the next (three) steps in this research would be to apply the planning method on beforehand (1), to provide the asphalt crew with the calculated paver speed, roller speed, number of passes and (maximum) distances between paver and roller (2) and to monitor and evaluate the process (3). Thus, afterwards, the values of variables during the field experiment should be compared to the planned values. Also, temperature data should confirm whether the compaction process took place within the specified temperature interval. 6. Conclusions A uniform and continuous paving process is a prerequisite for a good quality asphalt layer. This in turn requires a proper work preparation and organization of the paving process. However, currently the selection of working methods and equipment allocation is largely based on experience, while the choices made will have a major impact on the final quality of the asphalt layer. By making the selection procedure of working method and equipment allocation more explicit, this can contribute to the further professionalization of the road construction sector. In earlier work, a method for planning the paving and compaction process has been drafted. That method is based on the alignment between paver output and roller output/capacity. But when striving after a consistent process, one has not only to plan the process, but also to monitor the process on regular interval scale. This research project continues on that earlier works and has aimed to assess monitor asphalt construction processes and assess them on the degree of consistency during the entire process. Two key issues are relevant with respect to monitoring and evaluation; these are equal output rates and area still to be compacted within the limited time interval. This paper has presented a framework for monitoring paving and compaction processes. Empirical data on paver speed, roller speed and number of roller passes has been collected during the monitoring of 12 asphalt construction projects. This data can serve as a starting point for planning calculations. Average roller speeds are in the range of 2,6 km/h and 5,1 km/h (43 m/min - 85 m/min), depending on the various characteristics of the road section. The average number of roller passes applied by one single roller turns out to be 4,8 on regular sections, while on average 7,9 passes are applied at the special sections (e.g. joints, near refuge islands etc.). Thus, the actual road design will have an influence on the output 10.
(23) rates as different average values for roller speed and roller passes can be observed for different road geometries. Actual overall roller output rates vary between 996 m2/h and 1826 m2/h with corresponding 1197 m2/h and 2040 m2/h theoretical outputs. Efficiency factors vary between 0,832 (irregular road geometry, kerbs and obstacles) and 1,221 (straight highway section). On average the paver speed varies between 3,5 m/min and 4,9 m/min, with the output rates are in the range of 1195 m2/h and 1662 m2/h. The projects monitored are evaluated by calculating both actual paver output and theoretical and actual roller output on interval scale and checking whether the output rates were aligned to each other during the whole construction process. The results of this analysis demonstrate that it is certainly beneficial to specify output rates on interval scale, as much variation in output rates can be observed during the process from start till end. For the monitored projects, the variation in output rates is highest in the first 200 – 500 meter, while the output rates in the remaining 500 – 700 meter are more constant. Thus, one could say the process needs some time/distance before it turns into a more or less consistent process. Temperature data of the project monitored may indicate that in most cases paver output, roller output and available time for compacted were not aligned properly, as compaction often took place on too cold asphalt, given the advised theoretical minimum compaction temperature boundary. The presented theoretical concepts seem appropriate for monitoring the paving and compaction process and for steering it towards an uniform process. Monitoring on interval scale (compared to monitoring single values over the entire road section) results in more detailed information, more opportunities for analysis and thus more input, recommendations or lessons learned for future projects. However, future research effort is required to improve the framework with respect to accuracy, automatization, real-time steering, continued data collection and validation of the planning method and monitoring framework. 7. Acknowledgements I would like to acknowledge André Dorée and Seirgei Miller (University of Twente/ASPARi) and Marco Oosterveld (BAM Infra Asfalt) for their feedback, help and general support during this research project and also for giving me the opportunity to conduct this research at the BAM Infra construction company. 8. References Arbeider, C.G. (2016). Planning the asphalt compaction process - The alignment between paver output, roller capacity and available time for compaction. Enschede, Nederland: Universiteit Twente. Paper MSc Thesis, 2016. Asphalt Institute. (1989). The Asphalt Handbook. Lexington, KY: Asphalt Institute. Bijleveld, F.R. (2010). Asfaltwegenbouw, op weg naar professionalisering - Op basis van mechanische eigenschappen het bepalen van temperatuur‐ entijdsvensters voor het verdichten van Nederlandse asfaltmengsels. Enschede, Nederland: Universiteit Twente. MSc Thesis, 2010. Bijleveld, F.R. (2015). Professionalising the asphalt construction process - Aligning information technologies, operators' knowledge and laboratory practices. Enschede, Nederland: Universiteit Twente. PhD Thesis, 2015. Dorée, A.G., & ter Huerne, H.L. (2006). Professionalisering asfaltwegenbouw sector; van ambacht naar industrie. Dorée, A.G., Miller, S.R., & ter Huerne, H.L. (2008). Asfalt, wat bakken we ervan? CROW Infradagen, 25-26 juni 2008. Delft.. 11.
(24) Fischer, A., & Schug, R. (2012). Vögele Booklet on Paving. Ludwigshafen: Joseph Vögele AG. Floss, R. (2001). Compaction technology in earthwork, highway and transportation engineering Volume 1 Basic principles of vibratory compaction, compaction of soil and rock, compaction of asphalt. Boppard: BOMAG GmbH. Miller, S.R. (2010). Hot Mix Asphalt Construction - Towards a more professional approach. Enschede: Universiteit Twente. PhD Thesis, 2015. NCAT. (1996). Hot Mix Asphalt Materials, Mixture Design and Construction. Lanham, Maryland: National Center for Asphalt Technology. Schröder, R. (2010). Compaction in asphalt construction and earthworks. Tirschenreuth: HAMM AG. Simons, B. (2007). Op weg naar een beheerst asfaltverwerkingsproces. Enschede: Universiteit Twente. MSc Thesis 2007. Vasenev, A., Bijleveld, F., Hartmann, T., & Dorée, A.G. (2012). A real-time system for prediction cooling within the asphalt layer to support rolling operations. 5th Eurasphalt & Eurobitume Congress 13-15th June. Istanbul. VBW-Asfalt. (2000). Asfalt in wegen- en waterbouw. Breukelen: Vereniging tot Bevordering van Werken in Asfalt.. 12.
(25)
Figure
+3
Related documents
The book’s first section offers a foundation of four simple but comprehensive Lean key performance indicators (KPIs): waste of the time of things (as in cycle time),
An effective process of performance review is an important part of EIT’s annual strategic and operational planning process to ensure alignment between the
The model also shows age of household head, family size, nearest market distance and area under enset cultivation as statistically significant determinants of
We discussed many examples of this interaction, for different types of institutions (such as political and legal institutions, regulation, and the welfare state) and
Hours are not contracted, but agreed with Manager based on students schedule (other classes etc), hours usually vary between 10-20 per week.... Interns should receive credit
Information technology equipment (ITE) Racks and cabinets Cabling pathways (not shown) Building steel Supplemental bonding grid (SBG) Conduits Rack bonding conductor
The Jobs Act provides entrepreneurs and small business owners with a toolbox that includes tax relief, access to capital, more contracting opportunities and exporting assistance,
notifications of vibratory roller with all types of asphalt compaction equipment with smooth drum soil compactor inspection of the site.. Connect to take a roller inspection or
