DATA FUSION FOR DEFECT CHARACTERISATION USING A
DUAL PROBE SYSTEM
R.S. Edwards 1, A. Sophian 2, S. Dixon 1 and G.Y. Tian 2 *
1 University of Warwick, Department of Physics, Coventry CV4 7AL, U.K.
2 University of Huddersfield, School of Computing and Engineering, Huddersfield HD1 3DH, UK
Abstract
We present recent work on a dual probe system containing electromagnetic acoustic transducers (EMATs) generating and detecting surface ultrasonic waves, and a pulsed eddy current (PEC) probe. This system is able to detect and size surface and near-surface defects in electrically conducting samples by looking at changes in the detected signal for each probe. By combining the information from each probe using a weighted logic function for data fusion, it is possible to both classify and size defects, with increased reliability. By combining the data in this way one obtains information about the defects which is not available when using either probe in isolation. Typical results on steel and aluminium samples are presented, along with information about the data fusion function. The dual probe and data fusion routine has been demonstrated to work at manual-scanning speeds, with higher speeds possible following some simple improvements to the system.
Keywords: EMAT, PEC, data fusion, defect detection, ultrasound
* Currently at University of Newcastle upon Tyne, School of Electrical, Electronic and Computer
INTRODUCTION
Non-destructive testing (NDT) aims to detect and characterise defects in components without removing them from service, or causing damage to the sample during the testing process [1]. It is essential to have both high accuracy and reliability for measurements of defects, where critical defects are detected with the highest possible reliability. For this reason, more than one technique may be used to measure a particular sample; for example, using one technique which looks for defects in the bulk of the sample, and one that inspects predominantly the surface will enable operators to detect a wider variety of defects. However, this will increase the cost and time for inspection, and the time taken to analyse results from all techniques separately. This problem can be minimised by combining more than one technique into a single probe, data acquisition system and analysis algorithm, significantly reducing inspection time [2-5].
Improvements to NDT can also be made when using two or more different techniques which are sensitive to similar types of defect [2-5]. When data analysis is done concurrently, an increased reliability of information about the defects can be given by competitive data fusion. Further information may be available through cooperative data fusion by looking at what information gathered by each system complements that gathered by the other [6].
The experimental system presented in this paper consists of a probe containing two techniques which are both sensitive to surface and near-surface defects, such as rolling contact fatigue in rails, or surface defects formed during the casting of metal billets [7]. The ability to reliably detect the former has obvious safety implications, while the ability to detect surface defects in billets allows companies to increase competitiveness through assurance of a higher quality product. The two techniques chosen are pulsed eddy current (PEC) [8-10] and ultrasonics, which, when using surface ultrasonic wave techniques, are both sensitive to surface and near surface defects in metal samples [11, 12]. Improvements in the accuracy of depth information is gained by analysing results concurrently and performing data fusion on the depth information from each system, with each technique being more sensitive than the other to a slightly different range of defect depths [4, 5]. Further information about samples is found by taking into account the particular strengths and weaknesses of each technique [6].
The ultrasound is generated and detected using electromagnetic acoustic transducers (EMATs) [12-15]. Both techniques deployed in the dual probe are non-contact and require no couplant, lending the possibility of using the dual probe in hot or moving environments. Standoffs of several millimetres are possible, with typical standoffs around 1 mm [10, 12, 14, 16, 17].
EXPERIMENTAL TECHNIQUES
PEC probe fitting, enables the standoff of each probe to be controlled. Separation of the EMATs is controlled using a suitable length handle bar [4, 5].
FIGURE 1. The dual probe design, showing the EMATs and the PEC probe with current dimensions.
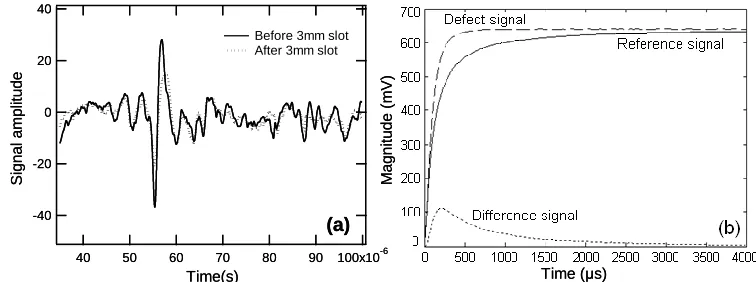
A defect that is present between the EMATs will affect transmission of the ultrasound along the sample, and changes in the transmitted signal are apparent in the signal measured by the EMATs. In order to detect surface and near-surface defects Rayleigh waves (ultrasonic surface waves on thick, flat samples) are generated and detected [11, 12]. When the entire probe assembly is located above a clear, defect-free section of sample, the Rayleigh wave is free to travel from the generation to the detection point. Should a surface or near-surface defect be present, this will disrupt the Rayleigh wave and a reduced signal amplitude is measured, as shown in Figure 2(a) for a clear sample (solid line) and for the case where a slot is present between the EMATs (dotted line); the Rayleigh wave is the dominant feature. The Rayleigh wave amplitude is decreased by an amount dependent on the depth of the defect, and a calibration curve has been produced which can relate the change in signal amplitude to the depth of a crack present between the EMATs. The EMATs and pulse generator used generate a relatively low frequency wideband signal, with significant frequency content between approximately 50 and 450 kHz, and are particularly sensitive to surface defects deeper than 1 mm. A measure of the cut-off frequency, as described in previous publications, is also used for defect detection and sizing [4, 5, 12, 17]; the longer wavelengths (lower frequencies) will mainly pass more readily underneath a crack, while the shorter wavelengths are more effectively blocked. -40 -20 0 20 40 Si g n a l a mp lit u d e 100x10-6 90 80 70 60 50 40 Time(s)
Before 3mm slot After 3mm slot
M a g n it u d e ( m V) Time (μs) (a) -40 -20 0 20 40 Si g n a l a mp lit u d e 100x10-6 90 80 70 60 50 40 Time(s)
Before 3mm slot After 3mm slot
M a g n it u d e ( m V) Time (μs) (a)
[image:3.612.117.495.537.678.2]Errors in the depths measured by the ultrasonic technique are calculated as a combination of scatter in calibration measurements and the resolution of the calibration; for example, for defects around 5 mm deep there is a small scatter in the calibration measurements, but the resolution between results for slots of similar depths is very good due to the steep slope of the calibration curve and hence errors in the measured depths are low [12].
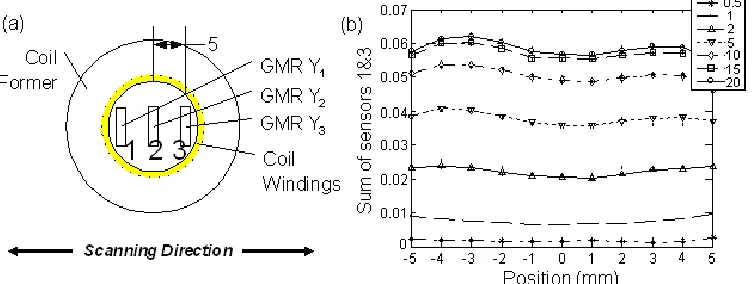
[image:4.612.120.496.349.491.2]The final design of the PEC probe is shown in Figure 3(a). A standard PEC probe consists of an excitation coil and a magnetic sensor such as a GMR sensor measuring the normal magnetic field intensity at the inspected surface. Good sensitivity of the magnetic sensor to frequencies down to 0 Hz enables deeper inspection of the test sample; the frequency range of this type of sensor also extends to 1 MHz, but in practice it is used up to a frequency of 50 kHz. A reference signal is obtained over a defect-free section of metal (see Figure 2(b)) and subsequent signals are analysed by subtraction from this reference to give a difference signal. A normalisation technique was used to improve the stability of the system against temperature and to reduce the effects of permeability variation when used on steel samples. Changes in the difference signal, specifically the peak value and arrival time, are measured; low peak arrival time signifies that the defect is on or very close to the surface, while deeper defects have a later peak arrival time and lower difference signal magnitude [9, 16].
FIGURE 3. (a) The layout of the magnetic sensor array inside the PEC probe (dimensions in mm); (b) variation in the chosen feature for depth measurement with distance of probe centre from crack centre for different surface crack depths (mm, shown in legend), in an aluminium sample.
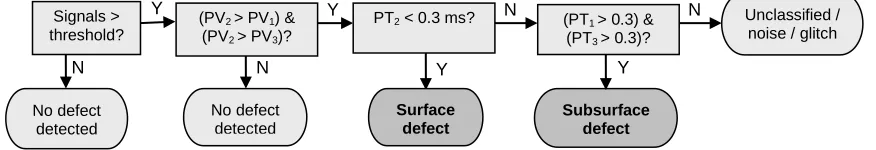
check to remove any further anomalous noise signals. The peak arrival time of the second sensor is then checked; if it is less than 0.3 ms a surface defect is indicated, and the feature described above is used to give the defect depth. For later arrival times, the arrival times of the peaks from sensors 1 and 3 are checked, and should these also be greater than 0.3 ms a sub-surface defect is indicated. In this case, the depth measurement from the PEC is unreliable.
FIGURE 4. The PEC classification routine.
PEC measurements are different on aluminium and steel samples due to the different properties of the materials. The relatively high magnetic permeability of steel significantly reduces the penetration depth of the eddy currents and the performance of eddy current techniques on steel is weakened further by variations in magnetic properties across different sections of a sample. In steel samples the PEC probe will give a difference signal when it detects a defect, but it is extremely difficult to give a reliable depth measurement.
The EMATs will indicate a defect whenever it is present between them, with the deepest defect present dominating the signal [17]. For this reason, the output of the measured depth from the EMATs has a distinctive “top-hat” appearance (see Figure 8 for an example), and everything which affects the surface wave signal is assumed to be a surface breaking defect. The PEC probe will detect a defect only when it is above it, and this is used to trigger data fusion. As transmitted ultrasonic surface waves will be diffracted and mode-converted at a crack [11, 18], it is beneficial to measure their properties away from the crack, with the best results found when a defect is close to half way between the EMATs. By situating the PEC probe in the middle, data fusion is triggered at the best point for the EMAT output.
DUAL PROBE
The PEC and EMAT probes have been combined, and experimental measurements indicate that there is no interference between the two systems. However, care must be taken to ensure that the electrical grounding of the two systems is the same [4, 5], otherwise there may be some significant electrical interference.
In order to demonstrate the dual probe, a pair of reference samples containing a variety of types of defects were manufactured in steel and aluminium. Design measurements were given as a guideline only, with actual measurements varying somewhat from the original specifications. Figure 5 shows the design for the aluminium reference sample. One surface contains a subsurface through side drilled hole of 1.5 mm diameter, plus a pair of full sample width machined slots with openings of 1 mm and different depths. The opposite side of the sample contains angled slots, representing
No defect detected
Y
N
No defect detected
Y
N Y
Surface defect
N
Subsurface defect
Unclassified / noise / glitch
Y
N Signals >
threshold?
(PV2 > PV1) & (PV2 > PV3)?
defects such as rolling contact fatigue in rails where cracks propagate at an angle to the surface, plus a pair of closely spaced slots. The steel reference sample is similar, however, the closely spaced slots are separated by about 40 mm, the cracks are 0.30 mm wide, and the depths of the slots vary. The subsurface hole was also made larger than that shown in the specification below (around 2 mm diameter) due to the hardness of the sample.
FIGURE 5. The aluminium reference sample design. Measurements given are approximate.
The probe was assembled and placed in the trolley, then scanned over each sample face in turn, with the software for each system acquiring and analysing the data [4, 5]. The depths of each detected defect for each pulse repetition, as measured by the PEC and from the amplitude and frequency content measurements of the EMATs, were input into the data fusion routine.
DATA FUSION
The initial data fusion routine was based on a simple weighted average, triggered whenever the PEC detects a crack. However, this can lead to problems with noise or other variations in signal; for example, an anomalous depth measurement can be recorded when an EMAT is very close to the edge of a crack due to interference of the direct, reflected and mode-converted signals at the crack [18]. Noise can also cause the PEC to read a defect and hence trigger data fusion where there is none. To overcome this, a simple logic routine was implemented to enhance the weighting function, where the output depths from each system are compared and checked to ensure they are in suitable agreement. Two data fusion routines were created; one for steel samples and one for aluminium samples, to allow for the difference in the PEC measurement ability. These are summarised in the flow chart in Figure 6.
FIGURE 6. The data fusion process for steel and aluminium samples. Sample
material
Y N
N
Steel Aluminium
PEC > threshold?
No Crack
Weighted logic fusion of EMAT depths
Crack; Depth & error
PEC > 0?
Y
Weighted logic fusion of PEC & EMAT
depths depths
Surface crack; depth & error
PEC < 0? N No Crack Y
Weighted logic fusion of EMAT
depths
Subsurface crack; depth & error
45o 150o
100 10 2
3 5 4 7
20
Ø 1.5 0.2 gap
[image:6.612.103.508.523.679.2]For steel samples, the PEC response is not sensitive enough to give a reliable measure of the depth but can indicate the presence of a defect given a suitable threshold for the PEC response, and data fusion is triggered by a positive, above threshold PEC output. This serves to give the position of a crack, but should the PEC fail to detect a defect it will still be visible in the EMAT output. Once data fusion has been triggered, the system looks at the depth outputs of the EMATs from the amplitude and frequency measurements. The depths and their errors are compared to ensure that a reasonable depth is measured by both the amplitude and frequency content, and, should the difference between the two depths be greater than a specified amount, the most accurate is used in preference. Finally, a weighted average of the chosen depth information is performed. The weighting used is based on the error in the depths from the amplitude and frequency measurements, in order to give more weight to the most accurate depth, and the output (labelled Fused EMAT depth) gives a measure of the depth of the defect detected.
Aluminium samples offer the possibility of classification as well as data fusion for the depth measurement, as on non-magnetic samples PEC has a useful depth output. For aluminium samples the routine looks initially at the PEC output. If this reads zero, no crack is indicated. If this reads a value other than zero, data fusion is triggered. For subsurface defects the PEC gives a depth reading of -1, but does not give depth information. In this case the EMAT depths are fused in the same manner as for measurements on steel samples, and this is used to give the defect depth. If the PEC gives a positive depth reading, the fusion routine takes into account all three measured depths. Again, the depths are compared to ensure that all depths used are reliable and in good agreement, with any non-reliable measurement discarded. The error-based weighting process gives preference to the measurements which are most reliable for a particular defect depth.
Many examples of data fusion use neural networks in order to detect the presence of a defect [6]. In the experiments presented here, rather than giving such a discrete output, the system gives a continuous measurement for the defect depth as well as its position. The use of a neural network would require extremely intensive training with a very large sample set, and it was decided that this was unnecessary when a simple mathematical algorithm gives reliable results where the observed changes in the various signals are fully understood.
RESULTS
The dual probe was used to measure both faces of each of the reference samples, with the data fusion routine running in Labview on the computer which was acquiring and analysing the ultrasonic data. Separate computers were used for each system to enable work on the systems to be carried out independently at each institution. Results were transferred between the two systems over a local area network; a full prototype system would have integrated software and hardware on one computer which would allow the speed of the dual probe scan to be increased dramatically.
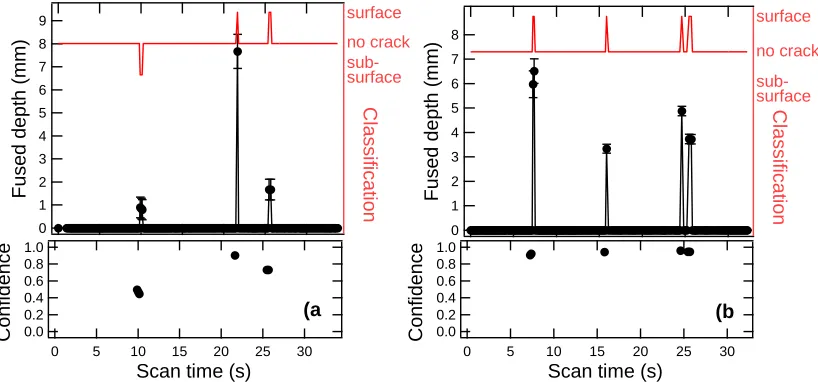
classification of each defect as surface or sub-surface in red as a function of scan time. For some defects the PEC probe was close to the defect for several pulses, so several points may be indicated for certain cracks. The lower section shows the confidence level for each measured depth. Confidence was measured using the error in the fused depth; for more reliable depth estimates the errors are low, and the confidence level will be close to one. For larger errors (less reliable measured depth estimates) the confidence level will be lower.
FIGURE 7. Scan results on the aluminium reference sample. (a) shows results on the side containing a subsurface defect; (b) shows results on the side containing angled and closely spaced slots.
Figure 7(a) shows the scan on the side containing a subsurface defect followed by two normal slots. As shown in the classification, three “defects” were measured, with the first defect in the scan indicated as subsurface. The measured depths agree well with the actual depths of the simulated defects. The confidence level for the subsurface defect depth is lower than for the others; neither system is currently very accurate at sizing subsurface defects, and the measured depth comes from the EMAT output only.
Figure 7(b) shows the scan of the aluminium sample on the side containing the angled and closely spaced defects. As can be seen all four defects were found, and the closely spaced defects were resolved. Again, the measured depths agree very well with the actual depths of the defects, with reliable depths found even for the angled slots. In fact, using both techniques together is beneficial when detecting angled slots – the PEC system tends to overestimate the depth slightly, whereas the EMATs tend to underestimate the depth by a similar amount, and the dual probe gives a depth close to the actual depth following fusion.
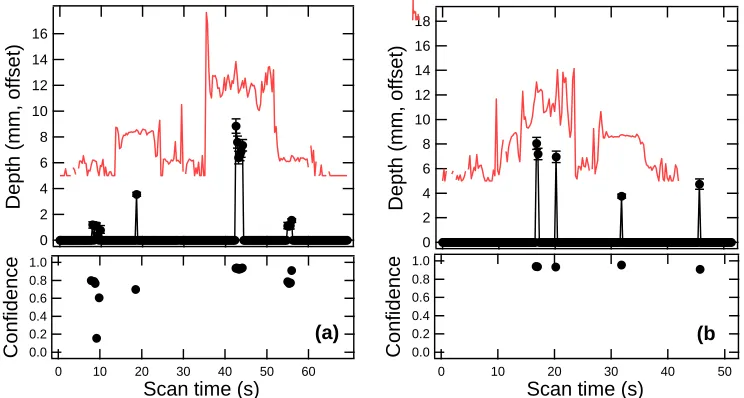
Measurements were also done on the steel reference sample. In this case, no classification is possible with the PEC system and it gives only the position of each defect it detects. In this case it is essential for an operator to also look at the output from the EMAT system, in case the PEC misses anything or has a false alarm due to noise. Figure 8 shows the results from each scan. In this figure the output fused depth is again shown as black points in the upper part of each figure. The program performs data fusion on the
8 7 6 5 4 3 2 1 0 Fused dept h (m m ) C lassi ficat ion surface no crack sub-surface 1.0 0.8 0.6 0.4 0.2 0.0 C onf idence 30 25 20 15 10 5 0
Scan time (s)
9 8 7 6 5 4 3 2 1 0 F used dep th (m m ) C lassi ficat ion surface no crack sub-surface 1.0 0.8 0.6 0.4 0.2 0.0 C onf idence 30 25 20 15 10 5 0
Scan time (s)
(a )
[image:8.612.98.507.178.369.2]depths from the EMAT amplitude and frequency measurements continuously with the final output depths (black points) only given when triggered by the PEC. The red trace (offset by a depth of 5 mm for clarity of the figure) shows the fused EMAT output, with the presence of defects shown by the top-hat nature of the depths.
FIGURE 8. Scan results on the steel reference sample.(a) shows results on the side containing a subsurface defect; (b) shows results on the side containing angled and closely spaced slots. The depth measurement from fusing the depths from the amplitude and frequency EMAT measurements (red) and final output (black) have been offset for clarity.
Figure 8(a) shows the scan over the side containing the subsurface defect. In this scan, the initial defect indicated by the fused output is due to noise from the PEC system; the EMAT output is also noise-dominated at this point, and improvements can be made by careful consideration of the chosen thresholds and the system grounding. The subsurface, 2 mm diameter hole is measured at a slightly later time and can be clearly seen in the fused EMAT output. For some of the defects several measurement points are given; scans of steel samples are slower when done by hand due to the presence of the strong magnets in the EMATs. Figure 8(b) shows results of the scan over the steel face containing angled and closely spaced slots. All four defects are detected and the closely spaced slots are resolved; by using the two systems together we gain depth measurements from the EMAT system and resolution of the closely spaced defects from the PEC system. In this sample the closely spaced slot depths are overestimated due to only using the EMATs to measure the depth. Improvements to the frequency measurement routine will enable this to be improved.
Measurements of samples containing real defects have also been performed, including samples of rail, and simulated stress corrosion cracking around a weld. Unfortunately the samples provided have not been large enough for the dual probe and trolley to be placed on the sample, so results have been taken and analysed separately. However, these results show good agreement with measurements using more traditional methods such as ACPD, with the use of two techniques as a check on the results from each probe proving beneficial. 18 16 14 12 10 8 6 4 2 0 D ept h (m m , of fset ) 1.0 0.8 0.6 0.4 0.2 0.0 C onf idenc e 50 40 30 20 10 0
Scan time (s)
16 14 12 10 8 6 4 2 0 D ept h (m m , of fset ) 1.0 0.8 0.6 0.4 0.2 0.0 C onf idence 60 50 40 30 20 10 0
Scan time (s)
(a) (b
CONCLUSIONS
We have presented measurements using a dual probe system combining a PEC probe with a pair of EMATs generating and detecting surface ultrasonic waves in a pitch-catch geometry, in order to detect surface and near-surface defects. On all the samples studied, the PEC gives the location of the defect, with the depth measurement of surface defects and classification possible on aluminium samples. The EMAT probes can cope with faster scans due to measuring defects over a 150 mm long region of the sample for each pulse, and give depths for all surface and near-surface defects by assuming they are all surface defects. The deepest defect between the two EMATs at any time will dominate the signal. By combining the data analysis of the two systems and performing data fusion this probe is able to provide more information about each defect than is available when analysis of each system’s data is done independently – namely the classification and depth for all surface and near surface defects with their positions in aluminium samples, and depths and accurate positions in steel samples. Furthermore, the calculated depth of surface breaking defects is more reliable due to having several different measurements from the two techniques, and detection and analysis has been automated. The current speed limitation of the system is due to the use of two separate computers for data acquisition and analysis. Later developments would include a single hardware and software solution in order to increase the speed of data fusion.
ACKNOWLEDGMENTS
REFERENCES
1 J. Blitz and G. Simpson, Ultrasonic methods of non-destructive testing (1996) and Blitz J. Electrical and magnetic methods of non-destructive testing (1997), Chapman & Hall
2 D. Horn and W. Mayo, NDE reliability gains from combining eddy-current and ultrasonic testing, NDT&E International,33 (2000) 351–362.
3 C.W. Davis, S. Nath, J.P. Fulton and M. Namkung, Combined investigation of eddy current and ultrasonic techniques for composite materials, Review of Progress in Quantitative Non-destructive Evaluation, 14B (1994) 1295-1301.
4 A. Sophian, R.S. Edwards, G.Y. Tian and S. Dixon, Dual-probe methods using pulsed eddy currents and electromagnetic acoustic transducers for NDT inspection, Insight,47 (6) (2005) 341-345.
5 R.S. Edwards, A. Sophian, S. Dixon, G.Y. Tian and X. Jian, Dual EMAT and PEC non-contact probe: applications to defect testing, NDT&E International, 39 (2006) 45-52.
6 X.E. Gros, NDT Data Fusion, London: Arnold, 1997.
7 D.F. Cannon, K-O. Edel, S.L. Grassie and K. Sawley, Rail defects; an overview, Fatigue Fract. Engng. Mater. Struct,26 (2003) 865-887; W.R. Irving, Continuous casting of steel, Institute of Materials Publishing, London, 1993.
8 R.A. Smith and G.R. Hugo, Transient eddy current NDE for ageing aircraft – capabilities and limitations, Insight,43 (1) (2001) 14-25.
9 G.Y. Tian and A. Sophian, Defect classification using a new feature for pulsed eddy current sensors, NDT & E International,38(1) (2005) 77-82; A. Sophian, G.Y. Tian, D. Taylor and J. Rudlin, Design of a pulsed eddy current sensor for detection of defects in aircraft lap-joints, Sensors and Actuators A: Physical, 101
(1-2) (2002) 92-98.
10 S. Giguere, B.A. Lepine and J.M.S. Dubois, Pulsed eddy current technology: characterizing material loss with gap and lift-off variations, Research in Non-destructive Evaluation, 13 (3) (2001) 119-129.
11 I.A. Viktorov, Rayleigh and Lamb waves, Plenum Press, 1967.
12 R.S. Edwards, S. Dixon and X. Jian, Depth gauging of defects using low frequency wideband Rayleigh waves, Ultrasonics,44 (2006) 93–98.
13 H.M. Frost, Physical Acoustics XIV, Academic, New York, 1979, pp. 179-275.
14 S.B. Palmer and S. Dixon, Industrially viable non-contact ultrasound, Insight,45 (3) (2003) 211-217.
15 X. Jian, S. Dixon, K.T.V. Grattan and R.S. Edwards, A model for pulsed Rayleigh wave and optimal EMAT design, Sensors and Actuators A: Physical, 128 (2)(2006) 296-304
16 G.Y. Tian and A. Sophian, Reduction of lift-off effects for pulsed eddy current NDT, NDT & E International, 38 (4) (2005) 319-324.
17 R.S. Edwards, S. Dixon and X. Jian, Characterisation of defects in the railhead using ultrasonic surface waves, NDT&E International,39 (6) (2006) 468-475.
18 R.S. Edwards, X. Jian, Y. Fan and S. Dixon, Signal enhancement of the in-plane and out-of-plane Rayleigh wave components, Appl. Phys. Lett., 87 (2005) 194104.
LIST OF FIGURES
FIGURE 1. The dual probe design, showing the EMATs and the PEC probe with current dimensions.
FIGURE 2. Typical signals from (a) the EMAT system, (b) the PEC probe.
FIGURE 3. (a) The layout of the magnetic sensor array inside the PEC probe (dimensions in mm); (b) variation in the chosen feature for depth measurement with distance of probe centre from crack centre for different surface crack depths (mm, shown in legend), in an aluminium sample.
FIGURE 4. The PEC classification routine.
FIGURE 5. The aluminium reference sample design. Measurements given are approximate.
FIGURE 6. The data fusion process for steel and aluminium samples.
FIGURE 7. Scan results on the aluminium reference sample. (a) shows results on the side containing a subsurface defect; (b) shows results on the side containing angled and closely spaced slots.
BIOGRAPHIES
Rachel S Edwards obtained her DPhil in experimental condensed matter physics at Oxford University in 2002. Following this, she spent a year working as a Visiting Research Fellow at the University of Florida, before moving to Warwick to work as a postdoctoral researcher on several projects in non-destructive testing (NDT). She has recently been appointed as a Lecturer in Physics. Her research interests cover many applications of ultrasound, from NDT on pipes, to high speed measurements for the rail industry, and to measurements of the fundamental properties of single crystals.
Ali Sophian obtained his B.Eng.(Hons) and PhD in Electronics Engineering at the University of Huddersfield in 1998 and 2004 respectively. The PhD project was on NDT Pulsed Eddy Currents and was sponsored by TWI Ltd. Towards the completion of his PhD he was appointed as a research fellow at the same University and was involved in an EPSRC-funded project entitled ‘Non-contact dual probe using eddy current and
ultrasonic techniques’, in collaboration with the Department of Physics at the University of Warwick. Since the end of 2006 he has been working as a mechatronics engineer for Cummins Turbo Technologies, Huddersfield. His interests include sensor signal
processing and actuator control.
Steve Dixon obtained a BA (Physics) from Oxford University in 1988, and a PhD (Physics) from the University of Warwick in 1994. He is now the Ultrasonics Group Leader and a Senior Lecturer in the Department of Physics at the University of Warwick. His main area of expertise is in the field of non-contact ultrasonic techniques and
applications, from a fundamental research level through to the implementation of
equipment into industrial environments. He currently holds several EPSRC and European funded research grants has over 100 publications covering various journals, conference proceedings, reports and patent applications.