publisher policies. Please scroll down to view the document itself. Please refer to the repository record for this item and our policy information available from the repository home page for further information.
To see the final version of this paper please visit the publisher’s website. Access to the published version may require a subscription.
Author(s): D.L. Carroll, T.F. Kemp, T.J. Bastow and M.E. Smith Article Title: Solid-state NMR characterisation of the thermal transformation of a Hungarian white illite
Year of publication: 2005 Link to published version:
Transformation of a Hungarian White Illite
D. L. Carrolla, T. F. Kempa, T. J. Bastowa,b and M. E. Smitha*
(a) Department of Physics, University of Warwick, Coventry, CV4 7AL, UK.
(b) CSIRO, Division of Manufacturing and Infrastructure Technology, Private Bag 33, South Clayton MDC, Clayton, Victoria 3169, Australia.
Abstract
1
H, 27Al, 29Si and 39K solid state NMR are reported from a Hungarian illite 2:1 clay for samples heated up 1600oC. This single phase sample has a small amount of aluminium substitution in the silica layer and very low iron-content (~0.4 wt%). Thermal analysis shows several events that can be related to features in the NMR spectra, and hence changes in the atomic scale structure. As dehydroxylation occurs there is increasing AlO4 and AlO5-contents. The silica and gibbsite layers become increasingly separated as the dehydroxylation progresses. Between 900 and 1000oC the silica layer forms a potassium aluminosilicate glass. The gibbsite-layer forms spinel/γ-Al2O3 and some aluminium-rich mullite. Then on heating to 1600oC changes in the 29Si and 27Al MAS NMR spectra are consistent with the aluminosilicate glass increasing its aluminium-content, the amount of mullite increasing probably with its silicon-content also increasing, and some α-Al2O3 forming.
Key words: illite, solid state NMR, clay mineral, thermal processing, dehydroxylation
* Address for correspondence: M.E. Smith, Department of Physics,
University of Warwick, Coventry, CV4 7AL, UK.
Introduction
Clays form a technologically important group of minerals that have numerous industrial
uses being major components of whiteware products and fireclay bodies such as bricks, roof tiles
and cements. Clay firing is a very mature part of the ceramics industry and this thermal reaction is
amongst the most studied of all ceramic reactions [1-3]. There is usually a clear idea about the
equilibrium end point of the thermal breakdown, but the details of the intermediate states which usually have significant amorphous components have remained largely elusive. To obtain a
fundamental understanding of the thermal breakdown mechanism that will allow optimisation of
the processing of clay minerals it is necessary to study these materials with leading-edge, modern
spectroscopic techniques that can provide new unambiguous structural information.
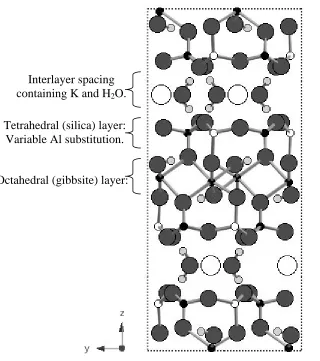
Clay minerals are layer structures with the layers lying in the ab plane which are then
stacked up parallel to the c-axis. The layers are of 2 types; silica-like layers made up of SiO4 units
and gibbsite-like layers made up of AlO4(OH)2. The two main groups of clays are those which
comprise repeat units of one silica and one gibbsite layer; 1:1 clay minerals, and those made up of
a sandwich of a single gibbsite layer between two silica layers; 2:1 clay minerals. Between these
repeated layers there are interlayer spaces (Figure 1). Complexity in clays may arise through
atomic substitutions that can occur within these layers. Some examples are aluminium substituting
for silicon in the silica-like layers, and iron and magnesium substituting for aluminium in the
gibbsite-like layer. These substitutions usually produce a negative layer charge which then needs
to be balanced by cations (e.g. Na+, K+,) which reside in the interlayer space. The interlayer space
can also accommodate varying amounts of water to hydrate these cations. The various layer
substitutions and interlayer contents can produce significant changes in the properties of the clay
including its thermal breakdown mechanism.
An important group of 2:1 clay minerals termed illite was first proposed in 1937 [4] to
those of the mica family. It has been generally accepted that the main difference between mica and
illite is that micas contain more potassium as interlayer cations, whereas illite contains more water
and silica. The general formula for illite can be expressed as K1.5Al4(Si6.5Al1.5)O20(OH)4 [5]. Earlier studies on illite-rich clays [6-9] using various techniques such as ESR and Mössbauer
show there are four main reaction processes which occur; viz. dehydration, dehydroxylation,
structural breakdown and re-crystallisation. Interlayer water is driven off by 350-400°C, followed
by dehydroxylation between 450-700°C, and irreversible structural breakdown ~900°C. The
formation of spinel typically occurs at 1000°C and continues to increase in amount and particle
size with increasing temperature. Other phases can form such as haematite, corundum, mullite and
glassy phases at higher temperatures, depending on the composition [9].
The presence of aluminium and silicon makes clays an obvious target for solid state NMR
because both of these nuclei are very amenable to such study [10-13]. There have been various
multinuclear NMR reports (especially 29Si and 27Al) of the thermal decomposition of clay
minerals. The most comprehensive NMR data set from clays has been for 1:1 clay minerals, such
as kaolinite [14-24] and related phases such as halloysite [25]. For 2:1 type clay minerals pyrophyllite is a cation-free clay that has no iron and it shows different thermal breakdown
characteristics from the cation-free 1:1 clay minerals, with much more AlO5 in the intermediate
dehydroxylate state [26-28]. Studies on muscovite using solid-state 29Si and 27Al NMR [29]
showed that the dehydroxylate phase decomposes (~1100°C) by separation of the silica layers,
which then combine with the cations (K+) forming a feldspar-like phase. The remainder of the
structure forms a spinel/γ-Al2O3 which then transforms into aluminous mullite, and then
corundum, and on further heating the mullite becomes more silica-rich by reacting with the
feldspar-like phase.
There have been more recent attempts to carry out multinuclear solid state NMR on clays
used industrially. A calcium montmorillonite (Fuller’s Earth) showed subtle structural changes of
the layers up to ~900oC when there is a significant break down into alumina-rich and silica-rich
domains [30]. In Lode an illite-rich clay of the mica group with a small amount of interstratified smectite, it was observed that compared to other 2:1 clays 27Al MAS NMR showed very little
AlO5 in the dehydroxylate, and at high temperatures an aluminosilicate glass was the dominant
phase [31]. The study of Lode indicated that exactly the same spectra were obtained from
powdered, pressed and extruded samples [31]. Another model illitic clay, Silver Hill, again
showed no AlO5 in the intermediate dehydroxylate [32].
One of the key difficulties with these previous NMR studies of illites is that they typically
had iron-contents of 4.8-7.1 wt% Fe2O3 which affects the NMR signal intensity, losing signal
from those nuclei close to the paramagnetic centres. This means that the spectra can only really be
interpreted qualitatively. For example, in Lode for silicon ~41% of the expected intensity was
observed at all temperatures, whereas for aluminium the signal intensity decreased from 41% in
the room temperature sample to only 22% in the sample heated to 1200oC. As new phases form,
the iron partitioning is often not uniform. In Lode and Silver Hill samples X-ray diffraction
(XRD) showed that mullite forms, but it was absent in the NMR data. Elemental analysis shows
that the iron-content of the mullite is significant and is subsequently lost from the NMR spectra.
This study reports multinuclear (1H, 27Al, 29Si, 39K) magnetic resonance from a Hungarian
white illite which has a very low iron-content (0.4 wt%). This greatly extends previous NMR studies of illitic clays since the intensity complications that arise from paramagnetic ions are not
present and quantitatively accurate results should be obtained. This study includes quantitative 1H
measurements, 27Al at two applied magnetic fields (14.1 and 18.8 T) and 39K. 39K has a natural
abundance of 93.1% and a relative receptivity of its central transition comparable to that of 13C. It
has been relatively little studied because it has a small magnetic moment making it a low-γ
carried out spectra are usually readily obtained. For example static 39K NMR spectra from a range
of model inorganic potassium salts showed relatively small dipolar coupling, resulting in sharp
powder pattern features of the observed central transition allowing accurate extraction of the quadrupole parameters as chemical shift anisotropy appeared to make only a very small
contribution [34]. In potassium-containing aluminosilicates it has been shown that from the
position of the centre-of-gravity (cg) of the static 39K resonances, the tectosilicate orthoclase
(~205 ppm) could be distinguished from phyllosilicates in which the cg position is below 40 ppm
[35]. Potassium NMR could also distinguish structural and exchangeable potassium in the clay
mineral montmorillonite as it undergoes wetting and drying [35]. For potassium aluminosilicate
geopolymers the cg positions varied from −47 ppm (more typical of a hydrated potassium phase)
in the unheated geopolymer, to −120 ppm in the material heated at 1300oC, consistent with the
position of an unheated feldspar [11].
Experimental methods
Chemical analysis of the white Hungarian illite studied here is shown in Table 1 which is
typical for potassium illite (of model composition (K1.5Al4(Si6.5Al1.5)O20(OH)4)). In the illite phase
studied here there is some calcium and a very small amount of iron substitution for aluminium in
the gibbsite layer. There were no other phases detected. Experiments were carried out on powders
which were heated to and from the desired temperature in the range 200-1600oC by ramping at
2oC/min, and were held at temperature for 2 hours. Differential scanning calorimetry (DSC) was
carried out on a Netzsch DSC 404 instrument using a ramp rate of 10oC/min under a static air
atmosphere up to 1300oC. Thermogravimetric (TG) analysis was carried out on a Stanton Redcroft
TG-750/770 instrument at a ramp rate of 10oC/min under flowing air up to 1000oC. XRD
the patterns measured over a 2θ range 10-90o at a scan rate of 0.15o(2θ)/min using Cu-Kα
radiation of wavelength 1.5418 Å. 29
Si MAS NMR experiments were carried out on a Varian-Chemagnetics CMX 360
Infinity Plus (8.45 T magnetic field) spectrometer. 29Si magic angle spinning (MAS) NMR spectra
were collected using a 6 mm probe spinning at ~5 kHz. A 15 s recycle delay was employed with a
1.2 μs (30o) pulse, which allowed relaxed spectra to be obtained. The spectra were collected at
71.54 MHz and referenced against TMS at 0 ppm. The 27Al MAS NMR spectra were collected at
18.8 T using a 4 mm probe spinning at 15 kHz with 1 μs (~15o) pulses and a 1 s recycle delay on a
Varian Chemagnetics Infinity Plus spectrometer operating at a frequency of 208.39 MHz. The
spectra were repeated at 14.1 T on a Varian-Chemagnetics Infinity spectrometer operating at a
frequency of 156.37 MHz. The pulse and recycle delay conditions were the same as at 18.8 T, but
a 3.2 mm Chemagnetics probe was used spinning at 18 kHz. The 27Al spectra were referenced
against the AlO6 resonance of Y3Al5O12 at 0.7 ppm†. 1H MAS NMR spectra were measured at
360.10 MHz using a Doty 4 mm probe spinning at 15 kHz. A recycle delay of 20 s was used to
ensure that the samples were fully relaxed. For the proton spectra the samples were weighed and the integrated signal intensity was compared to that from an adamantane sample which was also
weighed. A 1H spectrum was run on the probehead with an empty rotor under identical conditions
and the integral was subtracted from that of the samples. The adamantane was used as a secondary 1
H reference at 1.82 ppm. 39K static data was collected on a Varian Chemagnetics CMX 300
Infinity (7.05 T magnetic field) spectrometer at a frequency of 14.01 MHz using a static 10 mm
probe. An echo sequence was used with two 5 μs (sub-90o) pulses separated by 200 μs with a
recycle delay of 0.05 s. Extended phase cycling was used to suppress direct magnetisation and any
ringing [36]. 39K spectra were referenced against a static sample of solid KBr at 55.1 ppm.
†
Results
DSC results show a good deal of structure (Fig. 2(a)) with a number of endotherms and
one exotherm. The sharp exotherm is the α→β phase transition of quartz that is used as a
reference point. TG analysis (Fig. 2(b)) shows that there is initially a sharp drop of mass (~4%) up
to ~100-150oC which is the loss of interlayer water, continuing much more slowly up to 400oC.
Then another significant mass drop, commencing at 450oC is observed, with two distinct steps,
corresponding to the dehydroxylation process. There is no mass loss beyond ~800oC stabilising at
~91% of the initial value. There is good agreement of this mass loss with the loss on ignition of
the clay up to 1000oC of 8.2% determined during chemical analysis which corresponds to the loss
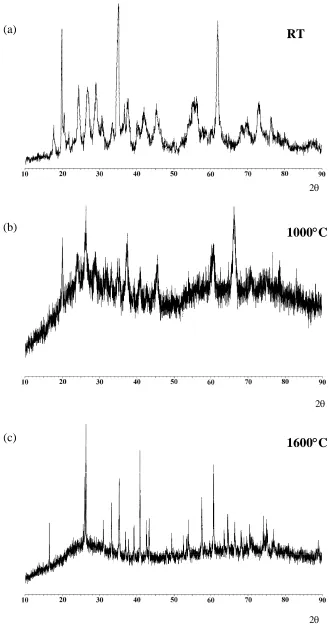
of water and hydroxyl species (Table 1). XRD patterns from selected samples are shown in Fig. 3.
In the initial room temperature sample a set of broad, but nevertheless definite reflections are
present. Such a pattern is typical of a clay and the pattern indexed in accordance with the patterns available in the crystallographic databases for illite (i.e. K1.5Al4(Si6.5Al1.5)O20(OH)4). After heating
to 1000oC some very weak reflections are observed which are difficult to assign and there are
some very broad features from the glass present. Then heating to 1600oC the crystalline reflections
have narrowed considerably, and can be assigned as a mixture of mullite and α-Al2O3. There is
still some broad underlying intensity from the glass that remains in the sample. 29
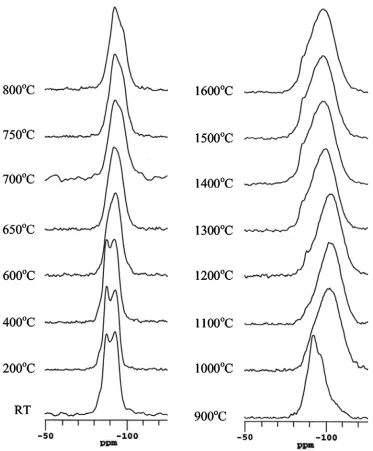
Si MAS NMR spectra are shown in figure 4 from all the samples, including the initial
clay at room temperature and those heated from 200 to 1600°C, with the peak positions and
linewidths summarised in Table 2. At ≤400°C, the spectra remain effectively unchanged showing
two resolved peaks at −86.8 and −92.0 ppm, and a small shoulder at −82.9 ppm (see Table 2). The
parameters for the peaks were deduced by fitting three Gaussian lines. Above 400°C, heating up to
900oC, there are only some minor changes in the spectrum with the clear resolution of the two
900 and 1000oC the 29Si MAS NMR spectrum undergoes a very significant change, with the peak
shifting to −100 ppm and the resonance getting very much broader. From 1000 to 1600oC only
small, but nevertheless distinct changes occur. The main broad resonance starts at −101 ppm, but
shifts progressively to −95.9 ppm at 1600oC. At 1200oC there is also a small, sharper peak that
appears at ~−86 ppm. This small peak increases in intensity with increasing heat treatment,
although it becomes less resolved as the main broader resonance moves to more positive shift.
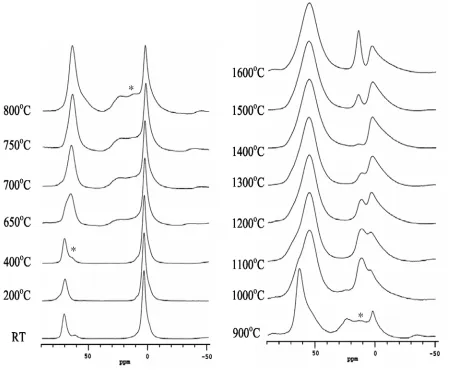
The corresponding 27Al MAS NMR spectra collected at 18.8 T are shown in Fig. 5 and are
described here in terms of their peak positions (Table 2) with the actual isotropic chemical shifts
given in Table 3. As with the 29Si data no significant change is observed in the spectra of samples
heated to ≤400°C with two resolvable peaks present, a smaller one at 70 ppm (Table 2)
corresponding to AlO4 and the major peak at 4.4 ppm assigned to AlO6. Then at 650oC some
noticeable changes start to occur with both the initial resonances broadening. The AlO6 signal in
particular develops a distinctive tail to negative shift. There is also some evidence of an additional
resonance at intermediate shifts (~25 ppm, Table 2). Above 600°C, the AlO6 peak continues to
decrease in intensity until 900°C, when the original sharp peak at 2.5 ppm has very low intensity.
The octahedral peak is replaced by AlO4 and AlO5 signals, and also a much broader AlO6
resonance. At 1000oC there is a marked change in the spectrum with the AlO6 region now
showing two AlO6 resonances at 12 and 4 ppm. The AlO5 peak completely disappears and there is
a profound change in the AlO4 peak. The AlO4 peak changes both its shape and shows a
significant shift of ~10 ppm. Then with increasing heat treatment temperature the fraction of AlO4
increases and there is changing intensity between the two AlO6 resonances observed, until at
1400oC there is very little intensity left in the 12 ppm AlO6 resonance. At 1500oC a new AlO6
resonance appears at 14.9 ppm which increases in intensity on heating up to 1600oC.
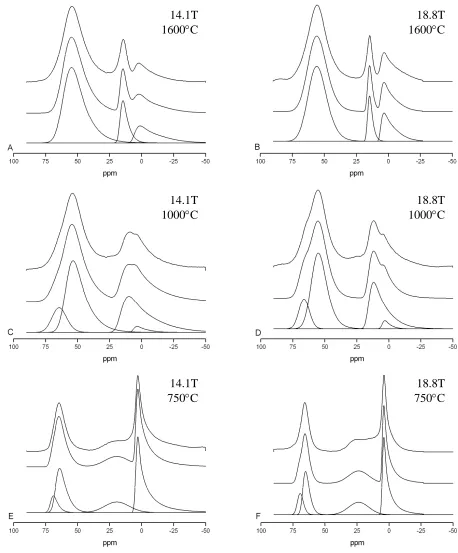
By carrying out the experiment at 18.8 T, the high magnetic field reduces second-order
example, between the different AlO6 resonances seen in samples heated in the range 1000 to
1400oC. When the lineshapes from quadrupole nuclei do not show well defined second-order
quadrupolar features, such as singularities, unambiguous simulation of the lineshape is difficult, especially if the data is obtained at only one magnetic field. Taking data at a second magnetic field
allows more definite lineshape analysis. The spectra have been simulated using a programme
QuadFit assuming second-order quadrupolar lineshapes including a distribution of the interaction
parameters. A simple Gaussian distribution of the quadrupolar coupling constant about a mean
value is taken along with an additional Gaussian broadening representing a chemical shift
distribution (Δ). The parameters are iterated between the two fields until a single set of parameters
(that include the isotropic chemical shift (δiso), the quadrupole coupling constant (χQ) and the
width of the distribution in the quadrupole interaction (ΔχQ) and the additional Gaussian
broadening (Δ)) are arrived at that gives the best simulation at both fields [38]. Some examples of
typical simulations are shown in Fig. 6. The NMR interaction parameters derived from the two
field simulation are given in Table 3. In samples from the unheated one to that heated to 400oC the
spectra are essentially identical, with ~28±3% of the aluminium present as AlO4. The simulations
are of the centrebands so that with finite spinning speeds that amount of intensity will depend on
the factor (χQ2/νoνr) where νo is the Larmor frequency and νr is the spinning speed [11,39]. There
is only 4% difference in this factor between the two sets of conditions used here. To get the true
intensity distribution between the different sites the simulated intensity needs to be corrected to
account for the fraction of intensity that appears in the centreband [11,39]. However for most sites
(χQ < 7.5MHz) this correction is smaller than the 3% error estimated in the simulation and even
for the largest value of χQ of 10 MHz because of the high fields and quite fast spinning employed
here 92% of the intensity still appears in the centreband simulation and so any correction will only
At 400oC there is still not really any change, e.g. in the aluminium distribution, but there
are some signs of precursors of change in that there is a slight increase in the quadrupole coupling
constant (χQ). After heating to 650oC the spectrum begins to change more rapidly as the AlO6
-content starts to drop as dehydroxylation occurs. The strong overlap between the two AlO4 signals
means that there is probably a larger degree of error in their parameters, but nevertheless it is clear
that there are two AlO4 species. The effect of the high field providing extra resolution can be seen
from there being a clear shoulder on the AlO4 signal. The AlO5 site that is formed only has a
moderate χQ but has a much larger broadening that scales with the magnetic field, indicative of the
chemical shift distribution being dominant. At 900oC when the structure is beginning to
significantly breakdown there is a large distortion of some of the environments. At 1000oC there is
a large change in the spectrum as the AlO5 is completely lost. There are definitely two AlO6 sites, with the main AlO6 site, which is presumably from a transitional alumina/spinel component,
having a large field gradient with a distribution showing that this site has a large variation in
parameters throughout the sample. There are two AlO4 sites, with the site at ~60 ppm probably
from the aluminosilicate glass. At 1200oC only a single AlO4 site is distinguishable. The
mullite-related AlO6 site remains with similar parameters, but above 1400oC a new AlO6 peak appears
with a shift ~17 ppm that increases in intensity with heat treatment temperature.
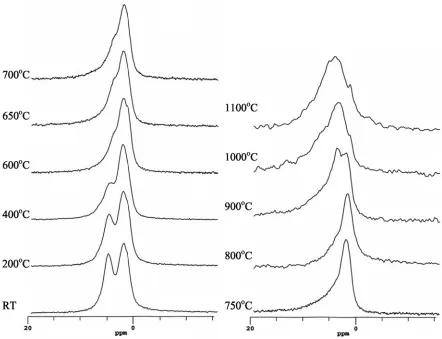
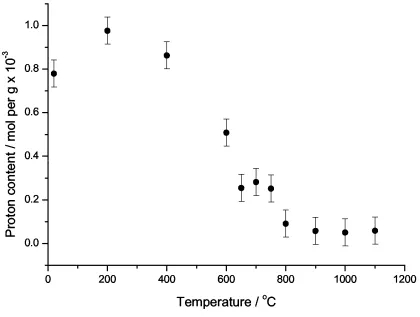
The proton MAS NMR spectra (Fig. 7) show that there are two distinct resonances in the
initial clay at 4.9 and 2.0 ppm. Neither of these two resonances has strong sidebands. There is
some sign oftwo peaks persisting even after significant heat treatment, but the higher shift (4.9-4.6
ppm) peak decreases in both peak amplitude and shift, and is probably completely lost at 750oC.
The 2.0 ppm peak persists up to 900oC, while at higher temperatures still a very much broader,
weak peak is observed with a shift of ~3.7 ppm. The absolute intensity of the proton signal was
also deduced by comparing the integrated signal from a weighed adamantane standard. The
proton-content remains very approximately constant up to ~400oC and the spectra do not really change,
although the peak at ~4.9 ppm does get a bit broader than at lower heat treatment temperatures so
that the resolution is worse. There is no increase in the absolute intensity of the 2.0 ppm peak within the accuracy of the measurements. From 400oC there is a decrease in the overall intensity
with increased heat treatment, up to ~800oC, after which the proton-content remains
approximately steady at only ~5% of the original level. 39
K static NMR spectra are shown in Fig. 9. In the initial clay there is a well defined single
resonance at −41 ppm, with good signal to noise obtained even though the potassium-content is
only ~3.6at%. The lineshape shows some asymmetry to negative shift. There is no real change up
to 900oC with the peak position remaining approximately constant and a small increase in the
linewidth up to this point. After heating at 1000oC although the peak position does not really
change, remaining at ~−50 ppm, the resonance has become much broader. With further heat
treatment the width of the spectra becomes slowly greater and increasingly asymmetric.
Discussion
In heating a clay the main reactions that occur initially are the loss of protons both as water
from the interlayer space that is hydrating the cations, and from the hydroxyls of the gibbsite
layer. It would appear from the absolute signal intensity that there is very little proton signal loss
up to 400oC, but TG analysis shows a 4% mass loss up to ~400oC. The difference between thermal
analysis and NMR experiments is that the samples for the 1H MAS NMR spectra have been
cooled back to room temperature and the water can re-enter the system, whereas the thermal
analysis is of course carried out at temperature. The high shift signal at ~4.9 ppm gets broader and
changes shift (Table 4) suggesting that this is associated with the water, and as it is interacts again
with the potassium it appears less ordered than in the sample prior to any heat treatment. The other
determined for hydroxyls in kaolinite at 2.8 ppm [40]. Then at higher temperatures this peak gets
much weaker as the process is no longer reversible. The significant loss of proton signal intensity,
effectively starting at ~400oC and carrying on up to ~800oC is associated with the dehydroxylation of the gibbsite layer. Finally there is a very broad proton peak remaining even at >1000oC. This is
a very weak signal of only ~5% of the initial intensity and is probably only the surface interacting
proton-species that are almost always present on the surfaces of such aluminosilicates.
It is clear from both the 29Si and 27Al NMR that below 400°C the dehydration process
which occurs in the interlayer space has no affect on the environments in the silica and gibbsite
layers. The 27Al MAS NMR spectra show that as expected most of the aluminium is present as
AlO6 from the gibbsite layers. There is some AlO4 that corresponds to substitution in the silica
layer. The AlO6:AlO4 ratio determined experimentally of 2.6±0.1 agrees well with the ratio
expected for the ideal illite composition of 2.7. The aluminium substitution in the silica layer
conveys a negative charge to these layers and is charge balanced by the interlayer potassium. In
the unfired clay the 29Si MAS NMR spectra reveal a silicon shift characteristic of Q3 sites. For
layer aluminosilicates such as illites and closely related clay minerals such as muscovite
resolution of different sites is often limited as the presence of iron greatly degrades the resolution
of such 29Si MAS NMR spectra. In Lode for instance [31] there were hints of at least two distinct
silicon sites. For other closely related micaceous minerals resolution of different Q3 silicon sites
have sometimes been observed [41]. These different sites are usually attributed to a single
crystallographic distinct silicon site in the layer with varying numbers of next nearest neighbour
(nnn) aluminiums. The three 29Si resonances observed here can therefore be assigned as Q3(0Al),
Q3(1Al) and Q3(2Al) to the peaks at −92.0, −86.8 and −82.9 ppm respectively [41]. The relative
intensities of these lines obtained from fitting the spectrum are 60±4%, 35±4% and 5±2%. Various
models have been advanced for the dispersion of the aluminium within such aluminosilicate
there is a tendency for the dispersion to be stronger than this, various studies indicating a
homogeneous dispersion within the layer usually gives a better description [42,43]. Comparing the
relative intensity of the three species observed in the spectrum, Lowenstein’s rule would give 45% Q3(0Al), 41% Q3(1Al) and 12% Q3(2Al), while a homogeneous distribution would give 54%
Q3(0Al), 40% Q3(1Al), and 5% Q3(2Al). It is clear from the intensity distribution determined from
the illite studied here that the aluminium distribution much more closely matches the
homogeneous model than that from Lowenstein’s rule.
After heating to 650oC, small but definite changes commence in the layer structure, most
noticeably for the aluminium sites where there is a small broadening of the AlO6 site, but the most
noticeable difference is the formation of some AlO5 (~14%). The AlO4 resonance broadens and
shows a shift. The 650oC data taken at 18.8 T is quite revealing in that the AlO4 region shows
definite structure, probably as a result of contributions from both aluminium still residing in the
silica layer and that forming as dehydroxylation occurs. The 29Si MAS NMR spectrum shows only
minor changes with a slight decrease of shift and increase in broadening so that the two main sites
can no longer be clearly resolved. This probably comes about as the silica layer distorts slightly as
the adjacent gibbsite layer starts to dehydroxylate. It is clear from the samples heated up to 800oC
that the peak position changes from ~−89 to ~−93 ppm. There is no reason to suppose at these
temperatures the aluminium-content of this layer is changing. For aluminosilicates there is
generally observed to be a decrease of the isotropic 29Si chemical shift with an increase in the
average Si-O-Si bond angle [11]. Hence a more negative 29Si chemical shift may indicate that as
the adjacent gibbsite layer dehydroxylates and starts to separate the average Si-O-Si bond angle
increases. Then, with continued heating up to 900oC the silicate layer shows little further change
in both its peak position and broadening. The 27Al MAS NMR spectra always show some AlO5 in the same temperature range, and increasing AlO4 as the AlO6-content decreases as
compare the development of AlO5 here with that formed in related clay phases. Calcium
montmorillonite shows a small amount of AlO5 [30], with none present in Lode [31], indicating
that there is great variation in the stability of AlO5 in these intermediate, disordered phases formed from illite-related clay minerals. In pyrophyllite all aluminium becomes AlO5 in the intermediate
state [26]. One of the reasons that has been advanced for this difference is the nature of the cations
in the structure; Lode’s main cation is K+ and for Fuller’s Earth (montmorillonite) it is Ca2+, while
no cations are found in pyrophyllite. However potassium is also present in the illite studied here
and there is a definite AlO5 signal. Hence the results reported here indicate that the effects of the
nature of the interlayer cation are at most weak. It could be that the lack of AlO5 signal in Lode is
that the iron present is closely associated with the AlO5 that wipes out this signal from the NMR
spectrum. This data suggests that it is now more likely that other possible reasons that have been
advanced for differences between the amount of intermediate AlO5 formation are more likely. For
example the amount of intermediate AlO5 formation could be determined by whether the
hydroxyls in the octahedral layer are either cis-cis or cis-trans oriented, where cis has O-Al-OH
and trans OH-Al-OH configurations and this varies between different illites [44].
At 1000°C very significant changes occur in the spectra. For example, the silicon moves
from a shift of −92 ppm, typical of a Q3 peak, to −101 ppm in the Q4 chemical shift range. This is
indicative of the silica layer now becoming a connected three-dimensional network. The 29Si
NMR peak has also significantly broadened, indicating that the new silica-based phase forming is
much more structurally disordered than the initial layer. 27Al MAS NMR also shows large changes
in heating from 900 to 1000oC. The AlO5-content drops rapidly and the AlO4 changes peak
position from 65 to 55 ppm. There are two distinct AlO6 sites, both showing a significant tail,
indicating a large distribution of quadrupole interactions, although the spectrum is dominated by
the tail from the peak with an isotropic chemical shift of 18.8 ppm. The large changes in both the 29
this point. Thermal analysis shows a broad endothermic event from ~900-1100oC, which is
probably due to the layers forming three-dimensional nanodomains and silica-based layer forming
a glass. The changes in the 29Si chemical shift and the formation of the AlO4 peak at 52 ppm are both consistent with formation of an aluminosilicate glass. Potassium in the interlayer space
experiences some electric field gradient as indicated by the linewidth and asymmetry of the peak.
As the aluminosilicate glass forms, the potassium shows significant broadening, probably an
indication that potassium is taken up by the aluminosilicate glass, and in the glass potassium
experiences a much larger electric field gradient.
It is interesting to compare these results with those from other illite-rich clays such as Lode
[31] and Silver Hill [32]. After glass formation the 27Al MAS NMR spectra from these samples
showed a peak at ~52 ppm, indicating that all the aluminium became tetrahedrally coordinated.
The difficulty with these previous NMR studies of these clays was the largely unknown effect of
the iron-content, especially with respect to the differential loss of signal from different phases as
the iron present does not partition equally between them. In the current illite, where interpretation
is not hampered by signal loss through paramagnetic broadening, there is certainly significant
AlO6 content. There are two AlO6 peaks, one of which at 4 ppm is probably from mullite. This
mullite formation appears to occur before the 1200°C found for halloysite [25] and kaolinite [16,
20, 22]. However there is certainly another AlO6-containing phase which could be a γ-alumina or
spinel based phase present in this illite at these temperatures corresponding to the peak at ~12
ppm. Both the shift and χQ of the peak at ~12 ppm are characteristic of a transitional alumina
[12,45,46].
Then with more heating, further, but more subtle changes occur with the main peak in the
silicon spectrum shifting from −101 at 1000oC to −95 ppm at 1600oC. The AlO6 peak at ~4 ppm
gets more intense while that at 12 ppm decreases. A new peak at 15 ppm grows after heating
being present throughout this temperature range, but is gradually changing its composition,
dissolving more aluminium as the heat treatment temperature is increased. The evidence for this is
that the average 29Si isotropic chemical shift decreases, consistent with increasing numbers of aluminium next nearest neighbours, and the amount of AlO4 in the 27Al MAS NMR spectra
increases. The accepted overall illite formula (K1.5Al4(Si6.5Al1.5)O20(OH)4) is in very good agreement
with the chemical composition quoted in Table 1. Hence as the silica-based layers form the initial
potassium aluminosilicate glass, the Si:Al atomic ratio is likely to be Si6.5Al1.5 charge balanced
with K1.5. Based on this ratio of metals and simply scaling to reflect the formulae of the common
oxide components gives a chemical composition of K2O.Al2O3.8.6SiO2. The eutectic composition
in this region of the phase diagram corresponds to K2O.Al2O3.11.2SiO2 with glass of this
composition first appearing at 990±20oC [47,48]. Then the temperature dependence of the liquid
phase boundary is such that the silica-content of the liquid phase decreasing until at ~1100oC the
liquid phase should then match that of the initial layer composition (i.e. K2O.Al2O3.8.6SiO2). At
higher temperatures still the liquid should also have this composition, but is in contact with an
aluminium-rich phase so it is plausible that a further increase in the aluminium-content might
occur. Hence the glassy phase that initially forms can be expected to be more silica-rich than the
average layer composition. As it is heated to higher temperatures the phase diagram tie lines to the
liquid phase indicate an increasing aluminium-content. Hence the observed trends in the 29Si
chemical shift can be rationalised in terms of the expected changing composition of the glass. The 29Si MAS NMR spectrum from the sample heated to 1200oC shows the small, sharp
peak at −86 ppm that is partially resolved from the main glass resonance. This probably
corresponds to crystallisation of mullite, indicated by the small, sharp endothermic event at
~1200oC. At this point in the 29Si MAS NMR spectrum there is the appearance of a small sharp
peak at ~−86 ppm that comes from mullite. . The 27Al MAS NMR spectra also show formation of
the latter agreeing with the 15 ppm peak, and the glass component of the sample does not show up
strongly in the XRD. There is an interesting comparison of the 27Al NMR interaction parameters
that have been determined for the phases here and those that have appeared previously in the literature. Mullite has at least three distinct aluminium sites, one AlO6 and two AlO4, with one of
the AlO4 having an unusual isotropic chemical shift at 53 ppm from tetrahedra joined as triclusters
[49,50]. Detailed spectral simulations using satellite transition spectroscopy showed 3 different
AlO4 sites, with the AlO6:AlO4 ratio ~45:55. Considering the mullite in the sample heated to
1600oC, from the intensity observed in the AlO6 centreband associated with the mullite, this could
mean that up to ~20% of the AlO4 in these 27Al NMR spectra could be from the mullite, although
mullites with much lower AlO4-content can occur [25]. However no AlO4 site from the mullite
can be distinguished from the main AlO4 from the glass in the 1D MAS NMR spectra. The shifts
of the 2 AlO6 sites at 17.1 and 8.9 ppm agree, within the errors, to the known values for α-Al2O3
and mullite respectively. However the quadrupole coupling constants α-Al2O3χQ is ~2 larger than
well crystallised, single phase samples [45]. This is probably a result of it still being effectively
nanocrystalline and reflected in the local sites being more distorted. For the AlO6 in mullite there
is excellent agreement between the χQ from the simulation and the estimate made from the
linewidth both of which give 8.5 MHz, and there is reasonable agreement with the previous study
of a mullite that gave χQ of 7.3 MHz [50]. For this site the lineshape has a very pronounced tail
indicative of a significant spread of interaction parameters at these sites. Mullite is a solid solution
Al2(Al2+2xSi2−2x)O10−x and there have been careful studies examining how the NMR parameters
and occupancies of the different sites vary. For 27Al the NMR parameters and the AlO4:AlO6 ratio
vary with composition (x) [51,52]. Also the peak intensities of the different 29Si sites varies with
the aluminium/vacancy composition of the sample [51,53,54]. Hence in principle if the 29Si and 27
Al MAS NMR spectra can be accurately simulated more details about the nature of the mullite
occurring with at least two other phases with significant spectral overlap that precludes sufficient
accuracy to allow this approach to be followed.
The multinuclear NMR data presented here reveal some key details of the structural breakdown of this illite. In comparing the breakdown of illite to other clays there are some points
in common and clear differences. The silica and gibbsite layers to some extent behave somewhat
independently as the sample is heated. As dehydroxylation occurs the average aluminium
coordination is reduced, as a mixture of AlO5 and AlO4 form from AlO6. The amount of AlO5 that
forms is intermediate to that seen in other clay minerals. Effectively the layers start to form
separate phases. When the silica layer starts to form a separate aluminosilicate glass it dissolves
the interlayer potassium ions. From the amorphous dehydroxylated alumina phase a mixture of
other aluminous phases, probably spinel/transitional alumina and mullite form. Then at higher
temperatures some atomic intermixing occurs, with the glass phase probably increasing its
aluminium-content. Although not well resolved, which makes accurate deconvolution difficult,
there is certainly a 29Si peak at ~−86 ppm, that appears to increase with increasing heat treatment
For chemically simpler clays such as halloysite the mullite phase initially formed is alumina-rich
and its silicon-content increases at higher temperatures [25]. It may be that the same thing happens
here. The resolution observed here in the 29Si MAS NMR spectra, has shown for the first time in
an illite that the glass composition probably varies with heat treatment, consistent with increasing
AlO4-content of the sample. The assignments and suggestions made here for the thermal
breakdown of this very low iron-content illitic clay could be further tested by multiresonance
NMR experiments such as 1H-29Si cross-polarisation and correlation, and multiple quantum and
satellite transition MAS of 27Al. However, this paper illustrates the ability of multinuclear one
Conclusion
This report of multinuclear solid state NMR from a very low iron-content illitic clay
has provided atomic scale insight into the structural rearrangements that occur in this group of
clays as they are heated. It improves on previous work on such clay minerals through the study of
4 separate nuclei, and the fact that complications resulting from differential signal loss due to
paramagnetic iron is removed. The NMR complements bulk thermal and powder XRD analysis. Loss of interlayer water has little effect on the clay layers and is largely reversible, although the 1
H peak assigned to this water does shift on thermal cycling. Once hydroxyls start to come off
from the gibbsite layer the associated formation of lower coordination aluminium species (both
AlO4 and AlO5) is observed, with continued heating producing slightly more AlO5, but
considerably more AlO4. As the gibbsite layer dehydroxylates there are only small corresponding
changes in the neighbouring silica layers. After dehydroxylation the major structural event occurs
between 900 and 1000oC where the silica layer forms an aluminosilicate glass that contains the
potassium ions. At the same point alumina-rich mullite and spinel/γ-Al2O3 form. A common
theme observed in all clays to date studied in detail by solid state NMR is that at the point where
the remnant two-dimensional layer structure is lost the silica and gibbsite layers form essentially
separate three-dimensional nanodomain structures, although they are intimately mixed. The data
collected here also suggests that the glass subsequently changes composition with heat treatment,
dissolving more aluminium. At 1600oC the sample contains a mixture of potassium
aluminosilicate glass, mullite and probably α-Al2O3, although for the crystalline samples the
quadrupole interactions and the spread of values suggest that the local structure remains quite
distorted even after significant heating. Insight is clearly provided by MAS NMR studies, such
Acknowledgements
The EPSRC and University of Warwick are thanked for funding NMR equipment,
the Nuffield Foundation is thanked for providing a summer bursary to D.L. Carroll and the
Leverhulme Trust for providing a visiting professorship to T.J. Bastow. S. Certoks, R. Svinka and
V. Svinka, Riga Technical University are thanked for provision of the sample and an accurate
chemical analysis.
References
[1] G.W. Brindley, M. Nakahira, J. Am. Ceram. Soc. 42 (1959) 311.
[2] G.W. Brindley, J. Lemaitre, Chemistry of Clays and Clay Minerals, Longman, Harlow, 1990. [3] W.E. Worrall, Clays and Ceramic Raw Materials, Elsevier Applied Science, Barking, 1986. [4] R. E. Grim, R. H. Bray, W. F. Bradley, Am. Mineral. 22 (1937) 813.
[5] W.A. Deer, R.A. Howie, J. Zussman, An Introduction to the Rock-Forming Minerals. Longman Group, Hong Kong 1992.
[6] C.M. Earnest, Lecture Notes in Earth Sciences, Springer-Verlag Berlin, (1991) 270. [7] R.E. Grim, W.F. Bradley, J. Am. Ceram. Soc. 22 (1940) 242.
[8] P.J. Michael, W.R. McWhinnie Polyhedron 8 (1989) 2709. [9] E. Murad, U. Wagner, Clay Minerals 31 (1996) 45.
[10] G. Engelhardt, D. Michel, High Resolution Solid-State NMR of Silicates and Zeolites. John Wiley and Sons. Chichester (1987).
[11] K.J.D. MacKenzie, M.E. Smith, Multinuclear Solid State NMR of Inorganic Materials, Pergamon, Oxford, (2002).
[12] M.E. Smith, Appl. Magn. Reson. 4 (1993) 1. [13] D.E. Woessner, Am. Mineral. 74 (1989) 203.
[14] K.J.D. Mackenzie, I.W.M. Brown, R.H. Meinhold, M.E. Bowden, J. Am. Ceram. Soc. 68 (1985) 293.
[15] T. Watanabe, H. Shimizu, K. Nagasawa, A. Masuda, H. Saito, Clay Minerals 22 (1987) 37. [16] J. Sanz, A. Madani, J.M. Serratosa, J.S. Moya, S. Aza, J. Am. Ceram. Soc. 71 (1988) C418. [17] J.F. Lambert, W.S. Millman, J.J. Fripiat, J. Am. Chem. Soc. 111 (1989) 3517.
[18] J. Rocha, J. Klinowski, Phys. Chem. Minerals 17 (1990) 179. [19] R.C.T. Slade, T.W. Davis, J. Mater. Chem. 1 (1991) 361.
[20] D. Massiot, P. Dion, J. Alcover, F. Bergaya, J. Am. Ceram. Soc. 78 (1995) 2940. [21] K.J.D. Mackenzie, J.S. Hartman, K. Okada, J. Am. Ceram. Soc. 79 (1996) 2980. [22] P.A. Schroeder, R.J. Pruett, Am. Mineral. 81 (1996) 26.
[23] J. Rocha, J. Phys. Chem. B 103 (1999) 9801.
[24] H.P. He, J.G. Guo, J.X. Zhu, C. Hu, Clay Minerals 38 (2003) 551.
[25] M.E. Smith, G.S. Neal, M.B. Trigg, J. Drennan, Appl. Magn. Reson. 4, (1993) 157. [26] J.J. Fitzgerald, S.F. Dec, A.I. Hamza, Am. Mineral. 74 (1989) 1405.
[30] S.R. Drachman, G.E. Roch, M.E. Smith, Solid State NMR 9 (1997) 257.
[31] G.E. Roch, M.E. Smith, S.R. Drachman, Clays and Clay Minerals 46 (1998) 694.
[32] C.J. McConville, G.E. Roch, W.E. Lee, M.E. Smith, CIMTEC 2002 “Science for New Technology of Silicate Ceramics” (2003) 97.
[33] M.E. Smith, Ann. Rep. NMR Spectro. 43 (2000) 121. [34] T.J. Bastow, J. Chem. Soc., Faraday Trans. 87 (1991) 2453.
[35] J.-F. Lambert, R. Prost, M.E. Smith, Clays and Clay Minerals 40 (1992) 253. [36] A.C. Kunwar, G.L. Turner, E. Oldfield, J. Magn. Reson. 69 (1986) 124. [37] M.E. Smith, E.R.H. van Eck, Prog. NMR Spectrosc. 34 (1999) 159. [38] T.F. Kemp, MSc Thesis, University of Warwick (2004).
[39] D. Massiot, C. Bessada, J.P. Coutures, F. Taulelle, J. Magn. Reson. 90 (1990) 231. [40] S. Hayashi, T. Ueda, K. Hamamizu, E. Akiba, J. Phys. Chem. 96 (1992) 10922. [41] J. Sanz, J.M. Serratosa, J. Am. Chem. Soc. 106 (1984) 4790.
[42] C.P. Herrero, J. Sanz, J.M. Serratosa, J. Phys. Chem. 93 (1989) 4311.
[43] S.K. Lausen, H.Lindgreen, H.J. Jakobsen, N.C. Nielsen, Am. Mineral. 84 (1999) 1433 [44] V.A. Drits, G. Besson, F. Muller, Clays and Clay Minerals 43 (1995) 718.
[45] D. Freude, Encyclopedia of Analytical Chemistry, Ed. R.A. Meyer, John Wiley and Sons Ltd, Chichester, (2000) 12188.
[46] G. Kunath-Fandrei, T.J. Bastow, J.S. Hall, C. Jäger, M.E. Smith, J. Phys. Chem. 99 (1995) 15138.
[47] J.F. Schairer, N.L. Bowen, Bull. Soc. Geol. Finlande 20 (1947) 74
[48] J.S. Brown, in Phase Diagrams in Advanced Ceramics, Ed. A.M. Alper, p55 Academci Press, London, 1995.
[49] L.H. Merwin, A. Sebald, H. Rager, H. Schneider, Phys. Chem. Minerals 18 (1991) 47.
[50] G. Kunath-Fandrei, P. Rehak, S. Steuernagel, C. Jäger, Solid State NMR 3 (1994) 241.[51] I. Jaymes, A. Douy, D. Massiot, J.P. Coutures, J. Chim. Phys. PCB 92 (1995) 1851
[52] P. Rehak, G. Kunath-Fandrei, P. Losso, B. Hildmann, H. Schneider, C. Jäger, Am. Mineral. 83 (1998) 1266.
[53] T. Ban, K. Okada, J. Am. Ceram. Soc. 76 (1993) 2491.
Table 1. Chemical analysis of Hungarian White Illite
Component Content (wt %)
SiO2 49.6
Al2O3 33.0
CaO 1.6
Fe2O3 0.4
K2O 6.6
Loss on ignition (400oC) 4.3
Loss on ignition (1000oC) 3.9
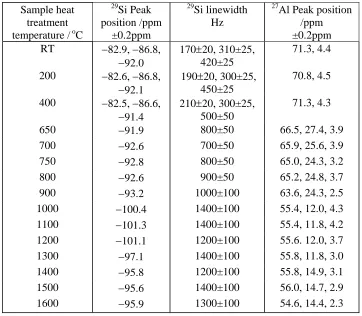
Table 2. Summary of 29Si MAS NMR linewidths and peak positions and 27Al peak positions at 18.8 T from an Hungarian white illite heated at various temperatures up to 1600oC.
Sample heat treatment temperature / oC
29 Si Peak position /ppm ±0.2ppm 29 Si linewidth Hz 27
Al Peak position /ppm ±0.2ppm RT −82.9, −86.8,
−92.0
170±20, 310±25, 420±25
71.3, 4.4
200 −82.6, −86.8,
−92.1
190±20, 300±25, 450±25
70.8, 4.5
400 −82.5, −86.6,
−91.4
210±20, 300±25, 500±50
71.3, 4.3
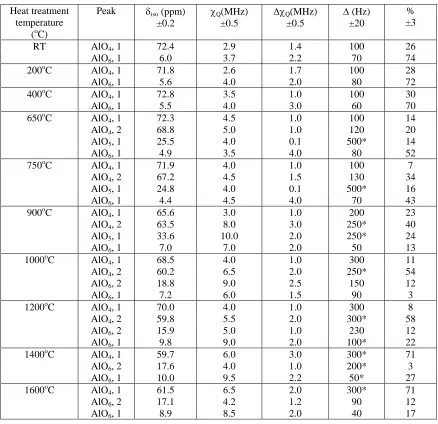
[image:23.595.109.471.373.689.2]Table 3. Summary of 27Al NMR interaction parameters deduced by 2 field NMR data simulated using the QuadFit programme from an Hungarian white illite heated at various temperatures up to 1600oC.
Heat treatment temperature
(oC)
Peak δiso (ppm)
±0.2
χQ(MHz)
±0.5
ΔχQ(MHz)
±0.5
Δ (Hz) ±20
% ±3
RT AlO4, 1 72.4 2.9 1.4 100 26
AlO6, 1 6.0 3.7 2.2 70 74
200oC AlO4, 1 71.8 2.6 1.7 100 28
AlO6, 1 5.6 4.0 2.0 80 72
400oC AlO4, 1 72.8 3.5 1.0 100 30
AlO6, 1 5.5 4.0 3.0 60 70
650oC AlO4, 1 72.3 4.5 1.0 100 14
AlO4, 2 68.8 5.0 1.0 120 20
AlO5, 1 25.5 4.0 0.1 500* 14
AlO6, 1 4.9 3.5 4.0 80 52
750oC AlO4, 1 71.9 4.0 1.0 100 7
AlO4, 2 67.2 4.5 1.5 130 34
AlO5, 1 24.8 4.0 0.1 500* 16
AlO6, 1 4.4 4.5 4.0 70 43
900oC AlO4, 1 65.6 3.0 1.0 200 23
AlO4, 2 63.5 8.0 3.0 250* 40
AlO5, 1 33.6 10.0 2.0 250* 24
AlO6, 1 7.0 7.0 2.0 50 13
1000oC AlO4, 1 68.5 4.0 1.0 300 11
AlO4, 2 60.2 6.5 2.0 250* 54
AlO6, 2 18.8 9.0 2.5 150 12
AlO6, 1 7.2 6.0 1.5 90 3
1200oC AlO4, 1 70.0 4.0 1.0 300 8
AlO4, 2 59.8 5.5 2.0 300* 58
AlO6, 2 15.9 5.0 1.0 230 12
AlO6, 1 9.8 9.0 2.0 100* 22
1400oC AlO4, 1 59.7 6.0 3.0 300* 71
AlO6, 2 17.6 4.0 1.0 200* 3
AlO6, 1 10.0 9.5 2.2 50* 27
1600oC AlO4, 1 61.5 6.5 2.0 300* 71
AlO6, 2 17.1 4.2 1.2 90 12
AlO6, 1 8.9 8.5 2.0 40 17
Table 4. Summary of 1H MAS NMR peak positions from an Hungarian white illite heated at various temperatures up to 1100oC.
Sample heat treatment temperature / oC
1
H peak position /ppm
±0.1 ppm
RT 4.9, 2.0
200 4.8, 2.1
400 4.6, 2.2
600 2.1 650 2.2 700 2.0 750 2.0 800 1.8
900 3.8, 2.0
1000 3.5 1100 4.2
Figure Captions
Figure 1 Schematic structural picture of a 2:1 clay mineral such as illite.
Figure 2. (a) Differential scanning calorimetry and (b) thermogravimetric analysis from a white Hungarian illite heated at 10°C/minute in air.
Figure 3. XRD patterns from a Hungarian white illite clay at (a) room temperature, and after heating to (b) 1000oC and (c) 1600oC.
Figure 4 29Si MAS NMR spectra of a Hungarian white illite clay heated at various temperatures up to 1600oC for 2 hours.
Figure 5 27Al MAS NMR spectra of a Hungarian white illite clay heated at various temperatures up to 1600oC for 2 hours at a magnetic field of 18.8T. (* indicates spinning sidebands)
Figure 6 Examples of the simulation of the 27Al MAS NMR spectra of a Hungarian white illite clay using the QuadFit programme for samples heated for 2 hours to 1600oC (A,B), 1000oC (C,D) and 750oC (E,F). Data was taken at 14.1 T (A,C,E) and 18.8 T (B,D,F) with each showing the separate components (lower), complete simulation (middle) and the experimental data (top)
Figure 7 1H MAS NMR spectra of a Hungarian white illite clay heated at various temperatures up to 1100oC for 2 hours.
Figure 8 The absolute proton-content of a Hungarian white illite clay heated at various temperatures up to 1100oC for 2 hours as deduced by quantitative proton NMR and corrected for probe background.
Figure 1 Schematic structural picture of a 2:1 clay mineral such as illite.
Potassium
Oxygen Aluminium Silicon Hydrogen Interlayer spacing
containing K and H2O.
Tetrahedral (silica) layer: Variable Al substitution.
Figure 3 XRD patterns from a Hungarian white illite clay at (a) room temperature, and after heating to (b) 1000oC and (c) 1600oC.
(a)
(b)
(c)
2θ 2θ 2θ RT
1600°C
Figure 5 27Al MAS NMR spectra of a Hungarian white illite clay heated at various temperatures up to 1600oC for 2 hours at a magnetic field of 18.8T (* indicates spinning sideband).
*
*
Figure 6 Examples of the simulation of the 27Al MAS NMR spectra of a Hungarian white illite clay using the QuadFit programme for samples heated for 2 hours to 1600oC (A,B), 1000oC (C,D) and 750oC (E,F). Data was taken at 14.1 T (A,C,E) and 18.8 T (B,D,F) with each showing the separate components (lower), complete simulation (middle) and the experimental data (top).
14.1T 1600°C
18.8T 1600°C
18.8T 1000°C 14.1T
1000°C
18.8T 750°C 14.1T