Institute for Prenatal Health, Wolfenbüttel, Germany. E-mail: *[email protected]
Received 17 June 2011; revised 11 July 2011; accepted 18 July 2011.
ABSTRACT
Introduction: A novel three dimensional approach for aneuploidy screening in the first trimester of preg- nancy was developed in which risk assessment derives directly from comparing the plotted data of nuchal translucency, pregnancy associated plasma protein A (PAPP-A), and free β-human chorionic gonadotropin (fβ-hCG) of an examined fetus with similar coordi- nates of fetuses with already known health status. Under this approach, it is possible to utilize either a ‘box’ or a ‘sphere’ model. In either case, optimal volume sizes and the benefits of adopting a ‘minimum number of required fetuses’ (MNR) have not yet been investigated; and for the box model, two modifica- tions, called ‘empty box results positive’ (EB+) and ‘simulation’ (SIM), provide additional options. It was the aim of this study to analyze which of the two mo- dels and their variants provides the best test perfor- mance. Methods: The study cohort was divided into a reference collective (n = 10,954) and a test collective (n = 4239). The test collective was examined repeat- edly, with another model and modification used on each occasion. Test performances were compared by the area under curve (AUC) of receiver operating characteristics (ROC) curves. Results: The sphere model was inferior to the box model when optimal vo- lumes were used with the latter and combined with the modifications EB+ and Sim. EB+ increased the number of assessable fetuses while Sim improved the test performance. MNR improved neither the box nor the sphere model. Conclusion: A new, optimized model in line with the obtained results should be developed and tested in further studies.
Keywords: Aneuploidy; Down Syndrome; First
Trimester Screening; Nuchal Translucency; Trisomy
1. INTRODUCTION
In order to detect fetal aneuploidies in early pregnancy, a non-invasive software-based screening for chromosomal aberrations in the first trimester (12th to 14th pregnancy week) has become the worldwide standard in recent de- cades [1,2]. Individual risk assessments for aneuploidies are obtained from the comprehensive interpretation of the fetal nuchal translucency thickness in mm according
to the crown-rump-length (NT), which is measured by
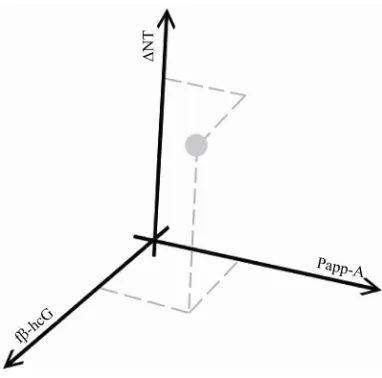
ultrasound, and the maternal blood serum concentration of pregnancy associated plasma protein A (PAPP-A), and free β-human chorionic gonadotropin (fβ-hCG) [3]. Dif- ferent methods have been developed for risk calculation [3-7]. Recent studies suggested the potential of a novel computer model called “Advanced First Trimester Scr- eening three dimensional (AFS-3D)” [8-10] in which each parameter is assigned to one axis in a three dimen- sional coordinate system (Figure 1). It could be demon- strated that most healthy fetuses accumulate around each parameter’s mean values, whereas most trisomy 21 cases are found to have elevated fβ-hCG in Multiple of Median
(MoM), lowered PAPP-A (MoM) and increased NT
values. Fetuses with trisomy 18 or 13 also typically pre- sent lower PAPP-A and increased NT values, but in con- trast to trisomy 21 cases, fβ-hCG is found in reduced
concentrations (Figure 2) [11]. Consequently, risk as-
sessment could directly derive from comparing the mea- sured values of each examined fetus with similar co- ordinates of fetuses with an already known health status (reference fetuses).
Figure 1. Example for the presentation of the fetal measurement values NT, PAPP-A and fβ-hCG in a three dimensional scatter plot.
Figure 2. Estimated distribution of measurement val-ues from healthy fetuses (centre) and cases with tri- somy 21, respectively trisomy 18 or 13 (left).
were considered for risk assessment (Figure 3). The re- sults showed an excellent test performance with a sensi- tivity of 81.61% and a false positive rate of 2.27%. How- ever, in discussions it was considered likely that the uti- lized model could still be further optimized.
Two additional modifications to the box model were proposed that could be applied either separately or in combination: 1) Empty box results positive (EB+): Ane- uplodies are more likely to be located in cubes which may be empty. Therefore, in order not to miss aneuplo- dies the test should always record a positive result if a cube contains no reference points. 2) Simulation (Sim): One healthy and one affected fetus are artificially added to the result in each cube. This was thought likely to lead to a reduction in the random error of boxes with very low numbers of reference points: If a box contained a few healthy fetuses, but would due to its location probably
Figure 3. Schematic picture of the AFS-3D box model. The surrounding space is divided into cubes. Only reference cases within the box of the examined fetus are considered for risk assessment. T = fetus of the Test Collective; R = tuses of the Reference Collective; NR = not referenced fe-tuses, as lying outside the box.
contain an affected fetus in a future examination, then this probability would already be taken into account in the simulation result. At the same time, in cubes with a large number of known fetuses, this addition would not markedly affect the result.
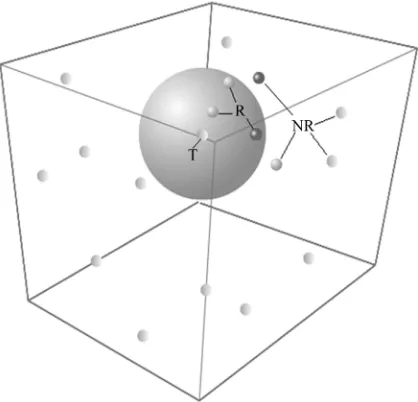
In addition to the box model, the potential benefits of a
sphere model were considered (Figure 4). Due to the
discrete positioning of the reference volumes in the box model, an examined fetus might be positioned close to a border. However, the adjacent box is not considered until the three dimensional plot crosses its edge. The result is a sudden ‘jump’ in relation to reference boxes when mov- ing a test-plot along one axis: imprecision occurs when considering reference fetuses that are closely distributed
in one direction along the axis of NT, PAPP-A or
fβ-hCG. It was thought that this might probably
nega-tively affect risk assessment. In contrast, in the innova-tive approach of the sphere model the data of the ob-served fetus is placed at the centre of a sphere whose radius is augmented until the plotted values of a certain number of reference fetuses are found within the bubble. It is thought that the positioning at the centre of the ref-erence volume could compensate the impact of the fur-ther plotted reference fetuses since these are bilaterally distributed.
[image:2.595.314.533.80.265.2] [image:2.595.74.270.315.468.2]Figure 4. Schematic picture of the AFS-3D sphere model. The data of the observed fetus is placed at the centre of a sphere. T = fetus of the Test Collective; R = fetuses of the Reference Collective; NR=Not Referenced fetuses, as ly-ing outside the sphere.
Figure 5. Illustration of divisions per ‘length of the edge’ (LE) in the box model. In this example, the LE equals 1 4.
fetuses contained within the sphere. The larger the box, or the bubble, the more reference fetuses are considered and, as a result, statistical evidence improves. At the same time however, as the volume increases the mea- surement values of the control group tend to differ more from the values of examined fetuses, and risk assessment may become more imprecise.
If, in contrast, smaller volumes are chosen, a large number of boxes that only take very similarly positioned reference fetuses into account emerge. On the one hand,
formance.
2. METHODS
The data of 15,193 combined first trimester screenings (FTS) with known fetal outcomes were collected be- tween May 1, 2000 and December 12, 2007 in seven German centers for prenatal diagnostics. The women vo- luntarily requested a FTS on the basis of information about this procedure from their gynecologist/obstetrician, the media or family members/friends. All examiners were trained and certified by the Fetal Medicine Founda- tion (FMF) and measurement of the nuchal translucency strictly followed FMF criteria. Biochemical analyses were performed with Brahms Kryptor systems (Brahms GmbH, Hennigsdorf, Germany).
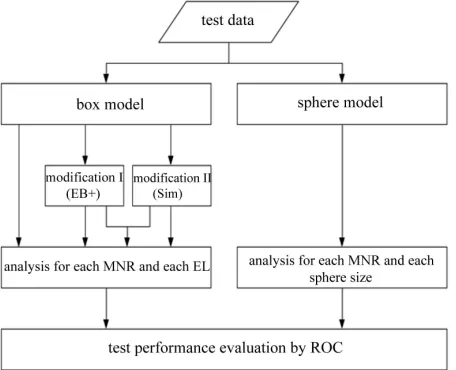
Within this study collective, the first 10,954 data sets collected served as a reference collective with which the 3D model was established. 4239 subsequently collected data sets from a medical practice served as a low risk test collective. This test collective was examined in multiple ways, with each recalculation exploring another model and modification as set out in Figure 6. For this purpose the working group designed and developed specific cal- culation software. Since the test performance could theo- retically change markedly depending upon the model and variant used, all combinations of all modifications were analyzed.
As valid cut off values were not available for these new methods, receiver operating characteristics (ROC) curves were generated in order to determine the areas under curve (AUC): The better the sensitivity at a given specificity, the greater the AUC. The statistical approach was validated by the Department of Medical Statistics and Biometry, Medical University of Hannover, Ger- many.
3. RESULTS
3.1. Study Population
Figure 6. Flowchart for the analysis of the different models and their modifications.
to 46 years, the arithmetic mean being 31.6 years. The (low risk) test group ranged from 16 to 46 years, with an arithmetic mean of 31.2 years. 1.07% of pregnancies in the reference group and 0.96% of pregnancies in the test cohort were affected by an abnormal karyotype. Figure 7 displays the age distribution curves of both study co-horts.
3.2. Box Model—Size
In this study the optimal size was found to be LE = 1/14, in which the best compromise between a high discrimi-natory power and enough reference fetuses in each box was attained.
3.3. Box Model—MNR
When applying the MNR concept no improvement was attained by increasing the MNR per box. The number of appraisable fetuses declined from 4225 to 4156 in set-tings with a minimum of five required cases. Simultane-ously, the AUC dropped from 0.8916 to 0.8864 in higher minimum count settings.
3.4. Box Model—Modification I (EB+)
Modification I did not change the AUC (0.9287 with and without EB+), but all fetuses from the test group could be analyzed when this additional function was applied, even if the respective box contained no fetus from the control group.
3.5. Box Model—Modification II (Sim)
Modification II improved the test performance, as the AUC increased from 0.9287 to 0.9331. However, risk could only be assessed in 4.225 out of 4.239 fetuses. In the remaining cases, not enough reference data was available.
Figure 7. Age distribution of study cohorts.
3.6. Box Model—Modification I + II (EB+ and Sim)
By combining modification I and modification II, the advantages of both modifications were obtained: The number of appraisable fetuses was 4.239 (= all fetuses), the same as with the exclusive application of modifica- tion I. In addition an elevated AUC of 0.9331 was regi- stered, which is equivalent to the exclusive application of modification II. Again, utilization of MNR together with modification I or II—either separately or in combination did not improve test performance.
3.7. Box versus Sphere Model
In contrast to our theoretical considerations, the box model generally offered better ROC values in this study than the sphere model.
3.8. Sphere Model—MNR
The application of MNR tended to result in an improved test performance in smaller bubbles. In larger bubbles
however, MNR ≤ 3 slightly worsened the test perfor-
mance. At MNR = 3, for example, the observed values ranged from an improvement of AUC by +7.04% (sphere size 100) to a worsening of AUC by –0.92% (sphere size 1500). Nevertheless, the AUC was generally higher in larger spheres: The highest AUC (0.9166) was found at a sphere size of 1.900 reference fetuses. The AUC was also high (0.9164) at sphere sizes 1.500, 3.400, and 3.500.
4. CONCLUSIONS
4.1. Comparability of the Populations
[image:4.595.60.288.80.265.2]4.2. Impact of MNR on the Test Performance
In the box model, the MNR concept did not improve test performance. The AUC was identical or worse in all analyses. Furthermore, in a large number of test cases a risk assessment could not be obtained due to empty re- ference boxes or too small a number of reference fetuses. In the sphere model, the MNR showed mixed results. At small sphere sizes up to 500 Units the best results were obtained if a certain number of reference fetuses were considered, including a minimum number of healthy and affected fetuses. Since larger spheres over 1000 Units probably contain enough healthy and affected fetuses anyway, the impact of MNR was low or non-existent.
Summarizing the results, MNR does not improve ei-ther the box or the sphere model and should not be ap-plied in developing improved methods in future.
4.3. Optimal Model
Considering the results of this study, the best test per-formance is reached when the model comprises the fol-lowing characteristics:
1) It is a box model.
2) The box size equals LE = 1/14.
3) Modifications I (EB+) and II (Sim) are applied in combination.
4.4. Importance of This Model
In comparison to the established approach to first trime- ster screening, this innovative model does not take ma- ternal age into account, as previous studies have shown that this would increase the number of falsenegative cases in younger mothers and the number of false-posi- tive cases in older mothers without significantly improv- ing the detection rate [5,6]. However, the most important innovation is the direct assessment of the risk of fetal aneuploidy through the assessment of the three-dimen- sional spatial arrangement of plotted data from screening data instead of the sequential multiplication of estimated risk from each of the measurements taken. Preliminary
that approach 100% in women over 40 years of age, with false-positive rates which are almost as high [16,17]. This means that the classic screening method is inevita-bly of very limited utility in respect to these age groups, as most or all women are subsequently referred for fur-ther invasive testing. At the same time these women are the number one target group for FTS. AFS-3D has been developed to solve this dilemma as it would allow for meaningful routine screening in this age group, thus re-ducing the risk of adverse outcomes of invasive testing, such as hemorrhage, infection and iatrogenic abortion.
4.6. Alternative Model Variant
The results of this study are not conclusive. Further im- provement could potentially be reached by modifying the sphere model. The floating positioning of the reference space under the sphere model is theoretically superior to the discrete positioning within the box model. Conse- quently, a model with static sized spheres could be deve- loped. This approach would combine the invariant size of the boxes with the centered test volume around the ex- amined fetus. EB+ and Sim would also be applicable in such a model.
Further studies are needed. In particular, the AFS-3D algorithm has still to prove its worth in clinical studies and comparative trials with other risk assessment algo- rithms that are already available on the market.
REFERENCES
[1] Krampl, E., Wertaschnigg, D. and Husslein, P. (2002) Down-syndrom-screening im ersten trimenon. Geburt- shilfe Frauenheilk, 62, 843-848.
[2] Wapner, R., Thom, E., Simpson, J.L., Pergament, E., Silver, R., Filkins, K., Platt, L., Mahoney, M., Johnson, A., Hogge, W.A., Wilson, R.D., Mohide, P., Hershey, D., Krantz, D., Zachary, J., Snijders, R., Greene, N., Sabba- gha, R., MacGregor, S., Hill, L., Gagnon, A., Hallahan, T. and Jackson, L. (2003) First-trimester screening for tri- somy-21 and 18. The New England Journal Medicine, 349, 1405-1413. doi:10.1056/NEJMoa025273
and Nicolaides, K.H. (1999) Maternal age and gestation- specific risk for trisomy 21. Ultrasound Obstetrics and Gynecology, 14, 167-170.
doi:10.1046/j.1469-0705.1999.13030167.x
[4] Scharf, A., Schmidt, P., Seppelt, M., Maul, H., Wüste- mann, M. and Sohn, C. (2003) Comparison of risk calcu- lation for trisomy 21 by Nicolaides with a novel software: Retrospective analysis of 744 cases. Geburtshilfe Frauen- heilk, 63, 148-152.
[5] Schmidt, P., Rom, J., Maul, H., Vaske, B., Hillemanns, P. and Scharf, A. (2007) Advanced first trimester screen- ing (AFS): An improved test strategy for the individual risk assessment of fetal aneuploidies and malformations. Arch Gynecology and Obstetrics, 276, 159-166.
doi:10.1007/s00404-007-0324-6
[6] Schmidt, P., Hörmansdörfer, C., Pruggmayer, M., Schütte, C., Neumann, A., Gerritzen, A., Vaske, B., Hillemanns, P. and Scharf, A. (2008) Improved prenatal aneuploidy scr- eening using the novel “advanced first trimester scree- ning” algorithm—A multicenter study of 10,017 pregnan- cies. Journal of Clinical Ultrasound, 36, 397-402.
doi:10.1002/jcu.20509
[7] Merz, E. (2007) First trimester screening—A new algorithm for risk calculation of chromosomal anomalies developed by FMF Germany. Ultraschall in Medecine, 28, 270-272. doi:10.1055/s-2007-963257
[8] Schmidt, P., Hörmansdörfer, C., Oehler, K., Hertel, H., Hillemanns, P. and Scharf, A. (2008) Dreidimensionale scatterplotanalyse zur risikoeinschätzung für fetale an- euploidien—eine weiterentwicklung des ersttrimester screenings. Z Geburtsh Neonatol, 212, 127-135.
doi:10.1055/s-2008-1004708
[9] Schmidt, P., Dormeier, J., Hörmansdörfer, C., Golatta, M., Scharf, A. and Hillemanns, P. (2008) Vorstellung einer neuen methodik zur visualisierung typischer befund kons- tellationen für euploide und aneuploide feten—Common bubbles im AFS-3D-Verfahren. Geburtsh Frauenheilk, 68,
S1-S194.
[10] Schmidt, P. and Dormeier, J. (2008) How to skin a scatter plot. Geburtsh Frauenheilk, 68, S1-194.
doi:10.1055/s-0028-1089239
[11] Wald, N.J. and Hackshaw, A.K. (1997) Combining ultra- sound and biochemistry in first-trimester screening for down’s syndrome. Prenatal Diagnosis, 17, 821.
doi:10.1002/(SICI)1097-0223(199709)17:9<821::AID-P D154>3.0.CO;2-5
[12] Hassold, T. and Schwartz, S. (2003) Chromosomen- aberrationen. In: Dietel, M., Dudenhausen, J. and Suttorp, N., Eds., Harrisons innere medizin—Dt. ausgabe der 15. Auflage in zusammenarbeit mit der charité. ABW- Wissenschaftsverlag, Berlin, 406.
[13] Wellesley, D., Boyle, T., Barber, J. and Howe, D.T. (2002) Retrospective audit of different antenatal screen- ing policies for down’s syndrome in eight district general hospitals in one health region. British Medical Journal, 325, 15. doi:10.1136/bmj.325.7354.15
[14] Olsen, C.L. (2003) Down syndrome: Interaction between culture, demography and biology in determining the pre- valence of a genetic trait. Human Biology, 75, 503-520. doi:10.1353/hub.2003.0059
[15] Kuppermann, M. and Norton, M.E. (2005) Prenatal test- ing guidelines: Time for a new approach? Gynecology and Obstetrics Investegation, 60, 6-10.
doi:10.1159/000083479
[16] Gebb, J. and Dar, P. (2009) Should the first-trimester aneuploidy screen be maternal age adjusted? Screening by absolute risk versus risk adjusted to maternal age. Prenatal Diagnosis, 29, 245-247.
doi:10.1002/pd.2157