DOI: 10.4236/jsip.2019.101001 Dec. 4, 2018 1 Journal of Signal and Information Processing
OCR Conversion
Amber Khan, Mariam Nida Usmani, Nashrah Rahman, Dinesh Prasad
*D/o Electronics & Communication Engineering, Jamia Millia Islamia (JMI), New Delhi, India
Abstract
In this paper, we propose a novel method to enhance the OCR (Optical Cha-racter Recognition) readability of public signboards captured by smart-phone cameras—both outdoors and indoors, and subject to various lighting condi-tions. A distinct feature of our technique is the detection of these signs in the HSV (Hue, Saturation and Value) color space, done in order to filter out the signboard from the background, and correctly interpret the textual details of each signboard. This is then binarized using a thresholding technique that is optimized for text printed on contrasting backgrounds, and passed through the Tesseract engine to detect individual characters. We test out our tech-nique on a dataset of over 200 images taken in and around the campus of our college, and are successful in attaining better OCR results in comparison to traditional methods. Further, we suggest the utilization of a method to auto-matically assign ROIs (Regions Of Interest) to detected signboards, for better recognition of textual information.
Keywords
Image Processing, HSV, Binarization, OCR
1. Introduction
We currently live in a world where phones have become smarter, with the ability to run fully functional operating systems, access the Internet, and capture photographs. The latter has been a recent development, making cameras more accessible and ubiquitous, due to the in-built cameras in smart-phones these days.
These in-built cameras can be put to better use for recognizing text in public spaces, especially signage—street signs, milestones or signboards inside buildings. OCR engines (Optical Character Recognition) have already accomplished this task
How to cite this paper: Khan, A., Usmani, M.N., Rahman, N. and Prasad, D. (2019) Pre-Processing Images of Public Signage for OCR Conversion. Journal of Signal and Information Processing, 10, 1-11.
https://doi.org/10.4236/jsip.2019.101001 Received: October 18, 2018
Accepted: December 1, 2018 Published: December 4, 2018
Copyright © 2019 by authors and Scientific Research Publishing Inc. This work is licensed under the Creative Commons Attribution International License (CC BY 4.0).
http://creativecommons.org/licenses/by/4.0/
DOI: 10.4236/jsip.2019.101001 2 Journal of Signal and Information Processing
on paper manuscripts and ancient documents [1], and are adept at it [2].
On the other hand, there is a dearth of software that can convert public signage into text. For this reason, we have chosen to build a unique workflow that can efficiently extract text from captured images of public signage, and save it as a text file. The benefits of such a methodology are tremendous, since it becomes a useful aid for visually impaired individuals, when text-to-speech capabilities are added to it. This may also be used in translation software, where foreign users take snapshots of signage, which are then converted into text in real time, and translated into the language the user is familiar with. It may also be viewed as an add-on feature in driverless vehicles, in which most of the navigation is done solely on the basis of input feed supplied by the various cameras mounted onto it, and GPS inputs. Hence, this ability to “read” public signage would be extremely useful in case of GPS failure, helping the autonomous vehicle to safely navigate to its destination.
All the program codes involved in the methodology are implemented in Python 3, in a virtualized Ubuntu environment. These programs are executed via commands passed through its Terminal program. For processing the dataset images, we have used OpenCV, an open-source library with state-of-the-art computer vision capabilities [3], allowing for quick implementation of our algorithm.
Our workflow generates a .txt file as an output, in which all characters in the captured image are correctly identified, with their relative positions somewhat retained in the text file.
This has the capacity to “compress” the image to a file over 10,000 times smaller than itself. Given the limited storage one faces with saving high resolution images on his or her smart-phone, this is an added advantage, apart from the text detection feature.
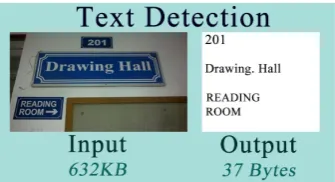
In our research, we have created and utilized two datasets of images, with the first one containing 133 images of signage around the college campus, and the second one comprising of 135 images of signage inside the girls’ hostel. Both provide a variety of images to test out our technique on, with the former dataset containing mostly blue signboards, and the latter one containing brown signboards. As seen in Figure 1, these images have been fed into our algorithm, which takes one signboard image as input, and generates a corresponding text file as its output. The intermediate and final outputs of both the datasets have been compared, and explanations for these formulated. We find that our methodology significantly improves upon existing techniques, giving rise to better OCR output.
2. Previous Work
DOI: 10.4236/jsip.2019.101001 3 Journal of Signal and Information Processing Figure 1. Expected output from implemented
workflow.
Following are the steps involved in Canny Edge Detection: 1) Image smoothing
The image is blurred to remove noise, using a Gaussian filter. 2) Finding gradients
In this smoothed image, the gradient of each pixel calculated using the Sobel operator [6] in the x and y directions. This gives us the values Gx and Gy.
After this, the gradient magnitude “G” (also called edge strength) is calculated using the formula
x y
G = G G+
Further, its angle “θ” is determined using the formula
1
tan y
x
G G
θ = −
The edges are then marked where the values of G are large enough. These edges will be blurry, and need to be fine-tuned, before further processing. 3) Non-maximum suppression
The blurred edges are sharpened here, by deleting all except the local maxima of the entire image.
For this, θ is rounded to the nearest 45˚, and the corresponding pixel is compared with the edge strengths of pixels in the positive and negative θ
directions.
If edge strength of the current pixel is largest, its value is preserved, else suppressed. The edges of the resultant image will be marked with a pixel-wise strength.
4) Double thresholding
The noise generated in the previous step is removed here. Two thresholds are used by the Canny detector—a “high” threshold, and a “low” threshold. Hence, edge pixels stronger than the high threshold are labelled as “strong”, edge pixels weaker than the low threshold are suppressed, and edge pixels between the two thresholds are labelled as “weak”.
5) Edge tracking
DOI: 10.4236/jsip.2019.101001 4 Journal of Signal and Information Processing
3. Methodology
The input here is an image captured by a smart-phone camera—either a JPEG or PNG file. In the first step of our technique, the “text area” of the image—the signboard—is identified, and masked off from the background. This filtering out of the signboard is done on the basis of the HSV [7] range of the signboard, a technique known to perform quite effectively for images take in natural environments [8]. This masked image is then zoomed automatically, to retain only the signboard(s).
In the binarization process, the zoomed image is converted to a monochrome (black-and-white) one. This is carried out using the CBDAR_KASAR binarization method [4].
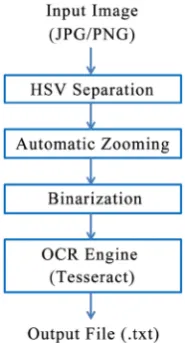
Finally, as seen in Figure 2, text characters are extracted from this binarized image using Tesseract, an open-source OCR engine. Originally developed by Hewlett Packard and presented in 1995 by S. V. Rice et al. [9], its development is now sponsored by Google.
A) HSV Separation
The input, a colour image captured using a smart-phone, is first sent for HSV separation, a technique already in use in meteorology [10] and medicine [11]. Here, the signboard(s) in each image is/are detected, and a resultant ROI created for each image. For each dataset, a separate HSV range was used, as follows:
• (91, 42, 0) - (124, 255, 255) for the blue signboards (in the campus dataset);
and
• (0, 135, 50) - (180, 255, 255) for the brown signboards (in the hostel dataset).
The output generated here is an image with everything blacked out, except the signboard(s), which are retained by virtue of their colour. This filtered image is then sent for automatic zooming.
B) Automatic Zooming
Here, the image is cropped, leaving behind an output with only the signs in it. The first step is to perform Canny filtering on the image, to detect the edges of the ROIs in it. After this contour detection, binary dilation is done in the horizontal and vertical directions, and a corresponding bounding box created, that is expected to overlap with the text area. This area is then cropped out and optimally resized, while conserving the aspect ratio of the cropped area. Hence, the text area is segregated from the remaining background, making it ready for binarization and subsequent OCR conversion.
C) Binarization
This technique is useful for converting a grayscale image into a version of less wider intensity range of the image pixels. There are many segmentation techniques which are utlized for the same. After converting to grayscale, the images are then binarized using the algorithm of CBDAR_KASAR [4].
DOI: 10.4236/jsip.2019.101001 5 Journal of Signal and Information Processing Figure 2. Workflow for extracting text characters from images.
The following steps are carried out in this binarization method: 1) Canny edge detection on R, G, B channels of image
The image is first divided into its component R (red), G (green) and B (blue) channels, and Canny edge detection is applied on each of them.
2) Edge mapping of each channel
The edge images obtained will generate a total of 3 edge images—ER, EG and
EB.
3) OR all edge maps together
The edge images are logically O Red together, to form a composite edge map “E”.
R G B
E E= ∨E ∨E
4) Generation of bounding boxes
Following the generation of “E”, an 8-connected component of labelling is carried out, corresponding to which an edge-box (EB) is created. The aspect ratios of the EBs obtained are limited to a range between 0.1 and 10, in order to remove highly elongated regions. This filters out the obvious non-text areas.
These EBs will be processed further only if their sizes are more than 15 pixels as well as less than 1/5th of the dimensions of the image, excluding very large character areas.
5) Create a closed figure from the edges inside the map/box
Situations may arise where an EB has one or more EBs inside it, since both the internal and external boundaries of the characters are detected. For instance, the letter “O” is seen to give rise to two components—EBint (due to its internal boundary) and EBout (due to its external boundary).
If an EB completely encloses one or two EBs, these internal EBs may be ignored, since they correspond to the internal boundaries of the text characters. However, if the number of EBs enclosed are more than two, only the internal EBs are preserved; the external EB is ignored, as this component would not correspond to a text character.
DOI: 10.4236/jsip.2019.101001 6 Journal of Signal and Information Processing
undesirable components are filtered out:
(
)
{
}
{
}
int int out out int if 3Reject EB , Accept EB else
Reject EB , Accept EB N <
where EBint denotes the EBs completely enclosed by the current EB under consideration, and Nint is the number of EBint. These constraints help retain all the text-like elements, while removing the non-text elements. As a result, only the preserved EBs are carried forward for binarization.
6) Closed figures are coloured black, background is coloured white
For this, the foreground and background intensities of each EB is estimated. Taking the estimated foreground intensity as the threshold, each EB is binarized, assuming that each character is uniformly coloured. Inversion of each binarized output BWEB is carried out in order to colour the foreground (text) black, and the background white. This depends on whether the intensity of the foreground is higher or lower than that of the background. In other words.
( )
( )
0, , 1, , EB EB EB EB EBI x y F
B BW
I x y F
F > ⇒ = ≥
<
( )
( )
0, , 0, , EB EB EB EB EBI x y F
B BW
I x y F
F < ⇒ = ≥
<
where
FEB= local foreground intensity of EB,
BEB= local background intensity of EB,
BWEB= binarized output of EB,and
I (x, y)= intensity value at pixel (x, y)
D) OCR Analysis (using Tesseract)
For the final stage, the Tesseract OCR engine is used. This detects and extracts characters from the HSV filtered, zoomed and binarized image, and saved to a text file. Although it may be used to detect characters in multiple languages, we have restricted Tesseract to look only for characters in English, and generate a text file corresponding to the image.
4. Conclusions
Our method works well on most images in each dataset. As seen in Figure 3, most of the images in both datasets are properly filtered by their colour, and zoomed properly. The colour separation has worked on around 90% of all images, aiding in the OCR process.
DOI: 10.4236/jsip.2019.101001 7 Journal of Signal and Information Processing (a)
(b)
Figure 3. Percentage of correctly processed images from the Blue and Brown datasets, for (a) colour separation and automatic zooming, and (b) binarization with and without automatic zooming.
The CBDAR_KASAR binarization technique reduces the number of garbage characters, which are incorrectly recognized characters, since it is optimized for text detection. To gauge the effectiveness of our method, we compared the CBDAR_KASAR results of the signs without automatic zooming with the zoomed ones. Contrary to expectations, it is observed that automatic zooming does not aid the binarization method; rather, it seems to reduce its efficacy, as seen in Figure 3(b).
Despite this, there is a visible improvement in the text files generated, since ghost characters are reduced. This leads to a more accurate output file, albeit an incomplete one.
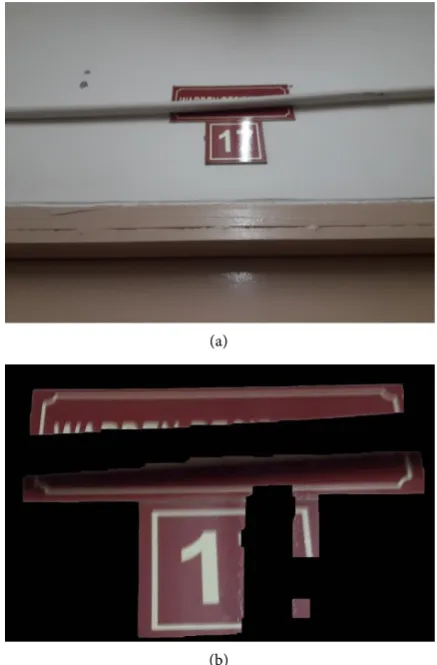
Character extraction heavily depends on the existing lighting conditions. Therefore, if the captured signage is dimly lit, the characters will not be correctly recognized, if at all any character can be discerned. Similarly, signage in close vicinity to light sources emitting a high glow may be distorted beyond readability, as seen in Figure 4.
[image:7.595.231.525.67.414.2]DOI: 10.4236/jsip.2019.101001 8 Journal of Signal and Information Processing (a)
[image:8.595.263.482.70.403.2](b)
Figure 4. (a) A hostel sign distorted by light emitted by an overhead tube light, and (b) its HSV separated and automatically zoomed image.
Moreover, low resolution images perform poorly. Only high resolution, well-focused images work properly, as text detection is heavily dependent on this.
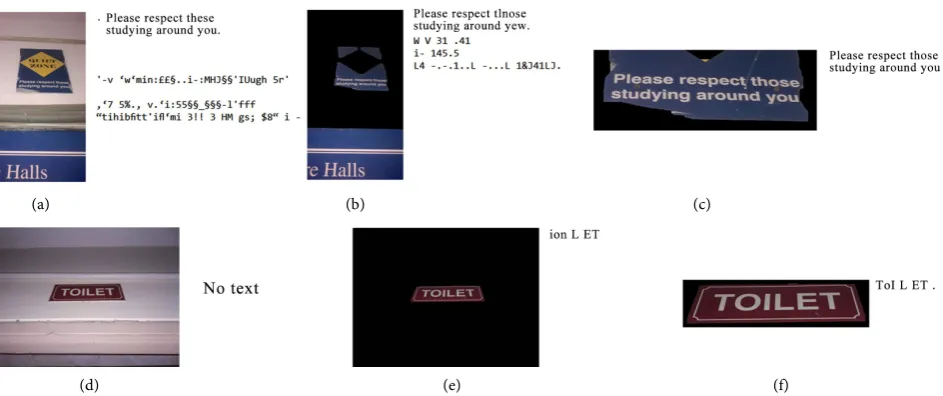
Angle variation is also a problem in capturing signage. This happens due to the sign being at a higher elevation w.r.t. the observer, causing a rectangular sign or billboard to be captured as a trapezoidal one, causing the characters to be misread, or located incorrectly, as seen in Figures 5(d)-(f).
Although our HSV separation stage is supposed to deal with this problem, it is not a perfect solution. Better algorithms need to be devised in order to completely remove perspective distortions.
DOI: 10.4236/jsip.2019.101001 9 Journal of Signal and Information Processing (a) (b) (c)
[image:9.595.65.537.68.266.2](d) (e) (f)
Figure 5. (a) and (d) Original images and corresponding OCR text , (b) and (e) HSV separated images and corresponding OCR text, and (c) and (f) Automatically zoomed images and corresponding OCR text.
(a)
(b)
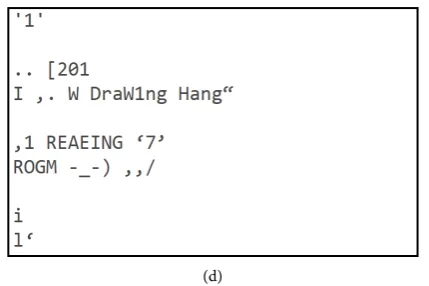
DOI: 10.4236/jsip.2019.101001 10 Journal of Signal and Information Processing (d)
Figure 6. (a) Original image of Drawing Hall and Reading Room signs, (b) its Canny filtered image, (c) its CBDAR_KASAR bina-rized image, and (d) the final text output.
5. Future Work
As illustrated in Figures 5(a)-(f), our method has been effective in removing both ghost and garbage characters, hence improving the overall efficiency. These can be suppressed by training the engine further, so that character areas of the binarized image may be identified, and noisy areas ignored.
Further, a more rigorous understanding of the lighting conditions at work is required, and variables used in the CBDAR_KASAR method must be tweaked accordingly, to improve the final output.
It seems that auto-zooming does not work very well on signs (or a group of signs) having varying text sizes. If they are not uniform, our program code tends to zoom only on a particular portion of the signage in the image. Future improvements to this might include adaptive zooming, which crops the different text areas in an image, and stitches them together.
Acknowledgements
We thank Prof. Mirza Tariq Beg, HOD of Department of Electronics and Communication Engineering, JMI, for his encouragement to pursue our research.
Conflicts of Interest
The authors declare no conflicts of interest regarding the publication of this pa-per.
References
[1] Koistinen, M., Kettunen, K. and Pääkkönen, T. (2017) Improving Optical Character Recognition of Finnish Historical Newspapers with a Combination of Fraktur& An-tiqua Models and Image Preprocessing. Proceedings of the 21st Nordic Conference on Computational Linguistics, NoDaLiDa, Gothenburg, Sweden, May 2017, 277-283.
DOI: 10.4236/jsip.2019.101001 11 Journal of Signal and Information Processing [5] Canny, J. (1986) A Computational Approach to Edge Detection. IEEE Transactions
on Pattern Analysis and Machine Intelligence, 8, 679-698. https://doi.org/10.1109/TPAMI.1986.4767851
[6] Sobel, I. and Feldman, G. (1968) A 3x3 Isotropic Gradient Operator for Image Processing. At the Stanford Artificial Intelligence Project (SAIL).
[7] Tektronix, Inc. (1991) Display-Based Color System. US Patent Number 4,985,853, January 1991.
[8] Schwarz, M.W., Cowan, W.B. and Beatty, J.C. (1987) An Experimental Comparison of RGB, YIQ, LAB, HSV, and Opponent Color Models. ACM Transactions on Graphics (TOG), 6, 123-158. https://doi.org/10.1145/31336.31338
[9] Rice, MS.V., Jenkins, F.R. and Nartker, T.A. (1995) The HP Research Protoype. The Fourth Annual Test of OCR Accuracy, Technical Report 95-03, Information Science Research Institute, University of Nevada, Las Vegas.
[10] Liu, C., Lu, X., Ji, S. and Geng, W. (2014) A Fog Level Detection Method Based on Image HSV Color Histogram. 2014 IEEE International Conference on Progress in Informatics and Computing, Shanghai, 373-377.
https://doi.org/10.1109/PIC.2014.6972360