JOURNAL OF FOREST SCIENCE, 62, 2016 (1): 24–34
doi: 10.17221/98/2015-JFS
How close to nature is close-to-nature pine silviculture?
L. Bílek, S. Vacek, Z. Vacek, J. Remeš, J. Král, D. Bulušek, J. Gallo
Faculty of Forestry and Wood Sciences, Czech University of Life Sciences Prague, Prague, Czech RepublicABSTRACT:Structural parameters of Scots pine stands (129–191 years) on their natural sites (270–600 m a.s.l.) are described on 6 permanent research plots (PRP; 3 in managed stands using near-natural silvicultural practices and 3 in stands without active forest management for 3 decades at least) in areas of western, central and eastern Bohemia and in the Polish part of the Krkonoše Mts. In the framework of the study structural and growth parameters, horizontal and vertical structure and biodiversity were evaluated on the plots. A comparison of the plots, and of managed and unmanaged plots showed a rela-tively high variability in different parameters. Nevertheless, the results document that managed stands, compared to forest stands without management, mostly have significantly higher standing volumes (1.5 times in total and 1.7 times in pine), which is caused by more extreme sites. An opposite trend was found out in dead wood volume, which is distinctly higher in unmanaged stands. Differences in the other parameters are not so pronounced, probably because small-scale management is used and because a relatively short time since the stands were left to spontaneous development has elapsed (30–52 years).
Keywords: stand structure; Scots pine; natural pinewoods; managed forests; unmanaged forests
Differences in the structure of woody plant popula-tions may be caused by a number of factors like dis-tinctions in stand conditions (age, area, competitive position, growth rate, genetic properties) and site conditions (soil and climate) (Weiner 1985). They may also result from the heterogeneity of other envi-ronmental factors, effects of herbivores or pathogens and occurrence of various disturbances (Oliver, Larson 1990; Weiner 1990; Ambrož et al. 2015). Accordingly, it is possible to quantify the stand struc-ture by a number of attributes including tree density, vertical distribution of crowns, canopy closure, basal area, horizontal distribution of trees, dead wood vol-ume or inclusion of individuals in the respective tree classes (Silver et al. 2013). Differences in structure often reflect the course of disturbances in the past, similarly like particular properties of woody plant species (Vanderwel et al. 2006; D’Amato et al. 2008) while the method and objective of their man-agement are of crucial importance (Kaufmann et al. 2000; Crow et al. 2002; Rouvinen, Kuuluvainen 2005; Bílek et al. 2011; Vacek et al. 2014).
In commercial forests ecological management is generally considered as a tool of homogenization of their stand structure (Uotila et al. 2001, 2002). In this context, a number of studies have been pub-lished (Stephenson 1999; Spies 2004) in which, for fear of biodiversity decrease in commercial forests, such management strategies were investigated that would lead to a reduction of differences between commercial forests and natural or near-natural for-ests, whereas these strategies should ensure higher structural differentiation of commercial forests at the same time (Silver et al. 2013).
For an expansion of silvicultural practices that are inspired by natural variability of forests it is neces-sary to know structural parameters of particular tree species in near-natural forests (Burrascano et al. 2011). Attention has been focused mainly on climax tree species while rather limited attention has been paid to Scots pine. Exceptions are only pine stands in boreal and Mediterranean areas (cf. Rouvinen, Kuuluvainen 2005; Montes et al. 2005, 2008). The objective of the present paper was
to evaluate the structure of managed (PRP 1–3) and unmanaged (PRP 4–6) stands with natural dominance of Scots pine in the conditions of Cen-tral Europe. The selection of plots was done delib-erately so that it would characterize small-scale silvicultural practices that are rather exceptional in the pine as a light-demanding tree species. The ba-sic hypothesis was that the stands managed in this way have a similar structural variability like stands without active forest management.
MATERIAL AND METHODS
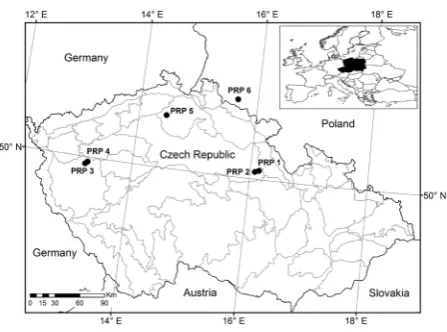
Description of the study sites. The study was con-ducted at sites with the natural occurrence of Scots pine (Pinus sylvestris L.) on six permanent research plots (PRP; 3 managed stands and 3 unmanaged stand for 3 decades at least) in the area of western, central and eastern Bohemia and in the Polish part of the Krkonoše Mts. (Karkonosze). PRPs were mostly 50 × 50 m in size (0.25 ha) but PRP 1 was 25 × 50 m (0.125 ha) and PRP 6 was 40 × 60 m (0.24 ha). The main characteristics of managed stands are use of natural regeneration under the shelter of parent stand, long regeneration and rotation period, free felling policy with the objective to create complex forest structure and rejection of large and abrupt cover release. Cut-ting frequency is from 5 to 10 years. Measurements were performed in 2014 and 2015 before planned cut-tings. Fig. 1 shows the localization of PRPs and Table 1 documents the basic data on PRP.
Data collection. To determine the tree layer struc-ture of woody plants of forest ecosystems the Field-Map technology (IFER-Monitoring and Field-Mapping Solutions Ltd., Strašice, Czech Republic) was used. During particular measurements the position of all
tree layer individuals of breast height diameter above 8 cm was localized. Tree heights, heights of the live crown base and crown perimeter were measured, at least at 4 directions perpendicular to each other. Breast height diameters were measured with a metal calliper to the nearest 1 mm. Heights and heights of the live crown base were recorded with a laser Vertex hypsometer to the nearest 0.1 m.
Data analysis. In all individuals of the tree layer structural and growth parameters, quantity and quality of production, horizontal and vertical struc-ture and biodiversity were evaluated on particular plots. Tree volume was calculated using the volume equations published by Petráš and Pajtík (1991).
[image:2.595.307.531.54.220.2]To determine the spatial distribution Hopkins-Skellam index (Hopkins, Hopkins-Skellam 1954), Pielou-Mountford index (Pielou 1959; Pielou-Mountford 1961), Clark-Evans index (Clark, Evans 1954) and Ripley’s L-function (Ripley 1981) were com-puted. The David-Moore index (David, Moore 1954) was used as a distribution index based on tree frequency in the particular quadrats. The size of
Table 1. An overview of basic characteristics of forest stands included in the study (stand structural data from forest management plans)
Stand
ID Plot name Coordinates (WGS84) Age (yr) Height (m) DBH (cm) (mVolume 3 ·ha–1) Altitude (m) Expo-sure gradient (Slope o) site type*Forest
1 Chvojno 1Vysoké 50.0551672N16.1497353E 132 23 33 278 270 – 0 2I7
2 Chvojno 2Vysoké 50.0886833N16.0471461E 129 25 32 357 300 – 0 2M2
3 Plasy manag. 49.9055694N13.2062422E 145 20 32 162 600 E 5 0Q5
4 non-manag.Plasy 49.9099036N13.1998936E 142 17 27 211 590 – 0 0Q5
5 Kostelecké bory 50.5697825N14.4599611E 190 14 25 180 430 SW 4 0Z3
6 Chojník bory 50.8374794N15.6412489E 191 19 42 179 470 NE 22 0Z0
[image:2.595.65.533.576.739.2]*according to Viewegh et al. (2003)
quadrats on PRP was 10 × 10 m. The PointPro 2.1 (Zahradník, Puš, Prague, Czech Republic) was used to calculate these characteristics describing the hori-zontal structure of individuals across the plot. The test of significance of the deviations from the values expected for random distribution of points was done using Monte Carlo simulations. The mean values of L -function were estimated as arithmetical means from L-functions calculated for 1999 randomly generated point structures. The respective expected values of these indices were computed by means of numeri-cal simulations for each particular case separately. In results statistically significant values (exceeding the confidence interval) are designated by asterisk. Struc-tural characteristics were computed using the Sibyla growth simulator (Fabrika, Ďurský 2005).
In graphical outputs the black line represents the L-function for actual distances of individuals on PRP, the thick blue line shows the mean curve of random spatial distribution of trees and two thinner central curves document the 95% reliability interval. When the black line of tree distribution on PRP is below this interval, it indicates the tendency of regular distri-bution of individuals, and if it is above this interval, it shows the tendency of aggregated spatial pattern. Stand density, biological canopy (the sum of all crown projection areas/total area of PRP) and mensurational canopy (the horizontal area covered by crowns/total area of PRP) were derived during the study of hori-zontal structure on PRP. Situational maps were cre-ated in the ArcGIS (ESRI, Redmont, USA).
In the framework of biodiversity evaluation these indices were computed: diameter differentiation in-dex (TMd), height differentiation index (TMh, val-ues of indices 0–1) (Füldner 1995), species diver-sity index (Shannon 1948), species evenness index (Pielou 1975), Arten-profil index (A, values of in-dices 0–1) (Pretsch 2006) and total diversity index (B < 4 – monotonous structure and B ≥ 9 – highly structured stands) (Jaehne, Dohrenbusch 1997). Index D (Mi) and index G (Gi) (Gini 1921; Sterba 2008) were also calculated.
Unconstrained principal component analysis (PCA) in Canoco for Windows 4.5 (ter Braak, Šmilauer 2002) was used to analyse the relationships between volumes of living trees, mean diameter at breast height, mean height, living tree density, crown pro-jection area, and structural diversity indices in order to reveal similarity of all records. Data were log-trans-formed, centred and standardized before the analy-sis. The results of the PCA analysis were visualized in the form of an ordination diagram constructed by CanoDraw.
RESULTS
Tree layer structure
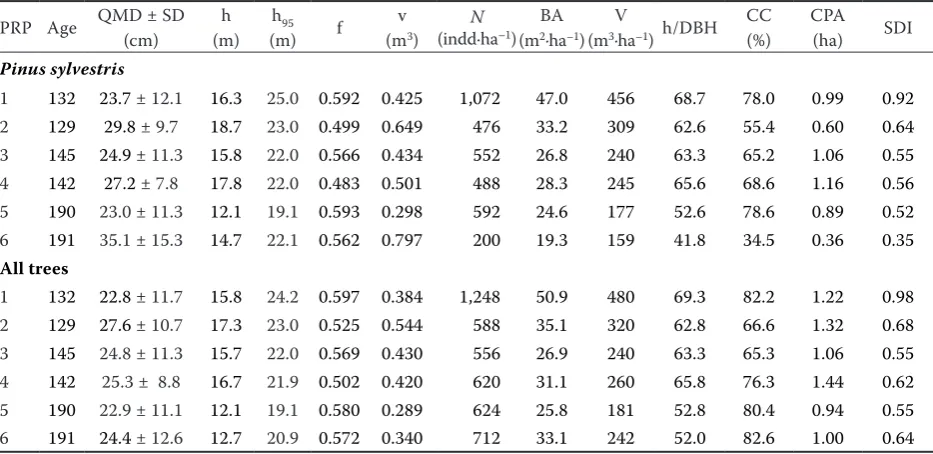
[image:3.595.64.531.486.713.2]Table 2 shows the basic stand characteristics. The numbers of living trees (DBH ≥ 8 cm) in the tree layer are between 556 and 1,248 trees·ha–1
Table 2. An overview of basic stand characteristics of tree layer on PRPs
PRP Age QMD ± SD (cm)
h (m)
h95 (m) f
v
(m3) (indd·haN –1)(m2BA ·ha–1)
V
(m3·ha–1) h/DBH
CC (%)
CPA (ha) SDI
Pinus sylvestris
1 132 23.7 ± 12.1 16.3 25.0 0.592 0.425 1,072 47.0 456 68.7 78.0 0.99 0.92
2 129 29.8 ± 9.7 18.7 23.0 0.499 0.649 476 33.2 309 62.6 55.4 0.60 0.64
3 145 24.9 ± 11.3 15.8 22.0 0.566 0.434 552 26.8 240 63.3 65.2 1.06 0.55
4 142 27.2 ± 7.8 17.8 22.0 0.483 0.501 488 28.3 245 65.6 68.6 1.16 0.56
5 190 23.0 ± 11.3 12.1 19.1 0.593 0.298 592 24.6 177 52.6 78.6 0.89 0.52
6 191 35.1 ± 15.3 14.7 22.1 0.562 0.797 200 19.3 159 41.8 34.5 0.36 0.35 All trees
1 132 22.8 ± 11.7 15.8 24.2 0.597 0.384 1,248 50.9 480 69.3 82.2 1.22 0.98
2 129 27.6 ± 10.7 17.3 23.0 0.525 0.544 588 35.1 320 62.8 66.6 1.32 0.68
3 145 24.8 ± 11.3 15.7 22.0 0.569 0.430 556 26.9 240 63.3 65.3 1.06 0.55
4 142 25.3 ± 8.8 16.7 21.9 0.502 0.420 620 31.1 260 65.8 76.3 1.44 0.62
5 190 22.9 ± 11.1 12.1 19.1 0.580 0.289 624 25.8 181 52.8 80.4 0.94 0.55
6 191 24.4 ± 12.6 12.7 20.9 0.572 0.340 712 33.1 242 52.0 82.6 1.00 0.64
(e) (f)
(c) (d)
(a) (b)
and in Scots pine they are between 200 and 1,072 trees·ha–1. The relative stand density (SDI) is
consistent with these numbers, which is between
[image:4.595.51.503.52.697.2]0.55 and 0.98 in the tree layer and in pine it is be-tween 0.35 and 0.92. The average basal area is very different in the particular PRPs due to their site
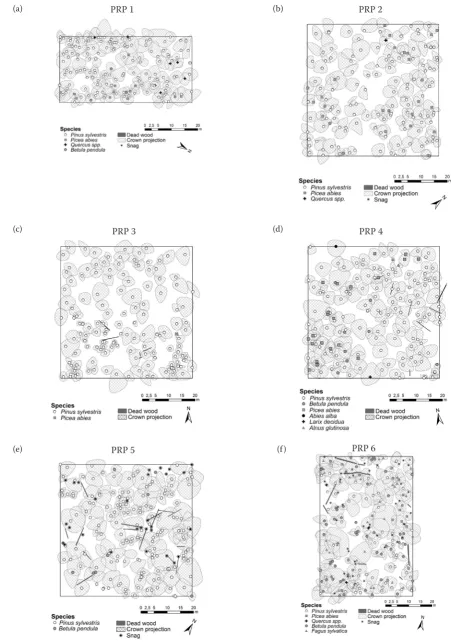
Fig. 2. Horizontal structure of natural pinewood stands on PRP 1–6
PRP 1 PRP 2
PRP 3 PRP 4
conditions and in all tree woody species it ranges from 25.8 to 50.9 m2·ha–1 and in pine it is 19.3 to
47.0 m2·ha–1. There are also great differences in
stand-ing volumes on the particular plots. As for all woody plants on PRPs they range from 181 to 480 m3·ha–1
and in pine this range is from 159 to 456 m3·ha–1.
Compared to managed forests, standing volumes in unmanaged forest stands are mostly considerably lower (1.5 times in total and 1.7 times in pine).
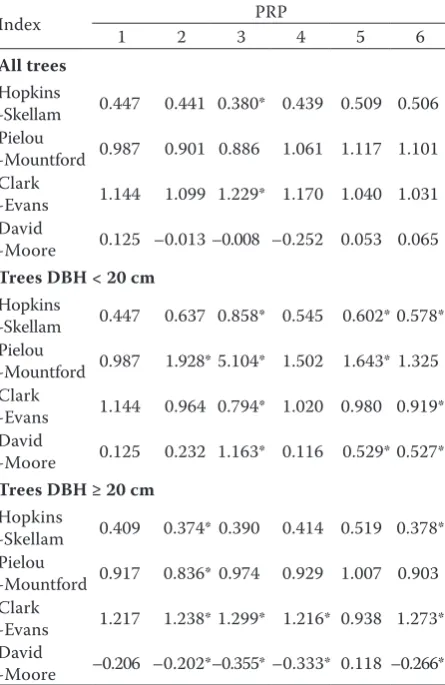
[image:5.595.304.504.48.727.2]Fig. 2. illustrates the layout of the horizontal structure of tree layer on PRPs 1–6, where fallen stems are also seen when their amount is marked-ly higher in unmanaged forests. Table 3 shows the horizontal structure of tree layer by means of tural indices. According to the computed struc-tural indices, regular distribution is dominant in all individuals of the tree layer in managed stands (PRPs 1–3). Only the David-Moore index shows ag-gregated distribution on PRP 1 and random one on PRP 3. According to the studied indices the aggre-gated distribution of individuals with breast height diameter within 20 cm is dominant on these plots, only on PRP 1 the distribution is regular according
Table 3. Indices describing the horizontal structure of tree layer on PRPs
Index 1 2 3 PRP 4 5 6
All trees
Hopkins
-Skellam 0.447 0.441 0.380* 0.439 0.509 0.506 Pielou
-Mountford 0.987 0.901 0.886 1.061 1.117 1.101 Clark
-Evans 1.144 1.099 1.229* 1.170 1.040 1.031 David
-Moore 0.125 –0.013 –0.008 –0.252 0.053 0.065
Trees DBH < 20 cm
Hopkins
-Skellam 0.447 0.637 0.858* 0.545 0.602* 0.578* Pielou
-Mountford 0.987 1.928* 5.104* 1.502 1.643* 1.325 Clark
-Evans 1.144 0.964 0.794* 1.020 0.980 0.919* David
-Moore 0.125 0.232 1.163* 0.116 0.529* 0.527*
Trees DBH ≥ 20 cm
Hopkins
-Skellam 0.409 0.374* 0.390 0.414 0.519 0.378* Pielou
-Mountford 0.917 0.836* 0.974 0.929 1.007 0.903 Clark
-Evans 1.217 1.238* 1.299* 1.216* 0.938 1.273* David
-Moore –0.206 –0.202*–0.355* –0.333* 0.118 –0.266*
*statistically significant at α = 0.05
PRP 1 PRP 2 PRP 3 PRP 4 PRP 5 PRP 6
Fig. 3. Horizontal structure of tree layer on PRP expressed by the L-function, explanatory notes in Data analysis
(a) (b) (c) (d) (e) (f) 10 9 8 7 6 5 4 3 2 1 0 L (r) 10 9 8 7 6 5 4 3 2 1 0 L (r) 10 9 8 7 6 5 4 3 2 1 0 L (r) 10 9 8 7 6 5 4 3 2 1 0 L (r) 10 9 8 7 6 5 4 3 2 1 0 L (r) 10 9 8 7 6 5 4 3 2 1 0 L (r)
[image:5.595.65.288.88.431.2]to all indices with the exception of David-Moore in-dex. In individuals with breast height diameter larg-er than 20 cm the distribution is regular in all cases.
In unmanaged stands (PRPs 4–6) the aggregated distribution of trees across the plots generally pre-vails in all individuals of tree layer. The evaluation by Clark-Evans index is an exception on all plots because the distribution is regular, similarly like on PRP 1 by Hopkins-Skellam index and David Moore index. In individuals with breast height diameter within 20 cm aggregated distribution is dominant on these plots ac-cording to the studied indices, only on PRP 4 the dis-tribution is regular according to Clark-Evans index. In individuals from 20 cm of breast height diameter the distribution is regular on PRP 4 and 6 and mostly ag-gregated on PRP 5, only according to Pielou-Mount-ford index the distribution is random.
The horizontal structure of woody plants of tree layer on PRPs 1–6 is mostly random according to the L-function (Fig. 3). Only on PRP 1 it is regular within 1.8 m, on PRP 2 it is regular in the range of 1–2.5 m and on PRP 3 between 1.5 and 3.5 m. PRP 3 is also an exception where trees with the spacing of 4–6 m show a tendency of moderate aggregation.
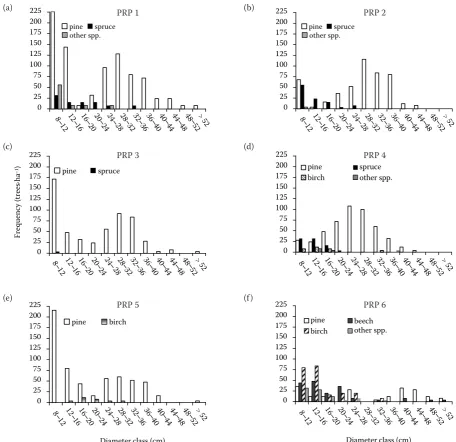
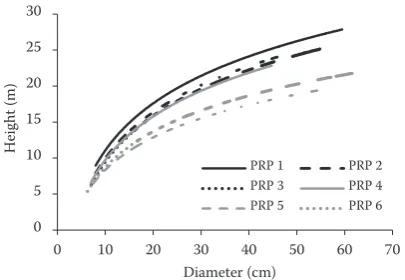
Figs 4 and 5 illustrate diameter frequencies of tree layer and the relation of breast height diameter to tree height on PRP. The distribution of diameter classes indicates differences between particular PRP, especially with regard to their regeneration potential, which is very pronounced on PRPs 1, 3 and 5 as a result of the high representation of in-dividuals in the first two diameter classes, which causes an atypical distribution of diameter classes for pine stands. The succession of the
growing-0 25 50 75 100 125 150 175 200 225
Fr
eq
ue
nc
y
(tr
ee
s·ha
)
pine spruce other spp.
0 25 50 75 100 125 150 175 200 225
pine spruce other spp.
0 25 50 75 100 125 150 175 200 225
pine spruce
0 25 50 75 100 125 150 175 200 225
pine spruce
birch other spp.
0 25 50 75 100 125 150 175 200 225
Diameter class (cm)
pine birch
0 25 50 75 100 125 150 175 200 225
Diameter class (cm)
pine beech
birch other spp.
– – – – – – – – – – – – – – – – – – – – – –
– – – – – – – – – – – – – – – – – – – – – –
– – – – – – – – – – – – – – – – – – – – – –
[image:6.595.61.518.53.495.2]–1
Fig. 4. Histogram of diameter classes on PRP differentiated by main tree species
(a) (b)
(c) (d)
(e) (f)
PRP 1 PRP 2
PRP 3 PRP 4
up stage individuals is evident on PRPs 2, 4 and 6. There is a specific situation on PRP 6, where the mortality of the youngest individuals is very high due to very extreme site conditions of relict pine-woods. Unlike the other PRPs, regeneration on this plot is not cyclical while it is more or less continu-ous but very sporadic.
The relation of breast height diameter and tree height on PRP suggests differences between stands on natural pinewood sites (PRPs 1–4) and in relict pine-woods (PRPs 5 and 6).
Tree layer biodiversity
Table 4 documents the indices describing tree layer diversity on PRPs 1–6. Species richness of the tree layer evaluated by D(Mi) index is low on PRP 3 and 5, intermediate on PRP 1 and 2, high on PRP 6 and very high on PRP 4. Species diversity of the tree layer according to entropy H´(Si) is minimum on PRP 3, low on PRPs 1, 2, 4 and 5 and interme-diate on PRP 6. Species evenness of the tree layer
according to E (Pii) index is minimum on PRP 3, low on PRPs 1, 2, 4 and 5 and high on PRP 6. Verti-cal structure is relatively variable as it is moderately differentiated on PRPs 1–4, strongly differentiated on PRP 5 and very strongly differentiated on PRP 6. According to the diameter differentiation index TMd(Fi) differentiation is small on PRP 3 and mod-erate on the other plots; according to the height dif-ferentiation index TMh(Fi) small differentiation is on PRPs 2–6 and moderate differentiation on PRP 1. With regard to complex diversity B (J&Di) even structure is on PRP 3, uneven structure is on PRPs 1, 2, 4 and 5 and differentiated structure on PRP 6. High values of index G (Gi) typical of stands with the negatively exponential distribution of diameter classes were found out on PRPs 1, 3, 5 and 6 and lower values typical of stands with normal distribu-tion were observed on PRP 2 and 4.
Result of PCA analysis
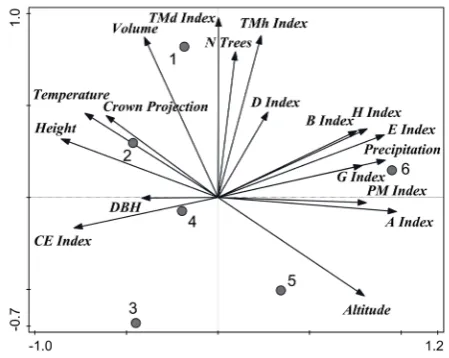
The first ordination axis explained 47.2% of data variability, the first two axes in total explained 72.8% and the first four axes in total explained 95.4% of data variability (Fig. 6). The first y-axis represented number of trees and stand volume by diameter differentiation index and height differen-tiation index. The second x-axis represented DBH and precipitation by Arten-profil index, both ag-gregation indices and Gini index. Mean height of trees was positively correlated with temperature, crown projection and DBH, while these parameters were negatively correlated with altitude. Number of trees was positively correlated with diameter dif-ferentiation index, height difdif-ferentiation index and species richness index. Stand volume was negative-ly correlated with altitude. Precipitation, species evenness index, species diversity index, Gini index, Pielou-Mountford aggregation index and total di-versity index were positively correlated with one another, while these parameters were negatively correlated with DBHand Clark-Evans aggregation index. Diameter (DBH) andspecies richness index were of relatively small importance to explain the data variability. PRPs were very different from one another, but managed plots occupied the left up-per part of the diagram typical of higher stand vol-ume, while higher aggregation and partially higher structural diversity (vertical and tree species) were characteristic of unmanaged stands. On the other hand, some structural characteristics of the studied managed plots are very similar to those of stands without active management.
0 5 10 15 20 25 30
0 10 20 30 40 50 60 70
H
eig
ht
(m)
Diameter (cm)
[image:7.595.75.278.55.195.2]PRP 1 PRP 2 PRP 3 PRP 4 PRP 5 PRP 6
[image:7.595.64.290.578.700.2]Fig. 5. The relationship between breast height diameter and tree height on PRP 1–6
Table 4. Indices describing the diversity of tree layer on PRPs
PRP (MiD ) (H´Si) (PiiE) (PriA) TMd
(Fi) TM(Fi)h (J&BDi) (GiG ) 1 0.421 0.142 0.236 0.400 0.432 0.337 6.403 0.560 2 0.314 0.091 0.191 0.389 0.387 0.298 6.481 0.390 3 0.158 0.005 0.017 0.386 0.275 0.208 5.576 0.474 4 0.778 0.184 0.236 0.375 0.324 0.225 7.121 0.372 5 0.155 0.081 0.272 0.578 0.314 0.259 6.348 0.526 6 0.609 0.481 0.688 0.756 0.355 0.294 8.241 0.662
D – index of species richness, H´ – index of species het-erogeneity, E – index of species evenness, A – Arten-profil index, TMd – diameter differentiation index, TMh – height
DISCUSSION
Our study was focused on a comparison of pine stands without active forest management and in-tensively managed stands using near-natural silvi-cultural practices. Related to this topic, more infor-mation is available from the area of southern and northern Europe (Angelstam, Kuuluvainen 2004; Montes et al. 2005; Poyatos et al. 2013; Martín-Alcón et al. 2015), but in conditions of central Europe researchers paid attention mainly to stands being composed of shade-tolerant species such as spruce, beech and fir.
Our study did not reveal any larger differences in the density of commercial stands and stands with-out management. This trend is also evident from a comparison of diameter frequencies in particular diameter classes when there are no distinct dif-ferences between managed and unmanaged plots. Nevertheless, the distribution of breast height
di-ameters in the stand is similar like in other papers where unimodal, multimodal, decreasing or irregu-lar distribution is usually reported (Maltamo et al. 2000). It is to note that the unimodal distribution of breast height diameters occurs e.g. after the total bark beetle disturbance of parent stand with rela-tively fast natural regeneration, while after a small-er disturbance a part of trees remains in the stand, which increases its structural variability (Frank-lin et al. 2002). In this case, in relation to subse-quent diversification of regeneration, multimodal, decreasing or irregular distribution of breast height diameters occurs (Lampainen et al. 2004).
Based on the evaluation of results describing the horizontal structure of tree layer it is to state that a regular distribution of trees is dominant in general in the studied managed forests while un-managed stands show an aggregated tree distribu-tion. In both variants of management trees with DBH ≤ 20 cm tend to aggregation. Such a trend was also documented by Larson et al. (2012) or Lydersen et al. (2013). Tuten et al. (2015) also found out a high degree of aggregated distribution of trees in a pine stand, especially within a distance of 10 m. Sánchez et al. (2011) documented statis-tically significant aggregated distribution to a dis-tance smaller than 40 m with the peak of aggrega-tion at a distance of 6–8 m. In studied Scots pine stands aggregated structures of younger trees may indicate inclination to gap regeneration dynamics related to autogenic disturbances (mortality and self-thinning) or cohort dynamics related to partial disturbances (Angelstam, Kuuluvainen 2004). In natural pine stands partial and low-intensity dis-turbances are mainly caused by fire or windthrow. In managed forests these disturbance regimes are replaced by final harvest, which creates the oppor-tunity for establishment of new tree cohorts. The size and texture then depend on the spatial pattern and intensity of silvicultural treatment. In general, for the regeneration of light-demanding tree spe-cies more intense treatment is required.
Biodiversity plays a crucial role in all ecosystem components (Mace et al. 2012), and in recent decades efforts aimed at its increase or mainte-nance have become a new objective of forest man-agers (Millar et al. 2007; Bauhus et al. 2009; Fraver, Palik 2012). An important influence of stand structure on the formation of ecosystem pro-cesses and biological diversity was well document-ed by Spies (1998).
[image:8.595.65.290.59.238.2]The evaluation of tree layer biodiversity on the basis of selected structural indices shows relatively distinct differences within the studied plots. These
Fig. 6. Ordination diagram showing the results of PCA analysis of relationships between living tree characteristics (N trees, DBH, Height, Volume and Canopy), stand param-eters (Altitude, Temperature, Precipitation) and structural indices (D index, E index, H index, CE index, PM index, A index, TMd index, TMh index, G index, B index)
N trees – number of living trees per hectare, DBH – quad-ratic diameter at breast height, Height – mean height,
Volume and Canopy – crown projection area, D index – species richness index, E index – species evenness index,
H index – species diversity index, CE index – Clark-Evans aggregationindex, PM index – Pielou-Mountford index of non-randomness, A index – Arten-profil index, TMd in-dex – diameter differentiation index, TMh index – height differentiation index, G index – Gini index, B index – total diversity index; codes indicate each record of data; code abbreviations: number – identification of permanent
results are generally consistent with Gao et al. (2014), who demonstrated that mature stands with multilayer structure usually have higher species diversity, especially in mixed conifer-broadleaved forests with disturbed canopy. Barbier et al. (2008) or Chávez and MacDonald (2012) considered combined effects of several factors such as age, can-opy density and species composition to be determi-nant for species diversity. According to Smith et al. (2008) and Coote et al. (2013) a change in species composition is closely related to differences in light conditions, developmental stages and tree species composition of the stand. Last but not least, stand biodiversity is significantly influenced by forest management (Zobel et al. 1993). Lust et al. (1998) stated that in old pine stands some tree species may grow as spontaneous intermediate trees which sub-sequently contribute to more complex structure and higher biological diversity. Similar results were published by MacLachlan et al. (2000) or Liira et al. (2007), who described lower heterogeneity, density or lower complexity of structural attributes from stands with strong anthropogenic impacts. In some cases, development and especially the spon-taneous growth of intermediate trees of autoch-thonous species in pine stands may be disturbed by undesirable expansion of allochthonous species (Maddelein et al. 1990).
Peterken (1981) specified measures that help increase the total diversity of forest ecosystems. They involve a long conversion period, longer rota-tion period, use of autochthonous species, support of natural regeneration or specific measures for the protection of heterogeneous microsites. Linden-mayer and Franklin (2002) considered a longer rotation period as an especially important principle because it subsequently allows the higher complex-ity of structural parameters and larger similarcomplex-ity to natural forests (Silver et al. 2013).
CONCLUSIONS
Where required, close-to-nature silviculture is a viable model for creating more complex forest structure in stands naturally dominated by Scots pine. The use of natural regeneration under the shelter of parent stand, longer regeneration and ro-tation period than usual, and rejection of large and abrupt cover release have led to forest structures that are relatively similar to stands without active forest management for 30–52 years. Nevertheless, for the continuous viable regeneration of managed pine stands, constantly lower canopy density is a
necessity. For a better understanding of the growth and productivity of such stands, a longer research period is needed.
References
Ambrož R., Vacek S., Vacek Z., Král J., Štefančík I. (2015): Structure, growth parameters and regeneration in rela-tion to model development of beech forests with different game management in the Lány Game Enclosure. Lesnícký časopis – Forestry Journal, 61: 78–88.
Angelstam P., Kuuluvainen T. (2004): Boreal forest distur-bance regimes, successional dynamics and landscape structures – a European perspective. Ecological Bulletins, 51: 117–136.
Barbier S., Gosselin F., Balandier P. (2008): Influence of tree species on understory vegetation diversity and mechanisms involved – a critical review for temperate and boreal for-ests. Forest Ecology and Management, 254: 1–15. Bauhus J., Puettmann K., Messier C. (2009): Silviculture for
old-growth attributes. Forest Ecology and Management, 258: 525–537.
Bílek L., Remeš J., Zahradník D. (2011): Managed vs. unman-aged. Structure of beech forest stands (Fagus sylvatica L.) after 50 years of development, Central Bohemia. Forest Systems, 20: 122–138.
Burrascano S., Sabatini F.M., Blasi C. (2011): Testing indica-tors of sustainable forest management on understorey composition and diversity in southern Italy through vari-ation partitioning. Plant Ecology, 212: 829–841.
Clark P.J., Evans F.C. (1954): Distance to nearest neighbour as a measure of spatial relationship in populations. Ecol-ogy, 35: 445–453.
Coote L., Dietzsch A.C., Wilson M.W., Graham C.T., Fuller L., Walsh A.T., Irwin S., Kelly D.L., Mitchell F.J.G., Kelly T.C., O’Halloran J. (2013): Testing indicators of biodiversity for plantation forests. Ecological Indicators, 32: 107–115. Crow T.R., Buckley D.S., Nauertz, E.A., Zasada, J.C. (2002):
Effects of management on the composition and structure of northern hardwood forests in Upper Michigan. Forest Science, 48: 129–145.
D’Amato A.W., Orwig D.A., Foster D.R. (2008): The influence of successional processes and disturbance on the structure of Tsuga canadensis forests. Ecological Applications, 18: 1182–1199.
David F.N., Moore P.G. (1954): Notes on contagious distribu-tions in plant populadistribu-tions. Annals of Botany, 18: 47–53.
Fabrika M., Ďurský J. (2005): Stromové růstové simulátory. Zvolen, EFRA: 112.
structural implications, using Douglas-fir forests as an example. Forest Ecology and Management, 155: 399–423. Fraver S., Palik B.J. (2012): Stand and cohort structures of old-growth Pinusresinosa-dominated forests of northern Min-nesota, USA. Journal of Vegetation Science, 23: 249–259. Fuller R.J., Gill R.M.A. (2001): Ecological impacts of increas-ing numbers of deer in British woodland. Forestry, 74: 193–199.
Gao T., Hedblom M., Emilsson T., Nielsen A.B. (2014): The role of forest stand structure as biodiversity indicator. For-est Ecology and Management, 330: 82–93.
Gini C. (1921): Measurement of inequality on income. The Economic Journal, 31: 22–43.
Hopkins B., Skellam J.G. (1954): A new method for determin-ing the type of distribution of plant individuals. Annals of Botany, 18: 213–227.
Chávez V., MacDonald S.E. (2012): Partitioning vascular understory diversity in mixed wood boreal forests: the importance of mixed canopies for diversity conservation. Forest Ecology and Management, 271: 19–26.
Jaehne S.C., Dohrenbusch A. (1997): Ein Verfahren zur Be-urteilung der Bestandesdiversität. Forstwissenschaftliches Centralblatt, 116: 333–345.
Kaufmann M.R., Regan C.M., Brown P.M. (2000): Het-erogeneity in ponderosa pine/Douglas-fir forests: age and size structure in unlogged and logged landscapes of central Colorado. Canadian Journal of Forest Research, 30: 698–711.
Lampainen J., Kuuluvainen T., Wallenius T.H., Karjalainen L., Vanha-Majamaa I. (2004): Long-term forest structure and regeneration after wild fire in Russian Karelia. Journal of Vegetation Science, 15: 245–256.
Larson A.J., Keyes C.R., Stover K.C. (2012): Effects of resto-ration thinning on spatial heterogeneity in mixed-conifer forest. Canadian Journal of Forest Research, 42: 1505–1517. Liira J., Sepp T., Parrest O. (2007): The forest structure and
ecosystem quality in conditions of anthropogenic distur-bance along productivity gradient. Forest Ecology and Management, 250: 34–46.
Lust N., Muys B., Nachtergale L. (1998): Increase of biodiver-sity in homogeneous Scots pine stands by an ecologically diversified management. Biodiversity and Conservation, 7: 249–260.
Lydersen J.M., North M.P., Knapp E.E., Collins B.M. (2013): Quantifying spatial patterns of tree groups and gaps in mixed-conifer forests: reference conditions and long-term changes following fire suppression and logging. Forest Ecology and Management, 304: 340–382.
Mace G.M., Norris K., Fitter A.H. (2012): Biodiversity and ecosystem services: a multilayered relationship. Trends in Ecology & Evolution, 27: 19–26.
Maddelein D., Lust N., Meyen S., Muys B. (1990): Dynamics in maturing Scots pine monocultures in North-East Belgium. Silva Gandavensis, 55: 69–80.
Maltamo M., Kangas A., Uuttera J., Torniainen T., Saramäki J. (2000): Comparison of percentile based prediction meth-ods and the Weibull distribution in describing the diameter distribution of heterogeneous Scots pine stands. Forest Ecology and Management, 133: 263–274.
Maltamo M., Kangas A., Uuttera J., Torniainen T., Saramäki J. (2000): Comparison of percentile based prediction meth-ods and the Weibull distribution in describing the diameter distribution of heterogeneous Scots pine stands. Forest Ecology and Management, 133: 263–274.
Martín-Alcón S., Coll L., Salekin S. (2015): Stand-level driv-ers of tree-species divdriv-ersification in Mediterranean pine forests after abandonment of traditional practices. Forest Ecology and Management, 353: 107–117.
McLachlan J.S., Foster D.R., Menalled F. (2000): Anthropo-genic ties to latesuccessional structure and composition in four New England hemlock stands. Ecology, 81: 717–733. Millar C.I., Stephenson N.L., Stephens S.L. (2007): Climate
change and forests of the future: managing in the face of uncertainty. Ecological Applications, 17: 2145–2151. Montes F., Rubio A., Barbeito I., Cañellas I. (2008):
Charac-terization of the spatial structure of the canopy in Pinus silvestris L. stands in central Spain from hemispherical photographs. Forest Ecology and Management, 255: 580–590.
Montes F., Sanchez M., del Rio M., Canellas I. (2005): Using historic management records to characterize the effects of management on the structural diversity of forests. Forest Ecology and Management, 207: 279–293.
Mountford M.D. (1961): On E. C. Pielou’s index of non ran-domness. Journal of Ecology, 49: 271–275.
Näslund M. (1936): Skogsförsöksanstaltens gallringsförsök i tallskog. Meddelanden från Statens Skogsförsöksanstalt, Swedish Institute of Experimental Forestry, 29: 169. Oliver C.D., Larson B.C. (1990): Forest Stand Dynamics. New
York, McGraw-Hill: 544.
Peterken G.F. (1981): Wooland Conservation and Manage-ment. London: Chapman & Hall: 328.
Petráš R., Pajtík J. (1991): Sústava Česko-slovenských obje-mových tabuliek drevín. Lesnícky časopis: 7, 49–56. Pielou E.C. (1959): The use of point-to-plant distances in
the study of the pattern of plant populations. Journal of Ecology, 47: 607–613.
Pielou E.C. (1975): Ecological Diversity. New York, Wiley: 165.
Poyatos R., Latron J., Llorens P. (2003): Land use and land cover change after agricultural abandonment – the case of a Mediterranean Mountain Area (Catalan Pre-Pyrenees). Mountain Research and Development, 23: 362–368. Pretzsch H. (2006). Wissen nutzbar machen für das
Manage-ment von Waldökosystemen. Allgemeine Forstzeitschrift/ Der Wald, 61: 1158–1159.
Rouvinen S., Kuuluvainen T. (2005): Tree diameter distribu-tions in natural and managed old Pinus sylvestris -domi-nated forests. Forest Ecology and Management, 208: 45–61. Sánchez Meador A.J., Parysow P.F., Moore M.M. (2011): A new method for delineating tree patches and assessing spatial reference conditions of ponderosa pine forests in northern Arizona. Restoration Ecology, 19: 490–499. Shannon C.E. (1948): A mathematical theory of
communica-tions. Bell System Technical Journal, 27: 379–423. Silver E.J, D’Amato A., Fraver S., Palik B.J., Bradford J.B.
(2013): Structure and development of old-growth, unman-aged second-growth, and extended rotation Pinus resinosa
forests in Minnesota, USA. Forest Ecology and Manage-ment, 291: 110–118.
Smith G.F., Gittings T., Wilson M., French L., Oxbrough A., O’Donoghue S., O’Halloran J., Kelly D.L., Mitchell F.J.G., Kelly T., Iremonger S., McKee A.M., Giller P. (2008): Identifying practical indicators of biodiversity for stand-level management of plantation forests. Biodiversity and Conservation, 17: 991–1015.
Spies T.A. (1998): Forest structure: a key to the ecosystem. Northwest Science, 72: 34–39.
Spies T.A. (2004): Ecological concepts and diversity of old-growth forests. Journal of Forestry, 102: 14–20.
Stephenson N.L. (1999): Reference conditions for giant se-quoia forest restoration: structure, process, and precision. Ecological Applications, 9: 1253–1265.
Sterba H. (2008): Diversity indices based on angle count sampling and their interrelationships when used in forest inventories. Forestry 81: 587-597.
ter Braak C.J.F., Šmilauer P. (2002): CANOCO Reference Manual and CanoDraw for Windows User›s Guide: Soft-ware for Canonical Community Ordination (version 4.5). Ithaca, NY, USA. Available at www.canoco.com
Tuten M.C., Meador A.S., Fu P.Z. (2015): Ecological res-toration and fine-scale forest structure regulativ in southwestern ponderosa pine forests. Forest Ecology and Management, 348: 57–67.
Uotila A., Maltamo M., Uuttera J., Isomaki A. (2001): Stand structure in seminatural and managed forests in eastern Finland and Russian Karelia. Ecological Bulletins, 49: 149–158.
Uotila A., Kouki J., Kontkanen H., Pulkkinen P. (2002): As-sessing the naturalness of boreal forests in eastern Fen-noscandia. Forest Ecology and Management, 161: 257–277. Vacek S., Vacek Z., Podrazský V., Bilek L., Bulušek D.,
Štefančik I., Remeš J., Šticha V., Ambrož R. (2014): Structur-al diversity of autochthonous beech forests in Broumovske Stěny national nature reserve, Czech Republic. Austrian Journal of Forest Science, 131: 191–214.
Vanderwel M.C., Caspersen J.P., Woods M.E. (2006): Snag dynamics in partially harvested and unmanaged northern hardwood forests. Canadian Journal of Forest Research, 36: 2769–2779.
Viewegh J., Kusbach A., Mikeska M. (2003): Czech forest eco-system classification. Journal of Forest Science, 49: 74–82. Weiner J. (1985): Size hierarchies in experimental populations
of annual plants. Ecology, 66: 743–752.
Weiner J. (1990): Asymmetric competition in plant popula-tions. Trends in Ecology and Evolution, 5: 360–364. Zobel K., Zobel M., Peet R.K. (1993): Change in pattern
diversity during secondary succession in Estonian forests. Journal of Vegetation Science, 4: 489–498.
Received for publication October 22, 2015 Accepted after corrections December 4, 2015
Corresponding author: