2012. Vol.3, Special Issue, 923-930
Published Online October 2012 in SciRes (http://www.SciRP.org/journal/ce) http://dx.doi.org/10.4236/ce.2012.326140
Validity, Reliability and Equivalence of Parallel Examinations
in a University Setting
*
Bunmi S. Malau-Aduli, Justin Walls, Craig Zimitat
School of Medicine, University of Tasmania, Hobart, AustraliaEmail: [email protected], [email protected], [email protected]
Received July 9th, 2012; revised August 10th, 2012; accepted August 22nd, 2012
A key issue to address in the design and implementation of any assessment system is ensuring its reliabil-ity and validreliabil-ity. Universreliabil-ity assessment policies often require staff to prepare parallel examinations for students who are unable to sit the initial examination. There is little published literature to give confidence to staff or students that these examinations are indeed reliable or equivalent. This study was conducted to determine the validity, reliability and equivalence of two parallel examinations that have been developed under highly defined quality assurance (QA) processes in a university setting. Collated assessment results for all the 76 participants who sat the parallel examinations were subjected to statistical and correlational analysis to test for significant differences between mean scores and their associated standard deviations. Item analysis was conducted for each assessment by computing the difficulty index (DIF), discrimination index (DI) and Kuder-Richardson 20 (KR-20) reliability using classical test theory. Results indicated comparative proportions of difficulty, functional distractors and internal consistency of the assessment items on both examinations. Comparison of student performances in both examinations revealed that there was no significant difference in mean scores. However, a highly positive and significant correlation (r = 0.82) between student total scores in both examinations was evident. Approximately two thirds (62.5 %) of students with low scores in the first examination also achieved low scores in the second examina-tion. Furthermore, two thirds of the students were ranked in the same order based on performance in both examinations. The established QA processes for assessment in the school provided a strong basis for the generation of multiple sources of data to support arguments for the validity of examinations. It is possible to develop valid, reliable and equivalent parallel tests in university settings with the presence of well-defined QA processes.
Keywords: Parallel Examinations; Quality Assurance; Assessment
Introduction
Universities place considerable emphasis on the development of policies and guidelines that govern examination processes. Well documented policies, strategies and processes, blueprint-ing to facilitate adequate samplblueprint-ing, feedback to students and assessors and evaluation of the overall process are important elements of any assessment enterprise, however Fowell et al. (1999) argue that insufficient attention is paid to the evaluation of assessment. The latter can be usefully elaborated to include psychometric or statistical analysis of components of the ex-amination or items, establishment of measures of reliability and benchmarking to review pass/fail standards for the examination. Kane (2006) and Schuwirth et al. (2011) identify key questions in support of validity arguments, and highlight the importance of validity data in supporting consistent decision making as a result of assessment. The collation of evaluation data is neces-sary to provide supporting evidence, and hence confidence in the inferences that will be drawn from assessment in higher education (Kane, 2006). In this case study, we demonstrate the value of quality assurance processes in the generation of evi-dence to support validity of assessment activities in a medical course.
In Australian universities, assessment policies hold to tenets
of reliability, validity and fairness. Fairness includes notions of reliability, validity, transparency and ethical decision making, but it also means that students should be given equal opportu-nity to demonstrate their learning, free of any disadvantage through identification, language, disability or illness. In the latter case, assessors prepare two or three equivalent versions of each examination (i.e. parallel forms of the test (Tavakol & Dennick, 2011)—the ordinary examination (OE) that most students sit, a deferred ordinary examination (DO) for students who were ill or unable to sit the ordinary examination, and a supplementary (Supp) examination for students with borderline scores. (The names vary across Australian medical courses). It is assumed that each of these examinations is valid, reliable and equivalent (Norcini et al., 2011), although there is usually in-sufficient psychometric or statistical data to support such as-sumptions. This paper aims to provide evidence of the validity, reliability and equivalence of such parallel examinations/tests.
Contemporary assessment theory considers the primacy of construct validity, which draws upon theory and evidence to give meaning to assessment. Typically evidence for validity is drawn from five areas to support confidence in the inferences made from assessment: curriculum content; data management; statistical analyses of test data; correlational analyses; and ef-fects of assessment (Kane, 2006; Downing & Haladyna, 2009).
cific mix of evidence needed for validation depends on the inferences being drawn and the assumptions being made (Mes-sick, 1989), and extends beyond the validity of the assessment instruments that generate test score data. As assessment re-gimes become more complex and the stakes related to assess-ment outcomes increase, the greater the need for multiple sources of data to support the validity of assessment. Our as-sessment quality assurance (QA) processes were conceptualised in line with current unitary validity theory (Kane, 2006; Down-ing & Haladyna, 2009) to generate evidence for medium stakes examinations. The requirement for validity evidence for as-sessment through the early years of our medical course is mod-est; however it peaks at the preclinical-clinical transition and graduating examinations.
Academic staff is typically focused on writing questions from their discipline, usually at the expense of the “bigger pic-ture” and question quality. Curriculum content evidence for validity relates to the selection of assessment instruments, alignment of assessment tasks/items with intended learning outcomes, sampling of items across domains of the curriculum, examiner training and the quality of test items. Blueprinting serves to guide the selection of specific assessment instruments, strategies, and more importantly, their development through the specification of the content to be assessed (Hamdy, 2006). Blueprinting mitigates against two significant threats to validity, “construct under-representation” (CU), the biased or under- sampling of course content and “construct irrelevance” (CI). CI may arise from a “systematic” error as a result of the poor choice of assessment instrument for the outcomes being as-sessed (Downing, 2002). But it may also affect a small propor-tion of students if it arises from poor training of assessors and role player/standardised patients such that students are not ex-posed to the same test stimuli (e.g. at different sites) or assessed in the same manner. In this case study, each of the examina-tions were blueprinted to ensure representative and consistent sampling across content domains and alignment with learning outcomes (Jozefowicz et al., 2002; Hamdy, 2006; Hays, 2008), assessors were trained, and internal peer review processes (Malau-Aduli & Zimitat, 2011) were used to evaluate coverage and to refine test items.
Ensuring the integrity of data arising from the administration of assessment is key for any validity argument. In the first in-stance, identity and fraud management tag assessment data to the correct individual. The use of double data entry methods and optical scanning forms with checking by software algo-rithms improves the accuracy of data transfers. Software was developed to automate some processes, particularly those re-lated to generating psychometric reports and student feedback increasing efficiency and decreasing chances for human error to affect data management. The introduction of quality assurance processes, assessment training manuals and automated report-ing have all provided significant improvement in consistency of data handling and greater confidence in systems.
Statistical and correlational analyses of assessment data pro-vide important epro-vidence to support or refute validity claims. Item analyses—difficulty, discrimination and internal consis-tency of the test, inter-rater reliability etc.—are routinely per-formed as part of quality assurance processes to provide indices of reliability (Tavakol & Dennick, 2011). Reliability refers to the stability of test scores upon re-testing of examinees which is a fundamental requirement for making meaningful interpreta-tions of test data. Correlational validity evidence may be used
to assert positive relationships between performance on two tests of similar abilities (e.g. as students progress through the course), or conversely negative correlations between scores on tests of different abilities. High stakes examinations have high reliability thresholds, whereas it is moderate for many medical course examinations except the final clinical examinations. In our case study, statistical and correlational validity evidence are routinely generated by the QA process.
The final type of data for validity evidence is drawn from the decision making process and its consequences for examinees and others. The documentation of standard setting processes, standard error of measurement associated with cut scores and use of coded candidate details all contribute to this evidence. However it can also extend to correlation of assessment out-comes with later assessments (specialty examinations) or ele-ments of professional practice. Benchmarking of assessment processes and graduate outcomes are more recent types of evi-dence collected to support assertions of course quality as well as assessment. Some of this data can be collected immediately, and is part of our quality assurance processes, whereas data relating to postgraduate activity falls within the realm of course evaluation.
Context of the Case Study
The Tasmanian School of Medicine (TSoM) offers a five- year case-based undergraduate medical degree. Vertical inte-gration of the curriculum is promoted through a thematic struc-ture usage in all the five years of the program. The first two years of the course provide a systems-based introduction to the foundations of medicine, with an early opportunity to develop communication and clinical skills. Assessment involves forma-tive and summaforma-tive elements, with an emphasis on end of se-mester examinations. Well-developed QA processes around assessment (Malau-Aduli et al., 2011) were implemented at the TSoM in 2009 by the Medical Education Unit (MEU). These processes included blueprinting of educational objectives, se-lecting appropriate test formats and applying assessment strate-gies to achieve adequate levels of reliability. They also included the implementation of appropriate standard-setting, assessor and role-player training, decision-making procedures and peer review of assessment items to minimise item writing flaws prior to being administered to students (Malau-Aduli et al. 2011).
reliability estimates. Therefore, the objective of this paper is to evaluate the validity, reliability and equivalence of these paral-lel tests that were developed under well-defined quality assur-ance (QA) processes.
Methods
Participants and Procedures
Second year medical students (N = 114) sitting an integrated basic and clinical science (OE) examination were inadvertently administered a MCQ examination paper (OE) which included answers. The examination was re-administered to all students, using the parallel (DO) paper. However, only seventy-six (76) out of the one hundred and fourteen (114) students in the cohort sat the equivalent examination (Supp) three days later. The scores of these 76 students from the dataset were used for evaluation of these examinations. Clearance was obtained from the relevant ethics committee for this study.
Data Analysis
Collated assessment results for all the 76 participants who sat both examinations were subjected to statistical analysis using general linear model (GLM) procedure in SAS (SAS, 2009) in a multivariate least squares analysis of variance to test for sig-nificant differences between mean scores, their associated standard deviations and descriptive statistics of all the variables. Student scores were compared in the parallel examinations. Significance at the 5% level was established using the least significant difference technique, while Duncan’s multiple range tests was used for mean separation where significant differ-ences were detected. Item analysis was conducted for each assessment by computing the difficulty index (DIF), discrimi-nation index (DI) and Kuder-Richardson 20 (KR-20) reliability using the classical test theory as provided in IDEAL 4.1, an Item Analysis Program (Precht et al., 2003). Details of the qual-ity criteria chosen for each of these qualqual-ity indicators have been described previously (Malau-Aduli & Zimitat, 2011). Means of item difficulty, discrimination index and number of functioning distracters per item for all the MCQs were also computed.
Results
Comparative Analysis of the Two Examinations
Descriptive statistics for the MCQ examinations are por-trayed in Table 1. A comparative appraisal of student perform-ances in both examinations revealed no significant difference in mean scores (Table 1). However, there was a highly significant (p < 0.001) and positive correlation (r = 0.82) between total student scores in both examinations (not shown). Although the differences were not statistically significant, absolute mean scores were observed to be higher in the first examination than in the second examination (36.4 vs. 33.8). However, there were higher minimum and maximum scores in the second examina-tion (19.0 vs. 14.0 and 46.0 vs. 45.0, respectively). The first examination recorded a higher reliability index compared to the second examination (0.71 vs. 0.68). Similar trends were ob-served in student performances in the different disciplines as-sessed in both examinations.
[image:3.595.309.537.109.235.2]Significantly higher (p < 0.01) mean scores were achieved in
Table 1.
Descriptive statistics for both examinations.
Criteria First Exam Second Exam
Number of Items in Exam 50 50
Number of Examinees 76 76
Mean Score 36.4 33.2
Minimum Score 14.0 19.0
Maximum Score 45.0 46.0
Standard Deviation 5.3 4.8
Reliability Index 0.71 0.68
70.88% respectively) compared to the other assessed disciplines in both examinations (Figure 1). Students performed somewhat better in the first set of Biochemistry questions than the second and vice versa in the Gross Anatomy questions.
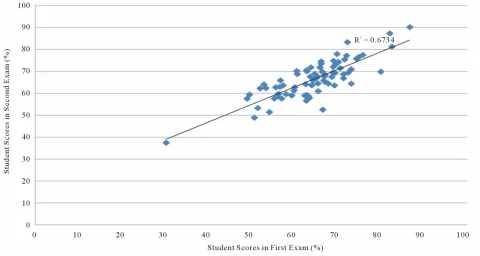
In accordance with the University regulations, the pass mark for each examination was set at 50%. Individual student per-formances revealed that one student failed both examinations with 30.27% in the first examination and 37.57% in the second examination. Approximately two thirds (62%) of the students with low scores in the first examination also achieved low scores in the second examination. Figure 2 shows the linear regression of student scores in the parallel examinations. The coefficient of determination (R2 = 0.67) is indicative of the precision accuracy that explains 67% of the observed variation between students’ scores in both examinations. Two thirds of the students were ranked in the same order based on perform-ance in both examinations. Compared with performperform-ance on the first examination, 5% of students ranked higher on the second examination, while 30% ranked lower in the second exam (Figure 3).
Item Analysis
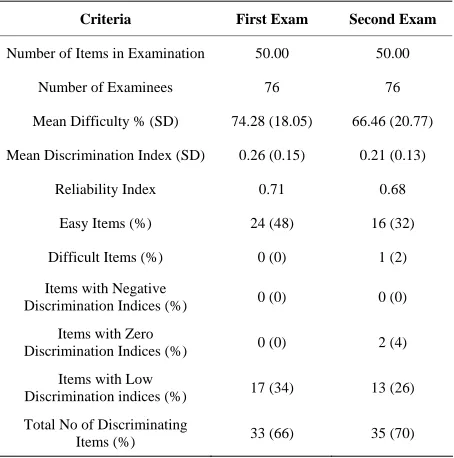
Table 2 shows the item analysis results for both examina-tions. Mean difficulty of the test items on the two examinations was similar (74% vs. 67%). On the first examination, twenty- four items lay outside the reference range for difficulty level (DIF): all the 24 items appeared to be too easy. Seventeen items on this examination showed very low discrimination (0 - 0.15) between students who achieved scores in the highest and lowest quartiles. Sixty six percent (n = 33) of the items had signifi-cantly high discrimination indices with a mean discrimination index of 0.26. One third of the items on this examination had distractors that were not functioning effectively in their role. The reliability coefficient (KR-20), which is a measure of the internal consistency of the test, was 0.71.
Figure 1.
Comparison of students’ performances in both examinations across the different disciplines.
Figure 2.
Comparison of students’ performances in both examinations across the different disciplines.
examinations to identify non-functional distractors within each MCQ item. Two hundred distractors associated with the fifty (50) MCQs were assessed in each of the two examinations. Similar patterns were observed in both examinations. In the first examination, 66% (n = 132) of the distractors were
[image:4.595.57.542.88.362.2] [image:4.595.58.538.394.650.2]Figure 3.
[image:5.595.57.544.85.345.2]Change in decile ranking of students in both examinations.
Table 2.
Item analysis for both examinations.
Criteria First Exam Second Exam
Number of Items in Examination 50.00 50.00
Number of Examinees 76 76
Mean Difficulty % (SD) 74.28 (18.05) 66.46 (20.77)
Mean Discrimination Index (SD) 0.26 (0.15) 0.21 (0.13)
Reliability Index 0.71 0.68
Easy Items (%) 24 (48) 16 (32)
Difficult Items (%) 0 (0) 1 (2)
Items with Negative
Discrimination Indices (%) 0 (0) 0 (0)
Items with Zero
Discrimination Indices (%) 0 (0) 2 (4)
Items with Low
Discrimination indices (%) 17 (34) 13 (26)
Total No of Discriminating
Items (%) 33 (66) 35 (70)
[image:5.595.59.286.401.630.2]the first examination and 2.60 in the second examination. There was a similar pattern in the distribution of functioning distrac-tors per item in both examinations, with an increase in the per-centage of items with two and three functional distractors (28% & 16% for the first examination; 34% & 12% for the second examination. In the first examination, there were 28% of items with one functional distractor and 8% of items with four func-tional distractors vs. 24% and 4% respectively in the second examination.
Table 3.
Distractor analysis for both examinations.
Criteria First Exam Second Exam
Number of Items in examination 50 50
No of distractors assessed 200 200
Distractors with frequency = 0% n (%) 19 (9.5) 21 (10.5)
Distractors with frequency < 5% n (%) 49 (24.5) 49 (24.5)
Functioning distractors per test n (%) 132 (66) 130 (65)
Functioning distractors per item M (SD) 2.64 (1.21) 2.6 (1.14)
Functioning distractors per item n (%)
None 10 (20) 6 (12)
One 14 (28) 12 (24)
Two 14 (28) 17 (34)
Three 8 (16) 6 (12)
Four 4 (8) 2 (4)
Discussion
[image:5.595.306.541.401.602.2]The QA processes provided qualitative evidence to support argument for curriculum content validity. Developing, blue-printing and editing all the test items for both examinations at the same time ensured that the test items on both examinations covered similar content domains and were aligned to the learn-ing outcomes underscorlearn-ing the reports by Jozefowicz et al. (2002), Hamdy (2006), Malau-Aduli & Zimitat (2011). This is indicated in the similar overall mean scores and disciplines/ subcategories scores obtained by students in both examinations. The comparative disciplines/subcategories results also echo equal levels of quality and difficulty of the questions in both examinations. The high correlation between the mean scores on both examinations (r = 0.82) indicates that the sets of test items measured the same content area/construct. Results from this study show the comparative proportions of easy, difficult, recall, non-discriminating and non-functional items in both examina-tions. The observed difference in scores in Biochemistry and Gross Anatomy may be a reflection of how students studied for the second examination (Supp), after the experience of sitting the first examination (DO). In this case, routine statistical data arising from QA processes also support the content equivalence of the two examinations. Data management for the two exami-nations was undertaken according to the QA process with mechanisms such as key validation, double entry and accuracy of scores.
Statistical and correlational analyses of examination data are routinely conducted to provide evidence of reliability as part of QA processes. The observed high reliability indices and similar student ranking in both examinations indicate that with the second examination, examinees obtained similar scores on re-testing (Supp examination) as they did on the first (DO exami-nation). The summary statistics (item analysis) indicated similar trends in performance prompts, discrimination indices, and functionality of distractors and internal consistency reliability of both examinations. Reliability coefficients allow the quanti-fication and estimation of the random errors of measurement in assessment (Downing, 2004). The resulting high prediction accuracy (67%), and correlation coefficient (0.82) in the com-parison of both examinations in this study is an indication of the convergence of validity evidence (Downing, 2003). This indicates that the assessment items measured the same abilities, establishing some commonalities between the constructs as-sessed in both examinations. The high correlation between student scores in both examinations confirms that the test items in both examinations measured the same construct/content ar-eas derived from blueprints. The students obtained similar scores (and in seven instances, the same scores) on retesting as they received the first time. These data confirm that with the implementation of QA processes, it is possible to generate equivalent examinations that reproduce test scores with a high level of certainty (Downing & Haladyna, 2009).
Consequential validity evidence relates to the impact of as-sessment on teaching and learning (Downing & Haladyna, 1997). The reproducibility of the pass-fail decision is also a very important source of validity evidence (Downing, 2003; Downing & Haladyna, 2009). The parallel examinations have reproduced assessment outcomes for students with a high level of certainty as both examinations identified the same poorly achieving student, who failed in both examinations and about two thirds (62%) of the low achieving students in the first ex-amination, also scored poorly in the second examination. Al-though there was an administrative error, the results of the
par-allel examinations and the outcomes of the assessment on stu-dent scores have indicated no adverse consequences for the students. The examinations are equivalent in this sense. This suggests that, under the current assessment regime, the School should have confidence in the decision to allow students to “resit” the examination and achieve the “best score” based upon performance on either examination.
The QA processes developed by the School were initially focused on managing internal validity threats. The University typically manages external validity threats through Examination Office processes. On this occasion, the problem arose at the School/Examinations Office interface—a communication fail-ure. A debriefing with staff identified further communications concerns, and subsequently an Accountability Matrix (Appen-dix 1) was developed to provide greater clarity about roles and responsibilities internally, and formalised relationships with the Examinations Office. There was also an opportunity to consider emergent sources of error; as a result training for the use of optical mark recognition (OMR) scanner was introduced for new staff and new software flags were developed to automati-cally check accuracy of data entry. Clearly potential sources of error and new threats for validity arise all the time, and QA processes need to be reviewed regularly.
The QA processes generate significant volume of data, but how much is needed for a moderate stakes examination? Schu-wirth et al. (2011) suggest that three major inferences are re-quired to quantify the consistency of an assessment instrument, as well as provide validity evidence for the observed scores. These inferences are: 1) would the students obtain the same score on the parallel test as they did on the actual test? 2) would the students take the same place in the rank ordering from best to worst performing student on the parallel test as they did on the actual test? 3) would the students obtain the same pass-fail decisions as they did on the actual test? The high positive cor-relation (r = 0.82) and the 67% precision accuracy of the ob-served variation between student scores in both examinations confirm that majority of the students have obtained similar scores (seven of them obtained exactly the same score in both examinations) in the second examination as they did in the first examination. Most of the students (65%) have also taken the same place in the decile ranking order from best to worst per-forming student on both examinations. The students have also obtained the same pass/fail decisions, with the same student failing in both examinations. On this basis, there is strong evi-dence in support of the validity, reliability and equivalence of the two examinations and that no group of students has been advantaged in this process.
Caution should be taken in any generalisations drawn from this study. Different institutions have different policies and guidelines and QA processes for assessment which may affect the development of “equivalent” examinations for students. The group of students “resitting” the examination may not have been representative of the whole cohort which could make a difference to the outcomes of the study. Not all sources of error may have been identified and accounted for in this study, though we believe sufficient evidence has been marshaled in support of our conclusions about a medium stakes examination.
Conclusion
so that resulting data and grades are defensible. Statistical and correlational data in this case study support the view that well- defined QA processes reduce the threats to validity of assess-ment. The establishment of QA processes in the development of examinations can ensure content representativeness of the test materials, the reproducibility and generalisability of the scores, the statistical characteristics of the assessment questions and consistency of pass-fail decisions made from the assessment scores. Developing parallel examinations to address notions of fairness in university assessment policies is possible when strong QA is in place, and does not appear to advantage any group of students. The detection of errors and validity threats and revision of QA processes should be an ongoing activity.
Acknowledgements
The authors thank Dr Lisa Foa (the Unit Co-ordinator) and all the teaching staff who participated in developing the as- sessment items.
REFERENCES
Downing, S. M. (2002). Threats to the validity of locally developed multiple-choice tests in medical education: Construct-irrelevance variance and construct under-representation. Advances in Health Sci- ences Education, 7, 235-241. doi:10.1023/A:1021112514626 Downing, S. M. (2003). Validity: On the meaningful interpretation of
assessment data. Medical Education, 37, 830-837. doi:10.1046/j.1365-2923.2003.01594.x
Downing, S. M. (2004). Reliability: On the reproducibility of assess- ment data. Medical Education, 38, 1006-1012.
doi:10.1111/j.1365-2929.2004.01932.x
Downing, S. M., & Haladyna, T. M. (1997). Test item development: Validity evidence from quality assurance processes. Applied Meas- urement in Education, 10, 61-82. doi:10.1207/s15324818ame1001_4 Downing, S. M., & Haladyna, T. M. (2009). Validity and its threats. In
S. M. Downing, & R. Yudkowsky (Eds.), Assessment in health pro- fessions education (pp. 21-55). London: Routledge.
Fowell, S. L., Southgate, L. J., & Bligh, J. G. (1999). Evaluating as- sessment: The missing link? Medical Education,33, 276-281.
doi:10.1046/j.1365-2923.1999.00405.x
Hamdy, H. (2006). Blueprinting for the assessment of health profess- sionals. The Clinical Teacher, 3, 175-179.
doi:10.1111/j.1743-498X.2006.00101.x
Hays, R. (2008). Assessment in medical education: Roles for clinical medical educators. The Clinical Teacher, 5, 23-27.
doi:10.1111/j.1743-498X.2007.00165.x
Jozefowicz, R. F., Koeppen, B. M., Case, S. M., Galbraith, R., Swanson, D. B., & Glew, R. H. (2002). The quality of in-house medical school examinations. Academic Medicine, 77, 156-161.
doi:10.1097/00001888-200202000-00016
Kane, M. (2006). Content-related validity evidence in test development. In S. M. Downing, & T. M. Haladyna (Eds.), Handbook of test devel- opment (pp. 131-153). Mahwah, NJ: Lawrence Erlbaum Associates. Malau-Aduli, B. S., Zimitat, C., & Malau-Aduli, A. E. O. (2011). Qual-
ity assured assessment processes: Evaluating staff response to change.
Journal of Higher Education Management & Policy, 23, 1-23. Malau-Aduli, B. S., & Zimitat, C. (2011). Peer review improves the
quality of MCQ examinations. Assessment & Evaluation in Higher Education, 34, 1-13. doi:10.1080/02602938.2011.586991
Messick, S. (1989). Validity. In R. L. Linn (Ed.), Educational meas- urement (3rd ed., pp. 13-104). New York: American Council on Education and Macmillan.
Norcini, J., Anderson, B., Bollela, V., Burch, V., Costa, M. J., Duvivier, R., Galbraith, R., Hays, R., Kent, A., Perrott, V., & Roberts, T. (2011). Criteria for good assessment: Consensus statement and rec- ommendations from the Ottawa 2010 Conference. Medical Teacher, 33, 206-214. doi:10.3109/0142159X.2011.551559
Precht, D., Hazlett, C., Yip, S., & Nicholls, J. (2003). Item analysis user’s guide. Hong Kong: International Database for Enhanced As-sessments and Learning (IDEALHK).
SAS (2009). Statistical Analysis System Institute, North Carolina USA v.9.2.
Schuwirth, L., Colliver, J., Gruppen, L., Kreiter, C., Mennin, S., Onishi, H., Pangaro, L., Ringsted, C., Swanson, D., Van der Vleuten, C. P. M., & Wagner-Menghin, M. (2011). Research in assessment: Con- sensus statement and recommendations from Ottawa 2010 Confer- ence. Medical Teacher, 33, 224-233.
doi:10.3109/0142159X.2011.551558
Tavakol, M., & Dennick, R. (2011). Post examination analysis of ob- jective tests. Medical Teacher, 33, 447-458.
Appendix
Appendix 1.
Accountability Matrix for Written Examinations.
This matrix defines the tasks to be completed for the development of written exam papers in the MBBS (ordinary, deferred ordinary and supplemen-tary exam papers). It denotes the person accountable for specific actions (1); those involved in the decision making processes (2) and those who will be informed of the outcomes of decisions (3).
TASK Unit Coordinator MEU PDA
Assessment timelines and Excel workbook for entry of all assessment results 2 1 3
Blueprints and weightings of questions for each assessment 1 2 3
Initial Contacting of question writers 1 2 3
Follow-up with question writers 2 1 3
First draft of questions prepared 2 1 3
Format Questions 3 2 1
First draft of exam paper in KB 3 1 3
First check of questions 1 2 3
Peer review of questions 1 2 3
Final draft of exam paper 2 1 3
Format exam paper 3 2 1
Final exam paper in KB for QA 3 1 2
Sign-off on exam paper 1 3 3
PDF copy of exam paper to Exams Office—InSite/print locally 3 2 1
Shading of correct response on MCQ Answer Sheet 2 2 1
Collection and collation of exam papers 3 3 1
Scanning of MCQ answer sheets 3 2 1
SAQs to examiners for marking 2 3 1
Entry of students’ results into excel workbook 2 2 1
Sign-off on results 1 2 3
Results to exams office 2 3 1
Feedback to students & staff 2 1 3
Note: 1 = Accountable; 2 = Decision making team; 3 = Information network; MEU = Medical Education Unit; PDA = Program delivery and assessment team.
1. Evaluation of assessment is a neglected area of academic practice.
2. The use of well-defined quality assurance (QA) processes in the development of assessment items/examinations in medical education contributes to the generation of data in support of validity arguments for assessment.