ORIGINAL RESEARCH
Quantitative Hemodynamic Analysis of Brain
Aneurysms at Different Locations
A. Chien M.A. Castro S. Tateshima J. Sayre J. Cebral F. Vin˜uela
BACKGROUND AND PURPOSE: Studies have shown that the occurrence of brain aneurysms and risk of rupture vary between locations. However, the reason that aneurysms at different branches of the cerebral arteries have different clinical presentations is not clear. Because research has indicated that aneurysm hemodynamics may be one of the important factors related to aneurysm growth and rupture, our aim was to analyze and compare the flow parameters in aneurysms at different locations.
MATERIALS AND METHODS:A total of 24 patient-specific aneurysm models were constructed by using 3D rotational angiographic data for the hemodynamic simulation. Previously developed computational fluid dynamics software was applied to each aneurysm to simulate the blood-flow properties. Hemo-dynamic data at peak pulsatile flow were recorded, and wall shear stress (WSS) and flow rate in the aneurysms and parent arteries were quantitatively compared. To validate our method, a comparison with a previously reported technique was also performed.
RESULTS: WSS and flow rate in the aneurysms at the peak of the cardiac cycle were found to differ in magnitude between different locations. Multiple comparisons among locations showed higher WSS and flow rate in middle cerebral artery aneurysms and lower WSS and flow rate in basilar artery and anterior communicating artery aneurysms.
CONCLUSIONS:We observed changes in hemodynamic values that may be related to aneurysm
location. Further study of aneurysm locations with a large number of cases is needed to test this hypothesis.
B
rain aneurysm rupture is one cause of subarachnoid hem-orrhage and results in substantial rates of morbidity and mortality. Autopsy studies have reported that intracranial an-eurysms are common lesions and certain locations tend to have a higher rate of incidence.1Recent international studies have reported that some aneurysm locations have a higher risk of rupture than others.2-4Because little is known about the cause of brain aneurysms or the process by which they grow and rupture, studies of how anatomic location may affect brain aneurysms can help further understand this disease.5Vascular geometry, branching angles, and surrounding an-atomic structures, the features used to identify and specify an aneurysm, have previously been studied to find their relation-ships with the natural history of aneurysms.6-8Analyzing dif-ferences in parent artery geometry revealed that aneurysms with a large caliber of the proximal artery tended to rupture at a larger size.6Bifurcations beyond the circle of Willis approx-imated optimality principles, unlike those within the circle of Willis.7Moreover, the perianeurysmal environment has been suggested to influence aneurysm shape and risk of rupture, especially for locations with unbalanced contact constraint.8
Intra-aneurysmal hemodynamic characteristics are also believed to be an important factor for aneurysm growth and rupture.9-16With the help of advancements in medical
imag-ing, realistic aneurysm geometry and vascular structure can be incorporated into simulations to perform patient-specific he-modynamic analysis. This type of image-based hehe-modynamic research has shown that ruptured aneurysms tend to have a more complicated flow pattern.14,17Using a longitudinal data base, a recent hemodynamic study of aneurysm growth also reported that aneurysms are more likely to grow in regions of low wall shear stress (WSS).18Although studies have suggested that aneurysms at different locations tend to differ geometri-cally and clinigeometri-cally,1-4to our knowledge, whether aneurysms at different locations have different hemodynamic properties has not yet been reported. The aim of this study was to examine the hemodynamic parameters in aneurysms at different locations.
Materials and Methods
Data Collection and Imaging Technique
Twenty-four aneurysms from 4 of the common locations in cerebral arteries (anterior communicating artery [AcomA], middle cerebral artery [MCA], internal carotid artery [ICA], basilar artery [BA]) were selected from the University of California, Los Angeles interventional neuroradiology data base from November 2007 to June 2008. 3D rotational angiographic (3DRA) images (Integris; Philips Medical Systems, Best, the Netherlands) obtained before aneurysm emboliza-tion were collected and transferred to an Integris workstaemboliza-tion (Philips Medical Systems) for 3D voxel generation. The Table summarizes the details of the cases.
Hemodynamic Modeling of Aneurysms
The computational model for each aneurysm was reconstructed by using patient-specific computational fluid dynamics⫺simulation software developed by George Mason University.14,15,17,19-25 All 3DRA images were denoised and later segmented by using a region-growing algorithm.14,15,20,24A volumetric model generated by a 3D Received December 5, 2008; accepted after revision March 1, 2009.
From the Division of Interventional Neuroradiology (A.C., S.T., F.V.), David Geffen School of Medicine, University of California Los Angeles, Los Angeles, Calif; Department of Compu-tational Sciences (M.A.C., J.C.), George Mason University, Fairfax, Va; and Department of Biostatistics (J.S.), School of Public Health, University of California Los Angeles, Los Angeles, Calif.
Paper previously presented in part at: Annual Meeting of Society of Neurointerventional Surgery, July 28 –August 1, 2008; Lake Tahoe, Calif.
Please address correspondence to Aichi Chien, PhD, Division of Interventional Neuroradi-ology, David Geffen School of Medicine at UCLA, 10833 LeConte Ave, Box 951721, Los Angeles, CA 90095; e-mail: [email protected]
DOI 10.3174/ajnr.A1600
INTERVENTIONAL
ORIGINAL
advancing front technique was used to define the geometry of the computational domain. To have the same inflow settings for all the aneurysm simulations, aneurysms located at the anterior circulation were all modeled from the ICA cavernous segment, and aneurysms located at posterior circulation were all modeled from the BA segment.
Previously reported pulsatile flow profiles for the ICA and BA measured from a healthy subject by using phase-contrast MR imag-ing (Signa 1.5T scanner; GE Healthcare, Waukesha, Wis) were im-posed as the inflow for the computational fluid dynamics mod-els.14,21,26The flow profiles were prescribed by using the Womersley solution for the fully developed pulsatile flow in a rigid straight tube13-15,27and were scaled according to the cross-sectional area of the inflow vessels for each model.28Assuming that all the distal vas-cular beds have similar total resistance to flow, traction-free boundary conditions with the same pressure level were applied to all the model outlets. Blood flow was modeled as an incompressible Newtonian fluid. The governing equations were the unsteady Navier-Stokes equations in 3D. The blood attenuation was 1.0 g/cm3and the viscos-ity was 0.04 poise. Vessel walls were assumed rigid, and no-slip boundary conditions were applied at the walls. Numeric solutions of the Navier-Stokes equations were obtained by using a fully implicit finite-element formulation. Two cardiac cycles were computed by using 100 steps per cycle, and all the results presented corresponded to the second cardiac cycle.13-15,27Details of the simulation settings have been previously described.14,15,17,19-25
Quantitative Hemodynamic Analysis and Validation Method
After the hemodynamic simulation, for each aneurysm, the blood-flow rate and WSS at the peak of the cardiac cycle were collected both from the aneurysm and the parent artery. We applied a previously developed technique to perform quantitative analyses by using a pre-defined 6-region method.29Hemodynamic data were collected from 3 equal sections in the aneurysm dome, with regions defined crossing the aneurysm dome at the level of the aneurysm neck, middle, and top (Fig 1). Likewise, data in the vessel were recorded from 3 regions of
the parent artery— crossing at the proximal end of the aneurysm, the center of the aneurysm, and the distal end of the aneurysm. For an-eurysms located at multi-avenue terminals or bifurcations, 1 region crossed the proximal point of the bifurcation at the main artery and 2 regions crossed the arteries at the distal end of the aneurysm.
Although the 6-region method reduces the complexity of hemo-dynamic results, its consistency with hemohemo-dynamic data collected from the entire aneurysm dome and parent artery needed to be eval-uated. Due to the complexity of the data-analysis process, few studies have detailed the collection of hemodynamic data from the entire aneurysm dome and parent artery. However, one relatively recent report by Shojima et al13extracted data from the entire aneurysm dome and MCA to study MCA aneurysms. We reproduced their ap-proach and compared results collected from the entire dome and parent artery with the 6-region method. Because the method of Shojima et al13was only applicable to study WSS in MCA aneurysms, 10 MCA aneurysms from the University of California, Los Angeles interventional neuroradiology data base (from November 2007 to June 2008) were selected for the method comparison.
Statistical Methods
Results were expressed as mean value and SD. Repeated measure-ments and analysis of variance were used. Multivariate tests and mul-tiple comparisons between location groups were performed to see the relationship of hemodynamic properties and locations. The sign test30was used for the method comparison. The Spearman rank cor-relation was used to find the cor-relationship between vessel dimensions and hemodynamic values. The statistical significance level was set at .05.
Results
Hemodynamic Properties in Aneurysms
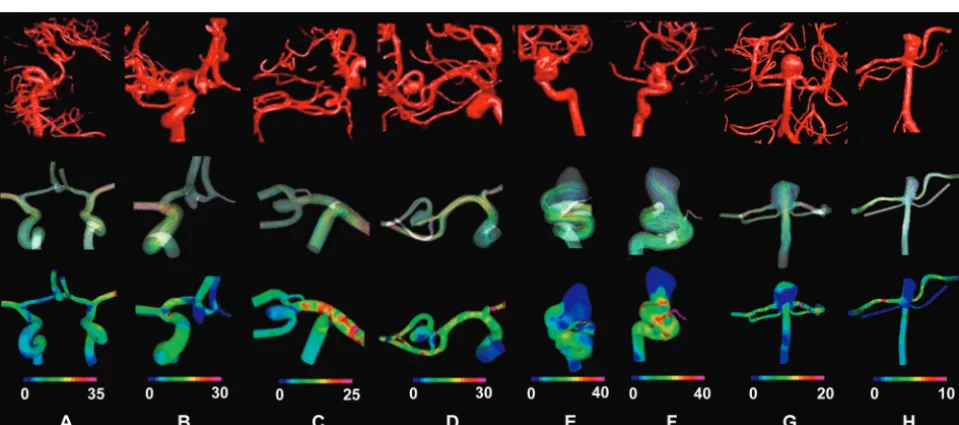
The representative hemodynamic properties of brain aneu-rysms from different locations are shown in Fig 2. Patient-specific aneurysm models were reconstructed based on the 3DRA images (Fig 2, top row). The instantaneous streamlines Summary of aneurysm cases*
Characteristics Group 1 Group 2 Group 3 Group 4 Summary
Age (year)
Mean 65.2 64.2 51.3 57.3 59.5
Range 48–81 42–79 24–70 47–70 24–81
Sex (No. of patients)
Female 5 5 6 3 19
Male 1 1 0 3 5
Unruptured-ruptured aneurysms (No. of patients) 4–2 4–2 4–2 4–2 16–8
Total No. of aneurysms 6 6 6 6 24
Largest diameter of aneurysm (mm)
Mean 5.2 6.25 7.2 11.0 7.4
Range 3.6–8.2 5.1–8.1 5–8 6–15 3.6–15
Diameter of aneurysm neck (mm)
Mean 3.5 3.7 4.4 7.17 4.7
Range 2.3–6.5 3.3–4 2.7–7 4–14.6 2.3–14.6
Size of aneurysm (No. of patients)
⬍7 mm 5 4 2 1 12
7–12 mm 1 2 4 2 9
13–24 mm 0 0 0 3 3
Diameter of parent artery vessel lumen (mm)
Mean 2.1 2.2 3.9 3.4 2.9
Range 1.3–3.2 1.6–2.7 3.4–5.3 2.7–4.4 1.3–4.4
at the peak of systole, recorded from the trajectory of the in-stantaneous 3D velocity field,29 show the flow pattern in the aneurysms (Fig 2, the second row). The third row is the distribution of WSS for each aneurysm. As previously shown, the patient-specific hemodynamic simulation allowed us to study flow properties in various aneurysms; however, the re-sults yielded from the simulation can be complicated and dif-ficult to compare, especially when studies include a variety of aneurysms.
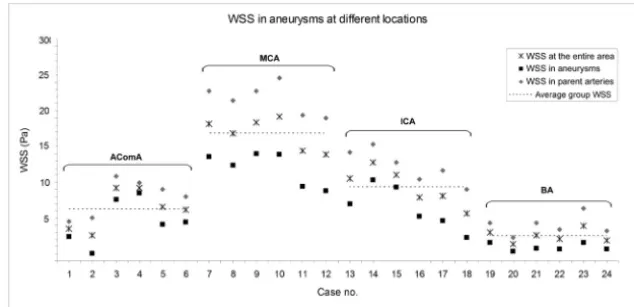
For quantitative comparison of hemodynamic properties,
we calculated the WSS and flow rate from different regions of aneurysms. The average WSS in the aneurysms, parent arter-ies, and the entire aneurysm area (both aneurysm and parent artery regions) is shown in Fig 3. WSS was found to differ among locations in aneurysms (P⫽.01) and in parent arteries (P⫽.009). Multiple comparisons showed that the BA aneu-rysms had the lowest average WSS, lower than AcomA (P⫽ .009), ICA (P⬍.001), and MCA (P⬍.001) aneurysms. WSS in AcomA aneurysms was lower than that in MCA aneurysms (P⬍.001).
Fig 1.Schematic representations of regions for hemodynamic data analysis.A, Regions in the arteries of terminal or bifurcation aneurysms.B, Regions in the arteries of sidewall aneurysms.
C, Regions in the aneurysm dome.DandE, Application to patient-specific aneurysm models are shown for a bifurcation aneurysm (D) and a sidewall aneurysm (E).
Fig 2.Representative hemodynamic results for AcomA (AandB), MCA (CandD), ICA (EandF), and BA (GandH) aneurysms. Top row is the 3DRA images obtained for each aneurysm
[image:3.594.135.453.41.305.2] [image:3.594.56.536.341.553.2]The average blood-flow rate calculated for the aneurysms, parent arteries, and the entire aneurysm area is shown in Fig 4. We found the trend of flow rate in the parent arteries (P⬍ .001) and aneurysms (P⫽.071) also differed among loca-tions. Aneurysms at the BA had the lowest average flow rate, and multiple comparisons showed that the flow rate in BA aneurysms was lower than that in AcomA (P⫽.018), ICA (P⬍.001), and MCA (P⬍.001) aneurysms. Flow in AcomA aneurysms was slower than that in MCA (P⬍.001) and ICA (P⫽.05) aneurysms.
Technique Validation
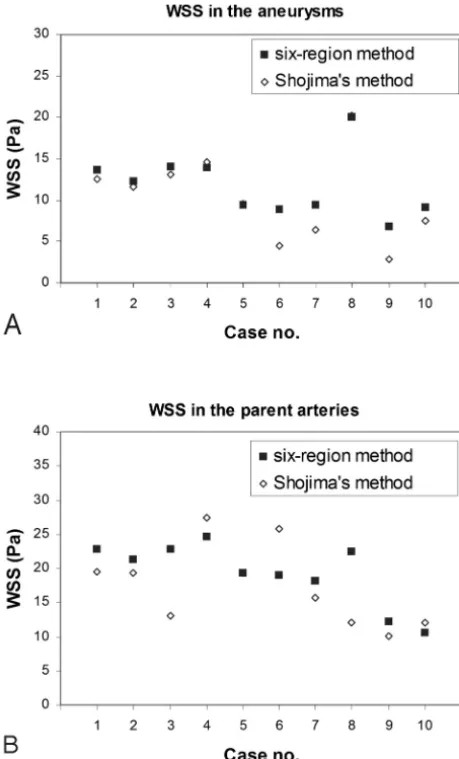
Figure 5 shows the average WSS in 10 MCA aneurysms ob-tained by the present method, which collected data from 6 regions, and by the method of Shojima et al,13which found WSS averages in the aneurysm dome and parent artery. The average WSS in the aneurysms obtained by the present method and by Shojima et al were 10.3⫾5.2 Pa and 11.7⫾3.6 Pa, respectively (Fig 5A). The average WSS in the parent arter-ies was 19.3⫾4.6 Pa and 17.4⫾5.9 Pa, respectively (Fig 5B). We found that the present method and that of Shojima et al yielded similar results and there was no statistical difference between the techniques (P⫽.344).
Discussion
Patient-specific hemodynamic analysis enabled us to simulate intra-aneurysmal flow properties for a diversity of aneurysm
shapes and complicated vascular structures. In this study, we quantitatively analyzed hemodynamic data in aneurysms and found that there were hemodynamic differences among aneu-rysms at different locations. Many causes may produce differ-ences in aneurysmal hemodynamic values among locations: aneurysm geometry, vessel geometry, parent artery size and curvature, or blood flow rates. From this study, we were not able to determine the reason for such hemodynamic differ-ences because of the small number of cases. Furthermore, many other factors affecting aneurysms were not considered, including aneurysm size, patient age and sex, and population. Studies incorporating those groups with more cases are also important to find out how hemodynamic changes among lo-cations are associated with these parameters.
We found different hemodynamics properties according to location. The results may not be surprising because different-sized vessels have different flow.31Such evidence has not yet been shown in human brain aneurysms; instead, many hemo-dynamic studies have combined aneurysms in various loca-tions.14,18,32Although this is a preliminary study and further proof of this finding is needed, we think that on the basis of our results, consideration of hemodynamic variation between lo-cations will be important for future studies. Furthermore, in our cases, no significant correlations were found between par-ent artery size and aneurysm WSS (⫽ ⫺0.357;P⫽.086) and flow rate (⫽ ⫺0.286,P⫽.175), suggesting that due to the complexity of the brain vascular structure, using only the size
Fig 4.Flow rates in aneurysms at different locations. Note the average flow in arteries and aneurysms and the average flow velocity in the entire aneurysm area.
[image:4.594.134.451.44.197.2] [image:4.594.136.450.233.388.2]of the vessel may not be enough to understand the flow prop-erties in aneurysms.
Hemodynamic influences have important effects on vascu-lar diseases.28,33-36WSS, caused by blood flow, is a tangential force acting on the endothelial surface. Studies have shown that though WSS is a small force that is insufficient to tear the vessel wall, it is an important determinant of endothelial cell function especially when WSS is low.28,34,35Recently, studies evaluated the presence of endothelial cells in human aneu-rysms37,38and reported that low WSS in aneurysms may relate to the risk of rupture and aneurysm growth.13,18Consistent with previous studies,13,29our results showed that WSS was low in aneurysms, compared with the arteries (P ⫽.005). Moreover, because the low WSS in aneurysms varies among locations, whether this variation associates with the rate of endothelium function deterioration or the rate of aneurysm growth is a question needing further investigation. Studies combining histological findings and flow simulation in aneu-rysms will be helpful in understanding the meaning of the different ranges of WSS found in each location.
Limitations
We compared hemodynamic properties in aneurysms among various aneurysm locations; however, even aneurysms at the same location have anatomic variations that may also affect the hemodynamic properties. Because of the limited number of cases, we were not able to compare how these anatomic differences affect aneurysm hemodynamics. Moreover, the case selection in this study was not ideal, with, for example, more large aneurysms in the BA group than in other locations. This case selection was affected by the patients’ enrollment patterns in our medical center. Although we found a statisti-cally significant difference among groups in our cases, these variations in anatomy and size were included. Further re-search with more detailed anatomic categorization and com-bining a multicenter data base would still be needed to provide thorough understanding of the association among aneurysm hemodynamics and locations and anatomic variations.
Our hemodynamic study used a human pulsatile profile with inflow conditions scaled according to the patients’ inflow vessel sizes. A simulation with patient-specific inflow condi-tions will be the most ideal flow condicondi-tions to use. A recent study has shown success by using patient-specific blood-flow information collected from phase-contrast MR imaging to perform hemodynamic simulations.18 However, obtaining sufficient aneurysm cases with patients’ intracranial vessel ge-ometry and flow information is technically challenging. One of our future tasks will be collecting patient-specific inflow information to incorporate into the hemodynamic simulation to test our findings.
In this study, we used the 6-region method to study hemo-dynamic properties and showed that it was a comparable and more computationally efficient approach in comparison with results collected from the entire aneurysm dome and parent artery. This data-collection method is a useful tool to reduce the amount of data and accelerate the data-collection process, which is suitable for larger case numbers. However, this is just one way to perform data analysis, and efforts to improve the analysis methods for various aneurysms are still needed to develop accurate and efficient hemodynamic analysis tools for studies including a large number of cases. In this study, we analyzed the hemodynamic value at the peak of systole as our first step to study aneurysms at different locations. Further study comparing the entire cardiac cycle with patient-specific flow profiles will be needed to study whether hemodynamic differences among locations change during the course of the cardiac cycle.
The current analysis still used hemodynamic simulation focused on a particular segment of the artery. Because asym-metric effects may be important to aneurysms within the circle of Willis,39future studies with the simulation incorporating the entire circle of Willis will facilitate in-depth understanding of the influence of location, especially lateral influence.
Conclusions
On the basis of the results of this study, our hypothesis is that aneurysmal hemodynamic properties may vary according to location. Consideration of hemodynamic variation among locations may be needed when studying aneurysm hemo-dynamics, such as aneurysm natural history or aneurysm rupture. Further study of aneurysm locations with more cases
Fig 5.AandB, Validation study comparing the hemodynamic results by using 6 regions
[image:5.594.56.286.45.425.2]and incorporation of factors such as sex and medical history are needed to test this hypothesis.
References
1. Schievink WI.Intracranial aneurysms. N Engl J Med1997;336:28 – 40 2.Unruptured intracranial aneurysms: risk of rupture and risks of surgical
in-tervention—International Study of Unruptured Intracranial Aneurysms In-vestigators.N Engl J Med1998;339:1725–33
3. Wiebers DO, Whisnant JP, Huston J 3rd, et al.Unruptured intracranial aneurysms: natural history, clinical outcome, and risks of surgical and endo-vascular treatment.Lancet2003;362:103–10
4. Wermer MJ, van der Schaaf IC, Algra A, et al.Risk of rupture of unruptured intracranial aneurysms in relation to patient and aneurysm characteristics: an updated meta-analysis.Stroke2007;38:1404 –10
5. Brisman JL, Song JK, Newell DW.Cerebral aneurysms. N Engl J Med2006; 355:928 –39
6. Hassan T, Timofeev EV, Saito T, et al.A proposed parent vessel geometry-based categorization of saccular intracranial aneurysms: computational flow dynamics analysis of the risk factors for lesion rupture. J Neurosurg
2005;103:662– 80
7. Ingebrigtsen T, Morgan MK, Faulder K, et al.Bifurcation geometry and the presence of cerebral artery aneurysms.J Neurosurg2004;101:108 –13 8. San Millan Ruiz D, Yilmaz H, Dehdashti AR, et al. The perianeurysmal
environment: influence on saccular aneurysm shape and rupture.AJNR Am J Neuroradiol2006;27:504 –12
9. Burleson AC, Strother CM, Turitto VT.Computer modeling of intracranial saccular and lateral aneurysms for the study of their hemodynamics. Neuro-surgery1995;37:774 – 82, discussion 782– 84
10. Tateshima S, Murayama Y, Villablanca JP, et al.Intraaneurysmal flow dynam-ics study featuring an acrylic aneurysm model manufactured using a comput-erized tomography angiogram as a mold.J Neurosurg2001;95:1020 –27 11. Steinman DA, Milner JS, Norley CJ, et al.Image-based computational
simula-tion of flow dynamics in a giant intracranial aneurysm.AJNR Am J Neuro-radiol2003;24:559 – 66
12. Jou LD, Quick CM, Young WL, et al.Computational approach to quantifying hemodynamic forces in giant cerebral aneurysms.AJNR Am J Neuroradiol
2003;24:1804 –10
13. Shojima M, Oshima M, Takagi K, et al.Magnitude and role of wall shear stress on cerebral aneurysm: computational fluid dynamic study of 20 middle cere-bral artery aneurysms.Stroke2004;35:2500 – 05
14. Cebral JR, Castro MA, Burgess JE, et al.Characterization of cerebral aneu-rysms for assessing risk of rupture by using patient-specific computational hemodynamics models.AJNR Am J Neuroradiol2005;26:2550 –59
15. Cebral JR, Castro MA, Appanaboyina S, et al.Efficient pipeline for image-based patient-specific analysis of cerebral aneurysm hemodynamics: technique and sensitivity.IEEE Trans Med Imaging2005;24:457– 67
16. Shojima M, Oshima M, Takagi K, et al.Role of the bloodstream impacting force and the local pressure elevation in the rupture of cerebral aneurysms.
Stroke2005;36:1933–38
17. Castro MA, Putman CM, Cebral JR.Patient-specific computational fluid dy-namics modeling of anterior communicating artery aneurysms: a study of the sensitivity of intra-aneurysmal flow patterns to flow conditions in the carotid arteries.AJNR Am J Neuroradiol2006;27:2061– 68
18. Boussel L, Rayz V, McCulloch C, et al.Aneurysm growth occurs at region of
low wall shear stress: patient-specific correlation of hemodynamics and growth in a longitudinal study.Stroke2008;39:2997–3002. Epub 2008 Aug 7 19. Castro MA, Putman CM, Cebral JR.Computational fluid dynamics modeling
of intracranial aneurysms: effects of parent artery segmentation on intra-aneurysmal hemodynamics.AJNR Am J Neuroradiol2006;27:1703– 09 20. Castro MA, Putman CM, Cebral JR.Patient-specific computational modeling
of cerebral aneurysms with multiple avenues of flow from 3D rotational angiography images.Acad Radiol2006;13:811–21
21. Cebral JR, Castro MA, Soto O, et al.Blood-flow models of the circle of Willis from magnetic resonance data.Journal of Engineering Mathematics2003;47: 369 – 86
22. Cebral JR, Lohner R.Efficient simulation of blood flow past complex endo-vascular devices using an adaptive embedding technique.IEEE Trans Med Imaging2005;24:468 –76
23. Cebral JR, Lohner R, Choyke PL, et al.Merging of intersecting triangulations for finite element modeling.J Biomech2001;34:815–19
24. Cebral JR, Summers RM.Tracheal and central bronchial aerodynamics using virtual bronchoscopy and computational fluid dynamics.IEEE Trans Med Imaging2004;23:1021–33
25. Cebral JR, Yim PJ, Lohner R, et al.Blood flow modeling in carotid arteries with computational fluid dynamics and MR imaging.Acad Radiol2002;9:1286 –99 26. Cebral JR, Castro M, Putman CM, et al.Flow–area relationship in internal carotid and vertebral arteries.Physioll Meas2008;29:585–94. Epub 2008 May 7 27. Yim P, Demarco K, Castro MA, et al.Characterization of shear stress on the wall of the carotid artery using magnetic resonance imaging and computa-tional fluid dynamics.Stud Health Technol Inform2005;113:412– 42 28. Reneman RS, Arts T, Hoeks AP.Wall shear stress: an important determinant
of endothelial cell function and structure—in the arterial system in vivo. Dis-crepancies with theory.J Vasc Res2006;43:251– 69
29. Chien A, Tateshima S, Castro M, et al.Patient-specific flow analysis of brain aneurysms at a single location: comparison of hemodynamic characteristics in small aneurysms.Med Biol Eng Comput2008;46:1113–20
30. Conover WJ.Practical Nonparametric Statistics.New York: Wiley; 1999 31. Zamir M.The Physics of Pulsatile Flow.New York: Springer-Verlag; 2000 32. Ohshima T, Miyachi S, Hattori K, et al.Risk of aneurysmal rupture: the
impor-tance of neck orifice positioning-assessment using computational flow simu-lation.Neurosurgery2008;62:767–73, discussion 773–75
33. Malek AM, Alper SL, Izumo S.Hemodynamic shear stress and its role in ath-erosclerosis.JAMA1999;282:2035– 42
34. Gibbons GH, Dzau VJ.The emerging concept of vascular remodeling.N Engl J Med1994;330:1431–38
35. Cheng C, Tempel D, van Haperen R, et al.Atherosclerotic lesion size and vulnerability are determined by patterns of fluid shear stress.Circulation
2006;113:2744 –53
36. Papaioannou TG, Karatzis EN, Vavuranakis M, et al.Assessment of vascular wall shear stress and implications for atherosclerotic disease.Int J Cardiol
2006;113:12–18
37. Kataoka K, Taneda M, Asai T, et al.Structural fragility and inflammatory response of ruptured cerebral aneurysms: a comparative study between rup-tured and unruprup-tured cerebral aneurysms.Stroke1999;30:1396 – 401 38. Frosen J, Piippo A, Paetau A, et al.Remodeling of saccular cerebral artery
aneurysm wall is associated with rupture: histological analysis of 24 unrup-tured and 42 rupunrup-tured cases.Stroke2004;35:2287–93