PHYSICS REVIEW
Theoretic Basis and Technical Implementations
of CT Perfusion in Acute Ischemic Stroke, Part 1:
Theoretic Basis
A.A. Konstas G.V. Goldmakher T.-Y. Lee M.H. Lev
SUMMARY:CT perfusion (CTP) is a functional imaging technique that provides important information about capillary-level hemodynamics of the brain parenchyma and is a natural complement to the strengths of unenhanced CT and CT angiography in the evaluation of acute stroke, vasospasm, and other neurovascular disorders. CTP is critical in determining the extent of irreversibly infarcted brain tissue (infarct “core”) and the severely ischemic but potentially salvageable tissue (“penumbra”). This is achieved by generating parametric maps of cerebral blood flow, cerebral blood volume, and mean transit time.
P
art 1 of this review establishes the clinical context of CT perfusion (CTP). Next, a discussion follows on CTP map construction by using the maximal slope method and the 2 main deconvolution techniques, Fourier transformation (FT) and singular value decomposition (the latter being the most commonly used numeric method in CTP). Part 2 dis-cusses the pearls and pitfalls of CTP map acquisition, postpro-cessing, and image interpretation. Issues including radiation dose⫺reduction strategies, methods of correcting arterial in-put function (AIF) delay, the effect of laterality of AIF choice, vascular pixel elimination, the importance of correct cerebral blood flow (CBF) and cerebral blood volume (CBV) threshold selection, and the selection of appropriate perfusion parame-ters for correct estimation of penumbra are addressed. The review highlights the need for validation and standardization of important CTP parameters to improve patient outcomes and to design future randomized clinical trials that will pro-vide epro-vidence for the importance of the core/penumbra “mismatch” in patient triage for recanalization therapies be-yond the current 3-hour therapeutic window for intravenous thrombolysis.Clinical Context of CTP
The management of acute ischemic stroke remains challeng-ing because there is a limited time window in which diagnosis must be made and therapy administered. Intravenous tissue plasminogen activator (tPA), to be used within 3 hours of stroke onset based on the 1995 National Institute of Neuro-logical Disorders and Stroke trial, and the Mechanical Embo-lus Removal in Cerebral Ischemia clot retrieval device, to be used within 9 hours of stroke onset, are the only treatments currently approved by the US Food and Drug Administration for acute stroke.1-8The only imaging technique currently
re-quired before intravenous tPA administration is an unen-hanced head CT, used to exclude intracranial hemorrhage (an absolute contraindication) and infarct size greater than one third of the middle cerebral artery (MCA) territory (a relative contraindication and predictor of increased hemorrhagic risk
following tPA administration).9,10The strict 3-hour
therapeu-tic window from symptom onset, delays in transportation and triage, and the multiple contraindications to tPA administra-tion, however, all limit the use of intravenous tPA to typically 3%–5% of patients admitted with ischemic stroke.11
There has been increasing interest in advanced CT and MR imaging techniques to extend the traditional anatomic applications of imaging and offer additional insights into the pathophysiology of acute stroke. A wider time-to-treatment window might be achieved in patients who demonstrate a “mismatch” in the size of the ischemic “core” of irreversibly infarcted tissue and hypoperfused “penumbra” (the severely ischemic but potentially salvageable tissue).12-14There is
in-creasing evidence that core/penumbra mismatch in some pa-tients may persist up to 12 or even 24 hours from the ischemic insult.15,16Hence, the judicious use of intravenous tPA and
endovascular therapy beyond 6 –9 hours, by using advanced imaging for patient selection, is currently under intense study.
Acute stroke imaging addresses 4 critical questions17:
● Is there hemorrhage?
● Is there intravascular thrombus that can be targeted for thrombolysis?
● Is there a core of critically ischemic irreversibly infarcted tissue?
● Is there a penumbra of severely ischemic but potentially salvageable tissue?
CTP addresses the last 2 questions, after unenhanced CT and CT angiography (CTA) have each addressed the first and the second questions, respectively. The application of CTP was first proposed as early as 1980 by Axel18; however, the CT acquisition and postprocessing systems available at that time were too slow to make CTP a practical reality.
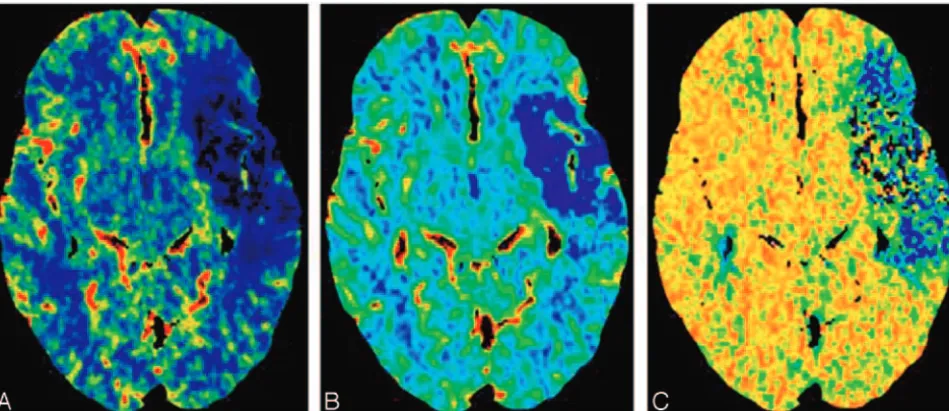
Cerebral perfusion refers to tissue (capillary)-level blood flow. Brain-tissue flow can be described by several parameters, including CBF, CBV, and mean transit time (MTT) (Fig 1). CBV is defined as the total volume of flowing blood in a given volume in the brain, with units of milliliters of blood per 100 g of brain tissue. CBF is defined as the volume of blood moving through a given volume of brain per unit time, with units of milliliters of blood per 100 g of brain tissue per minute. MTT is defined as the average transit time of blood through a given brain region, measured in seconds. “Core” is typically opera-tionally defined as the CBV lesion volume, and “penumbra,” From the Department of Radiology (A.A.K., G.V.G., M.H.L.), Massachusetts General
Hos-pital, Boston, Mass; and Imaging Research Laboratories (T.-Y.L.), Robarts Research Insti-tute, London, Ontario, Canada.
Please address correspondence to Angelos A. Konstas, MD, Department of Radiology, Massachusetts General Hospital, 55 Fruit St, Boston, MA 02114; e-mail: [email protected]
as the MTT or CBF lesion volume.17“Mismatch” is typically
defined, therefore, as the difference between these.
The list of completed and ongoing trials by using core/ penumbra mismatch as a selection criterion for treatment is long and illustrates the increasingly important role of ad-vanced imaging in acute stroke management. These trials use predefined threshold values for core and penumbra to select patients who can potentially benefit from recanalization. Completed trials include Desmoteplase in Acute Ischemic Stroke (DIAS),12Dose Escalation of Desmoteplase for Acute
Ischemic Stroke (DEDAS),19Diffusion and Perfusion Imaging Evaluation for Understanding Stroke Evolution (DEFUSE),20
the German Multicenter Trial,21 and Echoplanar Imaging
Thrombolysis Evaluation Trial (EPITHET)22; continuing
tri-als include MR and Recanalization of Stroke Clots by using Embolectomy (MR RESCUE).23CT perfusion can also be
ap-plied with nonrecanalization-based neuroprotective therapies for acute stroke.
In present clinical practice, CTP can be used to identify patients with MCA occlusion and core/penumbra mismatch for induced hypertension therapy with phenylephrine (Neo-synephrine), even beyond the thrombolysis window.24
High-flow oxygen therapy (hyperbaric or normobaric) is another promising neuroprotective strategy for which patient selec-tion with mismatch imaging may play a role.25,26Patients in
intensive care units who have undergone cardiac surgery might also benefit from CTP; a recent study reported greater sensitivity in detecting and mapping acute ischemic stroke in these patients in whom conventional imaging findings were inconsistent with the severity of clinical condition.27
Secondary cerebral infarction due to subarachnoid hemor-rhage (SAH)⫺related vasospasm is the most significant cause of mortality and morbidity following aneurysm rupture.28
Transcranial Doppler sonography, CTA, and cerebral angiog-raphy can all detect angiographic spasm, the visually apparent reduction in vessel caliber. They cannot, however, detect clin-ical spasm (the syndrome of confusion and decreased level of consciousness resulting from decreased blood flow to the
brain). CTP is more sensitive in detecting clinically relevant spasm, measured as a decrease in CBF and delay in MTT,29
than the methods used for angiographic spasm.30Several
stud-ies have demonstrated that CTP is a sensitive and early predic-tor of secondary cerebral infarction in both patients and ani-mal models with SAH-related clinical spasm.28,30-32
CTP Theory and Modeling
Comparison with MR Perfusion-Weighted Imaging CTP imaging techniques are relatively new compared with MR imaging⫺based methods; their clinical applications are, therefore, less thoroughly reported in the literature.33-35
[image:2.594.59.534.43.248.2]De-spite this, because the general principles underlying the com-putation of perfusion parameters such as CBF, CBV, and MTT are the same for both MR imaging and CT, the overall clinical applicability of perfusion imaging by using either of these techniques is similar. Differences in technique create several important distinctions, however, summarized in Table 1. The most important advantage of CTP is the linear relationship between contrast concentration and attenuation in CT, which
Table 1: Comparison of CTP with MRP imaging
CTP MRP
CTP advantages Linear relation of signal changes with contrast concentration; quantitative maps
Nonlinear relation of signal changes with gadolinium concentration; nonquantitative maps
Higher spatial resolution Lower spatial resolution More readily available Not as readily available
MRP advantages
Ionizing radiation No ionizing radiation
Limited z-direction coverage Whole-brain coverage Iodinated contrast–related
concerns
Gadolinium contrast concerns (NSF)
Complex postprocessing Less labor-intensive postprocessing
Note:—NSF indicates nephrogenic systemic fibrosis; CTP, CT perfusion; MRP, MR perfu-sion.
Fig 1.CT perfusion images obtained in a patient with acute ischemic stroke demonstrate a large perfusion defect in the left MCA distribution, with minimal CBV/MTT or CBF mismatch. A, CBF.B, CBV.C, MTT.
PHYSICS
[image:2.594.299.533.304.458.2]facilitates quantitative (versus relative) measurement of CBF and CBV. MR perfusion imaging (MRP) relies on the indirect T2* effect induced in the tissue by gadolinium; the T2* effect itself is not linearly related to the gadolinium concentration, making absolute measurement of CBF and CBV difficult. One disadvantage of CTP is, until recently, the relatively limited coverage, whereas MRP is capable of covering the whole brain during a single bolus injection. For making stroke-related treatment decisions, CTP coverage must be sufficient to scan the entire ischemic territory at risk of infarction.36A second
disadvantage of using CT rather than MR imaging for stroke assessment is the decreased sensitivity for detection of cerebral microbleeds compared with gradient-echo sequences. Micro-bleeds detected on T2*-weighted MR imaging, however, have been shown not to be a contraindication to thrombolysis.37
CBV Calculations
The dynamic first-pass approach to CTP measurement in-volves the intravenous administration of an intravascular con-trast agent, which is tracked with serial imaging during its first circulation through the brain tissue capillary bed. The main assumption of dynamic first-pass contrast-enhanced CTP models is that the perfusion tracer is not diffusible, neither metabolized nor absorbed by the tissue through which it traverses. This is certainly the case in a healthy human brain; however, breakdown of the blood-brain barrier (BBB) in in-fection, inflammation, or tumor adds an additional level of complexity. When extensive BBB breakdown exists, leakage of contrast material into the extravascular space results in over-estimation of CT CBV.38
The determination of cerebral perfusion by using CTP is based on examining the relationships between the arterial, tis-sue, and the venous enhancement. More specifically, tracer kinetic theory states that if one knows the input and the output of a tracer from a voxel, one can determine the volume of distribution (ie, fractional vascular volume) and the clearance rate (ie, flow per unit tissue volume).18,39,40The fractional vas-cular volume,f, is defined by the following equation:
1) f⫽ Vvasc
Vvasc⫹Vinterstitium⫹Vcells⫽ Vvasc
V ,
whereVvasc,Vinterstitium, andVcellsare the volumes occupied by
the vascular space, interstitium, and cells, respectively. If the chosen region of interest is devoid of major blood vessels, the measured change in the CT number will reflect the tissue blood pool. The contrast concentration in the tissue,Ctissue,
which is measured by the CT scanner, is smaller than the in-travascular concentration,Cvasc, by the fractionf,
2) Ctissue⫽f 䡠Cvasc.
The total amount of contrast material delivered to the tissue via the arteries is the product of the CBF times the integral of the arterial concentration,Cartery(t).According to the
conser-vation-of-mass principle, this total amount must be equal to the amount leaving the tissue, that is, the product of CBF with the integral ofCvasc(t).18Hence,
3) CBF 䡠
冕
0 T
Cartery共t兲dt⫽CBF 䡠
冕
0 TCvasc共t兲dt.
From equations 2 and 3, it follows that
4) f⫽
冕
0T
Ctissue共t兲dt
冕
0 TCartery共t兲dt
.
CBV can be calculated from equation 4 if one takes into ac-count the brain tissue attenuation,, and a correction factor,
CH, to adjust the difference between arterial and capillary he-matocrit.35,41In vivo experiments in the 1970s demonstrated
the markedly lower hematocrit in capillaries compared with arterial hematocrit42-44; hence, the introduction of theCHis required for the quantification of CBV as follows:
5) CBV⫽CH 䡠
冕
0 TCtissue共t兲dt
冕
0 TCartery共t兲dt
.
Theoretic modeling has suggested that the source images from a CTA acquisition (CTA-SI) are predominantly blood-volume⫺rather than blood-flow⫺weighted, assuming that a steady state of arterial and tissue contrast has been achieved during scan acquisition.18,35,45Coregistration and subtraction
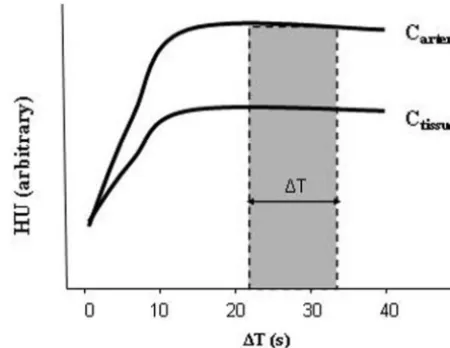
of the unenhanced head CT images from the CTA-SI should, therefore, result in quantitative CBV-weighted maps. This is appealing in clinical practice because CTA-SI subtraction maps, unlike first-pass CTP maps, can provide whole-brain coverage. The change in attenuation due to iodine administtion is directly proporadministtional to its concentraadministtion; thus, the ra-tio of the change in Hounsfield units (HU) in brain tissue (⌬HUtissue) and arterial blood (⌬HUartery) can be used in
prac-tice to estimate CBV according to the relationship of equation 5 (Fig 2). Specifically, CBV can be expressed in milliliters per Fig 2.CTA source images acquired during a steady state of contrast concentration for both the arterial and tissue⫺time-attenuation curves (⌬T) are predominantly blood-volume⫺
rather than blood-flow⫺weighted. The change in attenuation due to iodine administration is directly proportional to its concentration. CBV equals the ratio of the areas under the 2 curves, Ctissueand Carterial, respectively. This can be approximated as the ratio of the
[image:3.594.303.528.44.218.2]100 g of tissue as follows:
6) CBV⫽⌬⌬HUtissue
HUartery 䡠
Vvoxel 䡠 N,
whereVvoxelis voxel volume andNis the calculated number of
voxels in 100 g of tissue.45
Although a relative steady state of tissue arterial contrast could be assumed with the multidetector row CT (MDCT) injection protocols used in the 1990s and early 2000s, in which low contrast-injection rates were applied with relatively long prep delay times (typically 3 mL/s, and⬎25 seconds),45this
steady-state assumption no longer holds in this era of newer faster MDCT CTA protocols, such as those used in 64-section scanners, in which injection ratesⱕ7 mL/s and short prep delay times of 15–20 seconds change the temporal shape of the time-attenuation infusion curve, eliminating a near steady state during the timing of the CTA-SI acquisition. Hence, with the current implementation of CTA protocols on faster state-of-the-art MDCT scanners, the CTA-SI maps have become more flow-weighted than volume-weighted.
Mathematic Models for CBF and MTT Calculation The 2 major mathematic approaches involved in calculating CBF and MTT are the deconvolution- and nondeconvolu-tion-based methods. Deconvolution techniques are techni-cally more demanding and involve more complicated and time-consuming processing, whereas nondeconvolution tech-niques are more straightforward but depend on simplified as-sumptions regarding the underlying vascular architecture. As a result, the interpretation of studies based on nondeconvolu-tion methods may be less reliable in some situanondeconvolu-tions, though this has not been fully clinically validated.
Nondeconvolution-Based Models
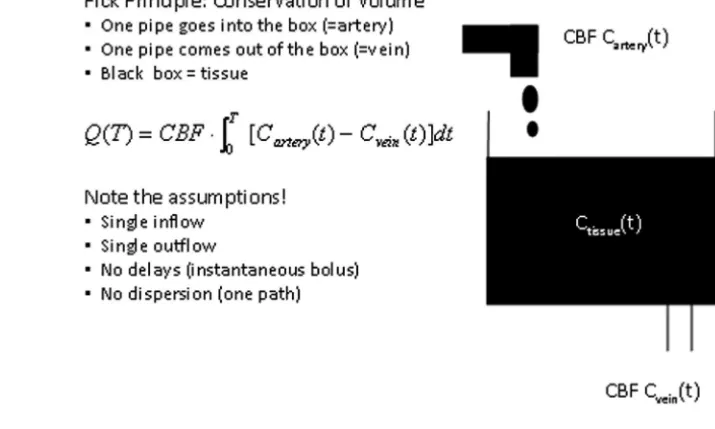
Like deconvolution methods, nondeconvolution methods are based on the application of the Fick principle of conservation of mass to a given region of interest within the brain paren-chyma (Fig 3). The accumulated mass of contrast,Q(T), in a voxel of brain tissue during a time period corresponding to
the complete wash in and wash out of contrast during a bolus injection (with a saline “chaser”) is equal to the product of CBF and the time integral of the arteriovenous difference in contrast concentration:
7) Q共T兲⫽CBF䡠
冕
0 T
关Cartery共t兲⫺Cvein共t兲兴dt.
One immediate simplification that would make solving this equation less computationally intensive is to assume that dur-ing the above time period, the venous concentration is zero (ie, no contrast has yet reached the venous side of the circulation, the “no venous outflow” assumption). This assumption is valid only whenTis⬍4 – 6 seconds, the minimum transit time of blood through the brain. Under this assumption, equation 7 can be simplified as follows:
8) Q共T兲⫽CBF䡠
冕
0 T
Cartery共t兲dt.
This is known as the Mullani-Gould formulation or single-compartment formulation.46
When rewriting equation 8 into its derivative form for eas-ier calculation of CBF,
9)
冋
dQ共t兲dt
册
t⫽T⫽CBF䡠Cartery共T兲,it follows that the rate of contrast accumulation will peak when the arterial concentration is maximal:
10)
冋
dQ共t兲dt
册
Max⫽CBF䡠关Cartery共t兲兴Max. [image:4.594.97.455.50.265.2]ues. A very high rate of contrast agent injection, however, is required—typically at least 10 mL/s—to satisfy the no-ve-nous-outflow assumption.47,48 These rates cannot be
rou-tinely achieved in clinical practice. The no-venous-outflow as-sumption is clearly an oversimplification, and this method yields relative, rather than absolute, perfusion measurements, making interpatient or interinstitutional comparison of re-sults difficult.
Deconvolution-Based Models
Considering a bolus of contrast tracer material injected into a tissue voxel of interest, we can define the concentration
Ctissue(t) of tracer in the tissue in terms of 2 functions:
1) Residue function,R(t): a fraction of tracer is still present in the voxel of interest at timetfollowing an ideal instanta-neous unit bolus injection.R(t) is unitless and is equal to 1 at
t⫽049;
2) AIF,Cartery(t): concentration of tracer in the feeding
ves-sel to the voxel of interest at timet.
Calculation of CBF requires measurement of the temporal shape of both the arterial input and the tissue⫺ time-attenua-tion curves.40,50The true input into the tissue voxel of interest
cannot be measured directly; in practice, the AIF is estimated from a major artery (eg, the MCA or the “top” of the internal carotid artery), with the assumption that this represents the exact input to the tissue of interest. Any delay or dispersion of the bolus introduced during its passage from the artery used for AIF estimation to the tissue of interest will introduce errors in quantification of CBF.51,52
The observed tissue⫺time-attenuation curve represents a combination of the effects of the AIF and the inherent tissue properties. Thus, to fit the model, the effects of the AIF on the tissue concentration curve must be removed by using a math-ematic process known as “deconvolution” to derive R(t), which is dependent only on the hemodynamic properties of the voxel under consideration.R(t)demonstrates an abrupt (indeed instantaneous) rise, a plateau of duration equal to the minimum transit time through the tissue of interest and then decay toward baseline. It was shown by Meier and Zieler53that
the tissue concentration curve can be represented as the CBF multiplied by AIF convolved withR(t):
11) Ctissue共t兲⫽
CH 䡠 CBF 䡠 关AIF共t兲丢R共t兲兴
⫽
CH 䡠 CBF 䡠
冕
t
AIF共兲R共t⫺兲d,
where “R” is the convolution operator,is the brain tissue
attenuation, andCHis the correction factor for the capillary hematocrit levels.CtissueandAIFare measured directly from
the time-attenuation curve from the cine CTP source images, and the problem then becomes the calculation ofCBFand
R(t). Several methods to “deconvolve” equation 11 and hence solve forCBFandR(t)have been proposed and are divided into 2 main categories. With parametric methods, a specific analytic expression forR(t)is assumed. Assuming a specific shape forR(t) imposes assumptions on the inherent tissue properties that cannot be known a priori with sufficient pre-cision.50,54,55Due to this limitation, the most commonly used
methods have become the nonparametric ones, which do not assume a shape forR(t).
Deconvolution of equation 11 is unstable, in the sense that it frequently yields nonphysiologic oscillations (ie, noise) in the computation of the solution forR(t). The nonparametric approach can be further subdivided in 2 categories, which dif-fer in the way in which they deal with noise resulting from the instability of deconvolution.56In the first, the transform
ap-proach, the convolution theorem of the FT is used to devolve equation 11. The theorem states that the FT of the con-volution of 2 time-domain functions is equivalent to the multiplication of their respective FTs.50,57,58With the
convo-lution theorem, equation 11 can be rewritten as
12) R共t兲⫽ 1
CBF䡠ℑ
⫺1
再
ℑ关Ctissue共t兲兴ℑ关AIF共t兲兴
冎
,whereℑis the Fourier transform.R(t)andCBFcan thus be determined by taking the inverse FT of the ratios of the 2 transforms of the sampledAIF(t)andCtissue(t). However, this
approach is very sensitive to noise, as demonstrated by Oster-gaard et al.55
The second approach, the more commonly applied singu-lar value decomposition (SVD), is an algebraic reformulation of the convolution integrals of equation 11 rewritten as
13) ⌬t
冢
AIF共t1兲AIF共t2兲
䡠 䡠 䡠
AIF共tN兲
0
AIF共t1兲
䡠 䡠 䡠
AIF共tN⫺1兲
䡠 䡠 䡠 䡠 䡠 䡠 䡠 䡠 䡠 䡠 䡠 䡠
0 0 0
AIF共t1兲
冣
䡠
冢
R共t1兲
R共t2兲
䡠 䡠 䡠
R共tN兲
冣
⫽
冢
Ctissue共t1兲
Ctissue共t2兲
䡠 䡠 䡠
Ctissue共tN兲
冣
,
wheret1,t2,…tNare equally spaced time points andAIF(t)and
Ctissue(t)are measured. Equation 13 can be rewritten in
short-hand matrix-vector notation:
14) A 䡠 b⫽c,
where b and c are vectors whose elements are R(ti) and Ctissue(ti), respectively, and A is the convolution matrix in
equation 13. It can be shown that the least squares solution for
bis given by (AT䡠A)⫺1䡠AT, where ATis the transpose of the
convolution matrix and (AT䡠A)⫺1is the inverse of the
sym-metric matrix AT䡠A.59SVD decomposes A into a product of matrices, such that (AT䡠A)⫺1 can be found easily and the
solution forbcan be written as a sum of terms weighted by the reciprocal of the singular values ofA.60By truncating small
singular values in the sum for the solution vectorb, oscillations from noise in the bothAIF(t)andCtissue(t)are avoided.
SVD has yielded the most robust results from all the decon-volution methods used to map CBF55and has gained
wide-spread acceptance. The creation of accurate quantitative maps of CBF, CBV, and MTT by using deconvolution methods has been validated in a number of studies.61-67Once CBF and CBV
are known, MTT can be calculated from the ratio of CBV and CBF, by using the central volume theorem.53,68
AIF(t).Image-coregistration software to correct for patient motion and careful choice of regions of interest for the AIF can minimize these pitfalls.
Commercial software suppliers use different mathematic methods. In the past, some have incorporated the maximum slope method, though new versions are frequently released and the reader is advised to check for the most up-to-date software from each vendor. Others have typically used decon-volution techniques, which, though theoretically superior to nondeconvolution methods—as has already and will again to be noted—the full clinical implication of using has yet to be established and standardized by the stroke imaging community.
Validation of CTP
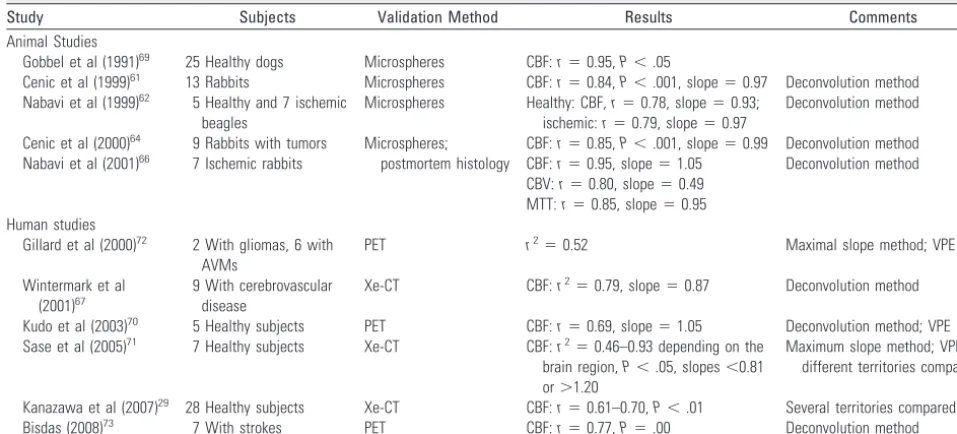
CBF quantification with CTP has been preliminarily tested in animals and humans. In animals, the accepted reference standard method for quantifying CBF is the microsphere technique and, to a lesser extent, postmortem histology. CTP measurements have been validated in healthy animals, animals with experimental ischemic stroke, and animals with implanted tumors.61,62,64,66,69
All studies reported very good correlation between CTP and the reference-standard methods (Table 2). In humans, CTP has been validated with positron-emission tomography and xenon-en-hanced CT in healthy subjects, patients with acute stroke, and patients with chronic cerebrovascular disease. Some of these studies are summarized in Table 2. Deconvolution-based CTP studies by Wintermark et al67and Kudo et al70gave slopes within 13% of unity, whereas the difference from unity was 20%– 60% for the maximum slope technique used by Sase et al (2005).71These results once again suggest a superior accuracy
of deconvolution techniques compared with maximum slope⫺based methods.
References
1.Tissue plasminogen activator for acute ischemic stroke: The National Insti-tute of Neurological Disorders and Stroke rt-PA Stroke Study Group.N Engl J Med1995;333:1581– 87
2. Furlan A, Higashida R, Wechsler L, et al.Intra-arterial prourokinase for acute ischemic stroke: The PROACT II study—a randomized controlled trial. Pro-lyse in Acute Cerebral Thromboembolism.JAMA1999;282:2003–11 3. Marler JR, Tilley BC, Lu M, et al.Early stroke treatment associated with better
outcome: the NINDS rt-PA stroke study.Neurology2000;55:1649 –55 4. del Zoppo GJ, Poeck K, Pessin MS, et al.Recombinant tissue plasminogen
activator in acute thrombotic and embolic stroke.Ann Neurol1992;32:78 – 86 5. Hacke W, Kaste M, Fieschi C, et al.Intravenous thrombolysis with recombi-nant tissue plasminogen activator for acute hemispheric stroke: The Euro-pean Cooperative Acute Stroke Study (ECASS).JAMA1995;274:1017–25 6. Gobin YP, Starkman S, Duckwiler GR, et al.MERCI 1: a phase 1 study of
Me-chanical Embolus Removal in Cerebral Ischemia.Stroke2004;35:2848 –54. Epub 2004 Oct 28
7. Katz JM, Gobin YP.Merci retriever in acute stroke treatment.Expert Rev Med Devices2006;3:273– 80
8. Smith WS, Sung G, Starkman S, et al.Safety and efficacy of mechanical embo-lectomy in acute ischemic stroke: results of the MERCI trial.Stroke2005;36: 1432–38
9. Phan TG, Donnan GA, Koga M, et al.The ASPECTS template is weighted in favor of the striatocapsular region.Neuroimage2006;31:477– 81. Epub 2006 Feb 28
10. Phan TG, Donnan GA, Koga M, et al.Assessment of suitability of thrombolysis in middle cerebral artery infarction: a proof of concept study of a stereologi-cally-based technique.Cerebrovasc Dis2007;24:321–27. Epub 2007 Aug 9 11. Schumacher HC, Bateman BT, Boden-Albala B, et al.Use of thrombolysis in
acute ischemic stroke: analysis of the Nationwide Inpatient Sample 1999 to 2004.Ann Emerg Med2007;50:99 –107. Epub 2007 May 3
12. Hacke W, Albers G, Al-Rawi Y, et al.The Desmoteplase in Acute Ischemic Stroke Trial (DIAS): a phase II MRI-based 9-hour window acute stroke thrombolysis trial with intravenous desmoteplase.Stroke2005;36:66 –73 13. Mehta N, Lev MH, Mullins ME, et al.Prediction of final infarct size in acute
stroke using cerebral blood flow/cerebral blood volume mismatch: added value of quantitative first pass CT perfusion imaging in successfully treated versus unsuccessfully treated/untreated patients.In:Proceedings of the 41st Annual Meeting of the American Society of Neuroradiology,Washington, DC. April 28-May 2, 2003.
14. Murphy BD, Fox AJ, Lee DH, et al.Identification of penumbra and infarct in acute ischemic stroke using computed tomography perfusion-derived blood flow and blood volume measurements.Stroke2006;37:1771–77
15. Darby DG, Barber PA, Gerraty RP, et al.Pathophysiological topography of acute ischemia by combined diffusion-weighted and perfusion MRI.Stroke 1999;30:2043–52
16. Neumann-Haefelin T, Wittsack HJ, Wenserski F, et al.Diffusion- and perfu-sion-weighted MRI: the DWI/PWI mismatch region in acute stroke.Stroke 1999;30:1591–97
17. Shetty SK, Lev MH.CT perfusion in acute stroke.Neuroimaging Clin N Am 2005;15:481–501, ix
18. Axel L.Cerebral blood flow determination by rapid-sequence computed to-mography.Radiology1980;137:679 – 86
[image:6.594.51.530.57.274.2]19. Furlan AJ, Eyding D, Albers GW, et al.Dose Escalation of Desmoteplase for
Table 2: Animal and human studies validating CTP
Study Subjects Validation Method Results Comments
Animal Studies
Gobbel et al (1991)69 25 Healthy dogs Microspheres CBF:r⫽0.95,P⬍.05
Cenic et al (1999)61 13 Rabbits Microspheres CBF:r⫽0.84,P⬍.001, slope⫽0.97 Deconvolution method Nabavi et al (1999)62 5 Healthy and 7 ischemic
beagles
Microspheres Healthy: CBF,r⫽0.78, slope⫽0.93; ischemic:r⫽0.79, slope⫽0.97
Deconvolution method
Cenic et al (2000)64 9 Rabbits with tumors Microspheres; postmortem histology
CBF:r⫽0.85,P⬍.001, slope⫽0.99 Deconvolution method
Nabavi et al (2001)66 7 Ischemic rabbits CBF:r⫽0.95, slope⫽1.05 Deconvolution method
CBV:r⫽0.80, slope⫽0.49 MTT:r⫽0.85, slope⫽0.95 Human studies
Gillard et al (2000)72 2 With gliomas, 6 with AVMs
PET r2⫽0.52 Maximal slope method; VPE
Wintermark et al (2001)67
9 With cerebrovascular disease
Xe-CT CBF:r2⫽0.79, slope⫽0.87 Deconvolution method
Kudo et al (2003)70 5 Healthy subjects PET CBF:r⫽0.69, slope⫽1.05 Deconvolution method; VPE
Sase et al (2005)71 7 Healthy subjects Xe-CT CBF:r2⫽0.46–0.93 depending on the
brain region,P⬍.05, slopes⬍0.81 or⬎1.20
Maximum slope method; VPE; different territories compared
Kanazawa et al (2007)29 28 Healthy subjects Xe-CT CBF:r⫽0.61–0.70,P⬍.01 Several territories compared
Bisdas (2008)73 7 With strokes PET CBF:r⫽0.77,P⫽.00 Deconvolution method
Acute Ischemic Stroke (DEDAS): evidence of safety and efficacy 3 to 9 hours after stroke onset.Stroke2006;37:1227–31
20. Albers GW, Thijs VN, Wechsler L, et al.Magnetic resonance imaging profiles predict clinical response to early reperfusion: the diffusion and perfusion im-aging evaluation for understanding stroke evolution (DEFUSE) study.Ann Neurol2006;60:508 –17
21. Thomalla G, Schwark C, Sobesky J, et al.Outcome and symptomatic bleeding complications of intravenous thrombolysis within 6 hours in MRI-selected stroke patients: comparison of a German multicenter study with the pooled data of ATLANTIS, ECASS, and NINDS tPA trials.Stroke2006;37:852–58 22. Davis SM, Donnan GA, Parsons MW, et al.Effects of alteplase beyond 3 h after
stroke in the Echoplanar Imaging Thrombolytic Evaluation Trial (EPITHET): a placebo-controlled randomised trial.Lancet Neurol2008;7:299 –309 23. Davis SM, Donnan GA, Butcher KS, et al.Selection of thrombolytic therapy
be-yond 3 h using magnetic resonance imaging.Curr Opin Neurol2005;18:47–52 24. Bogoslovsky T, Happola O, Salonen O, et al.Induced hypertension for the
treatment of acute MCA occlusion beyond the thrombolysis window: case report.BMC Neurol2006;6:46
25. Singhal AB.A review of oxygen therapy in ischemic stroke. Neurol Res 2007;29:173– 83
26. Singhal AB, Benner T, Roccatagliata L, et al.A pilot study of normobaric oxygen therapy in acute ischemic stroke.Stroke2005;36:797– 802
27. Bisdas S, Therapidis P, Kerl JM, et al.Value of cerebral perfusion computed tomography in the management of intensive care unit patients with suspected ischaemic cerebral pathology after cardiac surgery.Eur J Cardiothorac Surg 2007;32:521–26
28. Niikawa S, Yasokawa Y, Ito T.Development of early cerebral swelling in sur-gically treated ruptured aneurysm of acute stage, its significance, and man-agement.J Stroke Cerebrovasc Dis2005;14:58 – 66
29. Kanazawa R, Kato M, Ishikawa K, et al.Convenience of the computed tomog-raphy perfusion method for cerebral vasospasm detection after subarachnoid hemorrhage.Surg Neurol2007;67:604 –11
30. Pham M, Johnson A, Bartsch AJ, et al.CT perfusion predicts secondary cere-bral infarction after aneurysmal subarachnoid hemorrhage. Neurology 2007;69:762– 65
31. Nabavi DG, LeBlanc LM, Baxter B, et al.Monitoring cerebral perfusion after subarachnoid hemorrhage using CT.Neuroradiology2001;43:7–16 32. Laslo AM, Eastwood JD, Pakkiri P, et al.CT perfusion-derived mean transit
time predicts early mortality and delayed vasospasm after experimental sub-arachnoid hemorrhage.AJNR Am J Neuroradiol2008;29:79 – 85
33. Roberts HC, Roberts TP, Dillon WP.CT perfusion flow assessment: “up and coming” or “off and running”?AJNR Am J Neuroradiol2001;22:1018 –19 34. Hamberg LM, Hunter GJ, Halpern EF, et al.Quantitative high resolution
mea-surement of cerebrovascular physiology with slip-ring CT.AJNR Am J Neuro-radiol1996;17:639 –50
35. Hamberg LM, Hunter GJ, Kierstead D, et al.Measurement of cerebral blood volume with subtraction three-dimensional functional CT.AJNR Am J Neu-roradiol1996;17:1861– 69
36. Schaefer PW, Barak ER, Kamalin S, et al.Quantitative assessment of core/ penumbra mismatch in acute stroke: CT and MR perfusion imaging are strongly correlated when sufficient brain volume is imaged.Stroke2008;39: 2986 –92. Epub 2008 Aug 21
37. Fiehler J, Albers GW, Boulanger JM, et al.Bleeding risk analysis in stroke imaging before thrombolysis (BRASIL): pooled analysis of T2*-weighted magnetic resonance imaging data from 570 patients.Stroke2007;38:2738 – 44. Epub 2007 Aug 23
38. Roberts HC, Roberts TP, Brasch RC, et al.Quantitative measurement of mi-crovascular permeability in human brain tumors achieved using dynamic contrast-enhanced MR imaging: correlation with histologic grade.AJNR Am J Neuroradiol2000;21:891–99
39. Zierler KL.Equations for measuring blood flow by external monitoring of radioisotopes.Circ Res1965;16:309 –21
40. Zierler KL.Theoretical basis of indicator-dilution methods for measuring flow and volume.Circ Res1962;10:393– 407
41. Calamante F, Thomas DL, Pell GS, et al.Measuring cerebral blood flow using magnetic resonance imaging techniques.J Cereb Blood Flow Metab1999;19: 701–35
42. Lipowsky HH, Kovalcheck S, Zweifach BW.The distribution of blood rheo-logical parameters in the microvasculature of cat mesentery.Circ Res 1978;43:738 – 49
43. Klitzman B, Duling BR.Microvascular hematocrit and red cell flow in resting and contracting striated muscle.Am J Physiol1979;237:H481–90
44. Phelps ME, Grubb RL Jr, Ter-Pogossian MM.In vivo regional cerebral blood vol-ume by x-ray fluorescence: validation of method.J Appl Physiol1973;35:741– 47 45. Hunter GJ, Hamberg LM, Ponzo JA, et al.Assessment of cerebral perfusion and
arterial anatomy in hyperacute stroke with three-dimensional functional CT: early clinical results.AJNR Am J Neuroradiol1998;19:29 –37
46. Mullani NA, Gould KL.First-pass measurements of regional blood flow with external detectors.J Nucl Med1983;24:577– 81
47. Miles KA.Measurement of tissue perfusion by dynamic computed tomogra-phy.Br J Radiol1991;64:409 –12
48. Klotz E, Konig M.Perfusion measurements of the brain: using the dynamic CT for the quantitative assessment of cerebral ischemia in acute stroke.Eur J Radiol1999;30:170 – 84
49. Lee TY.Scientific basis and validation.In: Miles KA, Eastwood JD, Konig M, eds.Multidetector Computed Tomography in Cerebrovascular Disease.Abingdon, UK: Informa Healthcare; 2007:13–27
50. Ostergaard L, Weisskoff RM, Chesler DA, et al.High resolution of cerebral blood flow using intravascular tracer bolus passages. Part I. Mathematical approach and statistical analysis.Magn Reson Med1996;36:715–25 51. Calamante F, Gadian DG, Connelly A.Delay and dispersion effects in dynamic
susceptibility contrast MRI: simulations using singular value decomposition. Magn Reson Med2000;44:466 –73
52. Calamante F, Gadian DG, Connelly A.Quantification of perfusion using bolus tracking magnetic resonance imaging in stroke: assumptions, limitations, and potential implications for clinical use.Stroke2002;33:1146 –51 53. Meier P, Zieler K.On the theory of the indicator-dilution method for
measure-ment of blood flow and volume.J Appl Physiol1954;6:731– 44
54. Lassen NA.Cerebral transit of an intravascular tracer may allow measure-ment of regional blood volume but not regional blood flow.J Cereb Blood Flow Metab1984;4:633–34
55. Ostergaard L, Sorensen AG, Kwong KK, et al.High resolution measurement of cerebral blood flow using intravascular tracer bolus passages. Part II. Exper-imental comparison and preliminary results.Magn Reson Med 1996;36: 726 –36
56. Lee T, Blake M.Implementing deconvolution analysis for perfusion CT.In: Miles KA, Eastwood JD, Konig, M, eds.Multidetector Computed Tomography in Cerebrovascular Disease.Abingdon, UK: Informa Healthcare; 2007:29 – 45 57. Gobbel GT, Fike JR.A deconvolution method for evaluating
indicator-dilu-tion curves.Phys Med Biol1994;39:1833–54
58. Rempp KA, Brix G, Wenz F, et al.Quantification of regional cerebral blood flow and volume with dynamic susceptibility contrast-enhanced MR imaging. Radiology1994;193:637– 41
59. Farebrother RW.Linear Least Squares Computations.New York: Marcel Dekker; 1988
60. Lawson CL, Hanson, RJ.Solving Least Squares Problems.Philadelphia: SIAM; 1995 61. Cenic A, Nabavi DG, Craen RA, et al.Dynamic CT measurement of cerebral
blood flow: a validation study.AJNR Am J Neuroradiol1999;20:63–73 62. Nabavi DG, Cenic A, Craen RA, et al.CT assessment of cerebral perfusion:
experimental validation and initial clinical experience.Radiology1999;213: 141– 49
63. Wirestam R, Andersson L, Ostergaard L, et al.Assessment of regional cerebral blood flow by dynamic susceptibility contrast MRI using different deconvo-lution techniques.Magn Reson Med2000;43:691–700
64. Cenic A, Nabavi DG, Craen RA, et al.A CT method to measure hemodynamics in brain tumors: validation and application of cerebral blood flow maps. AJNR Am J Neuroradiol2000;21:462–70
65. Nabavi DG, Cenic A, Dool J, et al.Quantitative assessment of cerebral hemo-dynamics using CT: stability, accuracy, and precision studies in dogs.J Com-put Assist Tomogr1999;23:506 –15
66. Nabavi DG, Cenic A, Henderson S, et al.Perfusion mapping using computed tomography allows accurate prediction of cerebral infarction in experimental brain ischemia.Stroke2001;32:175– 83
67. Wintermark M, Thiran JP, Maeder P, et al.Simultaneous measurement of regional cerebral blood flow by perfusion CT and stable xenon CT: a valida-tion study.AJNR Am J Neuroradiol2001;22:905–14
68. Stewart GN.Researches on the circulation time in organs and on the influ-ences which affect it.J Physiol1894;15:1
69. Gobbel GT, Cann CE, Iwamoto HS, et al.Measurement of regional cerebral blood flow in the dog using ultrafast computed tomography: experimental validation.Stroke1991;22:772–79
70. Kudo K, Terae S, Katoh C, et al.Quantitative cerebral blood flow measurement with dynamic perfusion CT using the vascular-pixel elimination method: comparison with H2(15)O positron emission tomography.AJNR Am J Neu-roradiol2003;24:419 –26
71. Sase S, Honda M, Machida K, et al.Comparison of cerebral blood flow between perfusion computed tomography and xenon-enhanced computed tomogra-phy for normal subjects: territorial analysis. J Comput Assist Tomogr 2005;29:270 –77
72. Gillard JH, Minhas PS, Hayball MP, et al.Assessment of quantitative computed tomographic cerebral perfusion imaging with H2(15)O positron emission to-mography.Neurol Res2000;22:457– 64