Met Éireann
Technical Note No. 65
The MÉRA Data Archive
Eoin Whelan, John Hanley, Emily Gleeson
Disclaimer
Although every effort has been made to ensure the accuracy of the material contained in this pub-lication, complete accuracy cannot be guaranteed. Neither Met Éireann nor the author accept any responsibility whatsoever for loss or damage occasioned or claimed to have been occasioned, in part or in full, as a consequence of any person acting, or refraining from acting, as a result of a matter contained in this publication. All or part of this publication may be reproduced without further per-mission, provided the source is acknowledged.
c
Met Éireann 2017
ISSN 1393-905X
Title:The MÉRA Data Archive
Authors:Eoin Whelan1,*, John Hanley1, Emily Gleeson1
1Met Éireann, Dublin, Ireland
Contents
1 Introduction 1
2 Reanalysis Data 1
2.1 Model grid definition . . . 1
2.2 Product definition . . . 1
2.3 Archive structure . . . 2
3 Output Parameters 3
4 Observations Feedback 6
1
Introduction
This document describes the data produced by the Met Éireann reanalysis project called MÉRA (Met Éireann ReAnalysis). MÉRA is a very high resolution reanalysis of Ireland’s climate covering the period 1981-2015 and is continuing in real time. Outputs are updated on a monthly basis once ERA-Interim data have been released.
The MÉRA project began in late 2014 in order to produce a high quality, high resolution climate reanalysis of the Irish climate. The MÉRA reanalysis system uses the HARMONIE-AROME 38h1.2 configuration of the shared ALADIN-HIRLAM Numerical Weather Prediction System (AHNS). This version of AHNS was released in December 2014. Production of reanalysis data for the period 1981-2015 completed in February 2017. The MÉRA reanalysis project is documented in Gleeson et al. (2017) and Whelan et al. (2017).
MÉRA products described in this technical report include:
• Analysis and forecast fields from the atmospheric model at or near the surface
• Analysis and forecast fields from the atmospheric model on levels at fixed heights above the model surface
• Analysis and forecast fields from the atmospheric model on standard pressure levels
• Analysis and forecast fields from the atmospheric model at the nominal model top
• Vertical integrations of analysis and forecast fields from the atmospheric model
• Analysis and forecast fields from the surface model
• Observation feedback information from surface and upper-air data assimilation
2
Reanalysis Data
2.1
Model grid definition
The MÉRA atmospheric model is configured to run using the following grid definitions:
• The domain projection is a Lambert conformal conic grid with the domain centre at (53.5◦ N, 7.5◦ W) the reference latitude at 53.5◦ N and the reference longitude at 5.0◦ E.
• The limited area domain has 540 grid-points in the x-direction and 500 grid-points in the y -direction. An 11-point extension zone is required by the model leaving a computational domain of 529 grid-points in thex-direction and 489 grid-points in they-direction.
• The domain has a horizontal grid-spacing of 2.5 km at the centre of the domain.
• The atmospheric model is defined on 65 vertical levels with a model top of 10 hPa.
The model domain is centred over the island of Ireland and covers Ireland, the United Kingdom and an area of northern France. The domain is the same as has been used operationally by Met Éireann since 2011.
2.2
Product definition
The MÉRA production suite uses a three-hour forecast cycle with surface and upper-air data assim-ilation. Three-hour forecasts are produced for each cycle except midnight (00 Z) when a 33-hour forecast is produced. This provides a long forecast each day and is used for the purpose of producing
consistent precipitation forecasts. A data assimilation window of 90 minutes is used for each analysis so that the 12:00 UTC analysis uses observations made between 10:30 UTC and 13:30 UTC.
WMO (World Meteorological Organization) FM92 GRIB Edition 1 (WMO, 1994) is used to represent all analysis and forecast fields. All MÉRA GRIB 1 data are encoded using Met Éireann’s local version of table 2 version number 253.
2.3
Archive structure
Currently all MÉRA data are stored in a flat file structure on ECMWF’s Data Handlng System (ECFS). A subset of the data are available for external users to download.
As already mentioned, MÉRA analysis and forecast gridded data are encoded in GRIB 1 format. The data for each parameter are gathered into monthly files using the following naming convention:
MERA_PRODYEAR_YYYY_MM_IOP_TYP_LEV_TRI_STR
• YYYY: Year (%Y, four-digits, e.g. 2015)
• MM: Month (%m, two-digits, e.g. 01 January, 02 February, ...)
• IOP: Indicator Of Parameter (indicatorOfParameter); e.g. 11 indicates temperature
• ITL: Indicator of Type of Level (indicatorOfTypeOfLevel), see Table 1
• LEV: Level indicator (level); depends on ITL value
• TRI: Time range indicator (timeRangeIndicator), see Table 2
• STR: MÉRA data stream, see Table 3
For example the file named MERA_PRODYEAR_2015_12_11_105_2_0_ANALYSIS contains anal-yses from December 2015 of temperature at 2 m above ground.
ITL Description
5 Level of adiabatic condensation lifted from the surface 8 Nominal top of atmosphere
20 Isothermal level 100 Isobaric surface
103 Specified altitude above mean sea level 105 Specified height level above ground 111 Depth at or below land surface
200 Entire atmosphere (considered as a single layer)
Table 1: List of level types (indicatorOfTypeOfLevel) used in MÉRA GRIB 1
TRI Description
0 Instantaneous 2 Specific time period 4 Accumulation
Table 2: List of time-range indicators (timeRangeIndicator) used in MÉRA GRIB 1
STR Description
ANALYSIS Analysis output at 00 Z, 03 Z, 06 Z, . . . , 21 Z FC3hr 1-, 2- and 3-hour forecast data
FC33hr 1- to 33-hour forecasts from each 00 Z cycle
Table 3: List of MÉRA data streams
3
Output Parameters
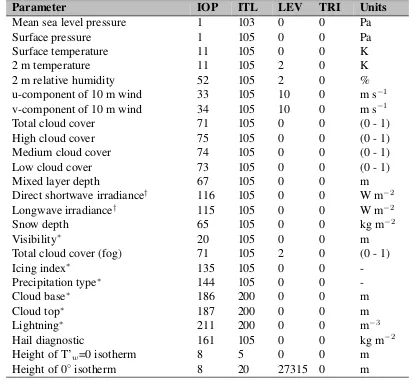
[image:6.595.90.503.321.702.2]MÉRA analyses and forecasts produce 221 parameters that are archived on a monthly basis. The ma-jority of MÉRA output data are produced directly by the forecast model usingFULL-POS(ECMWF, 2013) software which is included in AHNS. Some parameters are produced usinggl, an external for-mat conversion, interpolation and post-processing tool also available in AHNS. Parameters produced byglare indicated by an asterisk in the parameter tables in the following sub-sections.
Table 4 lists the instantaneous (time-range indicator equal to 0) parameters produced by the atmo-spheric model available at or near the surface:
Parameter IOP ITL LEV TRI Units
Mean sea level pressure 1 103 0 0 Pa
Surface pressure 1 105 0 0 Pa
Surface temperature 11 105 0 0 K
2 m temperature 11 105 2 0 K
2 m relative humidity 52 105 2 0 %
u-component of 10 m wind 33 105 10 0 m s−1
v-component of 10 m wind 34 105 10 0 m s−1
Total cloud cover 71 105 0 0 (0 - 1)
High cloud cover 75 105 0 0 (0 - 1)
Medium cloud cover 74 105 0 0 (0 - 1)
Low cloud cover 73 105 0 0 (0 - 1)
Mixed layer depth 67 105 0 0 m
Direct shortwave irradiance† 116 105 0 0 W m−2
Longwave irradiance† 115 105 0 0 W m−2
Snow depth 65 105 0 0 kg m−2
Visibility∗ 20 105 0 0 m
Total cloud cover (fog) 71 105 2 0 (0 - 1)
Icing index∗ 135 105 0 0
-Precipitation type∗ 144 105 0 0
-Cloud base∗ 186 200 0 0 m
Cloud top∗ 187 200 0 0 m
Lightning∗ 211 200 0 0 m−3
Hail diagnostic 161 105 0 0 kg m−2
Height of T’w=0 isotherm 8 5 0 0 m
Height of 0◦isotherm 8 20 27315 0 m
Table 4: List of instantaneous surface and single level parameters. †This parameter is named incor-rectly in ECMWF GRIB definitions.
Table 5 lists the accumulated (time-range indicator equal to 4) parameters produced by the
spheric model available at or near the surface. All accumulations are initiated at the start of each forecast and are valid at the forecast step indicated in the data.
Parameter IOP ITL LEV TRI Units
Total precipitation 61 105 0 4 kg m−2
Rain 181 105 0 4 kg m−2
Snow 184 105 0 4 kg m−2
Graupel 201 105 0 4 kg m−2
Sensible heat flux 122 105 0 4 J m−2
Latent heat flux of evaporation 132 105 0 4 J m−2 Latent heat flux of sublimation 244 105 0 4 J kg−1
Water evaporation 245 105 0 4 kg m−2
Snow sublimation 246 105 0 4 kg m−2
Net shortwave irradiance† 111 105 0 4 J m−2 Net longwave irradiance† 112 105 0 4 J m−2 Direct shortwave irradiance† 116 105 0 4 J m−2
Longwave irradiance† 115 105 0 4 J m−2
Global irradiance† 117 105 0 4 J m−2
Direct normal irradiance 140 105 0 4 J m−2
[image:7.595.100.501.110.373.2]Momentum flux, v-component 125 105 0 4 N m−2 Momentum flux, u-component 124 105 0 4 N m−2
Table 5: List of accumulated surface parameters. †This parameter is named incorrectly in ECMWF GRIB definitions.
Table 6 lists parameters that are valid over a specified period of time (time-range indicator equal to 2) produced by the atmospheric model at or near the surface. All such parameters are valid for the pre-vious forecast hour; e.g. the maximum temperature at forecast hour 24 is the maximum temperature between hours 23 and 24. These parameters are reset each hour by the forecast model.
Parameter IOP ITL LEV TRI Units
Maximum temperature 15 105 2 2 K
Minimum temperature 16 105 2 2 K
Gust, u-component 162 105 10 2 m s−1
Gust, v-component 163 105 10 2 m s−1
[image:7.595.96.498.636.725.2]Table 6: List of surface level parameters valid for a fixed period of time
Table 7 lists parameters that are available at the top of the atmosphere.
Parameter IOP ITL LEV TRI Units
Direct shortwave irradiance† 116 8 0 4 J/m2
Net shortwave irradiance† 113 8 0 0 J/m2
Net shortwave irradiance† 113 8 0 4 J/m2
Net longwave irradiance† 114 8 0 0 J/m2
Net longwave irradiance† 114 8 0 4 J/m2
Table 7: List of parameters at top of atmosphere. †This parameter is named incorrectly in ECMWF GRIB definitions.
Table 8 lists the upper air parameters that are available at 12 heights above the surface: 30, 50, 60, 70, 80, 90, 100, 125, 150, 200, 300 and 400 m.
Parameter IOP ITL LEV TRI Units
Temperature 11 105 LLL 0 K
U-component of wind 33 105 LLL 0 m s−1
V-component of wind 34 105 LLL 0 m s−1
Relative humidity 52 105 LLL 0 %
Table 8: List of upper-air parameters available on levels above the surface
The gl post-processing package produces pseudo-satellite products as described in Tijm (2004). The pseudo-satellite parameters available in the MÉRA data archive are listed in Table 9.
Parameter IOP ITL LEV TRI Units
Cloud top temperature (IR)∗ 136 105 0 0 K
Tb (WV)∗ 137 105 0 0 K
Tb (WV) + cld corr∗ 138 105 0 0 K
Cloud water reflectivity (VIS)∗ 139 105 0 0 -Table 9: Pseudo-satellite products
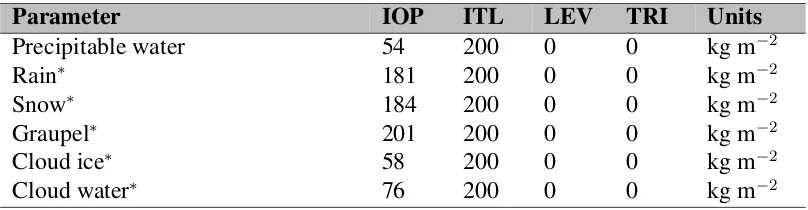
Parameters that are vertically integrated through the model atmosphere are listed in Table 10.
Parameter IOP ITL LEV TRI Units
Precipitable water 54 200 0 0 kg m−2
Rain∗ 181 200 0 0 kg m−2
Snow∗ 184 200 0 0 kg m−2
Graupel∗ 201 200 0 0 kg m−2
Cloud ice∗ 58 200 0 0 kg m−2
[image:8.595.96.500.404.509.2]Cloud water∗ 76 200 0 0 kg m−2
Table 10: Vertically integrated parameters
Upper-air data are available on 13 pressure levels. Table 11 lists the upper-air parameters that are available at the following pressure levels: 100, 200, 300, 400, 500, 600, 700, 800, 850, 900, 925, 950 and 1000 hPa.
Parameter IOP ITL LEV TRI Units
Geopotential 6 100 PPP 0 m2s−2
Temperature 11 100 PPP 0 K
U-component of wind 33 100 PPP 0 m s−1
V-component of wind 34 100 PPP 0 m s−1
Vertical velocity 40 100 PPP 0 m s−1
Relative humidity 52 100 PPP 0 %
Cloud ice 58 100 PPP 0 kg m−2
[image:8.595.98.498.604.736.2]Cloud water 76 100 PPP 0 kg m−2
Table 11: List of upper-air parameters available on pressure levels.
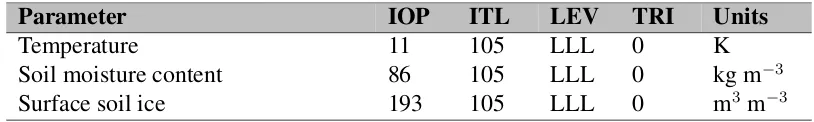
Table 12 lists the parameters produced by the surface model available at or below the ground. For temperature level 800 is used for surface temperature and 801 for deep soil temperature. For soil moisture and ice, level 800 is used for the surface, 801 for root level and 802 for deep soil.
Parameter IOP ITL LEV TRI Units
Temperature 11 105 LLL 0 K
Soil moisture content 86 105 LLL 0 kg m−3
Surface soil ice 193 105 LLL 0 m3m−3
Table 12: Surface model parameters
4
Observations Feedback
Observations feedback from MÉRA OI (surface) and 3D-Var analyses are archived at Met Éireann. These data are made available in ODB-2 format, a flat file format with modern API used at ECMWF for storing observations and observation feedback data. MÉRA feedback data are gathered in yearly files using the following naming convention:
strODBTYYYY.odb
• str: data assimilation - "3dv" for 3D-Var or "can" for surface OI.
• ODBT: observation databaseECMAorCCMA. See Saarinen (2004) for more details.
• YYYY: Year (%Y, four-digits, e.g. 2015).
5
Product Access
The datasets are archived at Met Éireann. There is currently a 1-month sample of some of the data available to external users at http://www.met.ie/climate-ireland/mera.asp
Table 13 lists some suggested software packages for working with MÉRA data.
Package format web
ecCodes GRIB https://software.ecmwf.int/wiki/display/ECC/ CDO GRIB https://code.mpimet.mpg.de/projects/cdo/ NCL GRIB https://www.ncl.ucar.edu/
ODB-API ODB https://software.ecmwf.int/wiki/display/ODBAPI
Table 13: Suggested software packages for usnig MÉRA data
The full dataset was published on 26th May 2017 under the creative commons Attribution 4.0 Interna-tional (CC BY 4.0) license, which means the data will be free to share and adapt for any purpose. Any use of the data will require attribution. To register for updates on full release e-mail [email protected]
References
ECMWF (2013). Part VI: Technical and Computational Procedures. IFS Documentation CY38R1. ECMWF.
Gleeson, E., Whelan, E., and Hanley, J. (2017). Met Éireann High Resolution Reanalysis for Ireland.
Adv. Sci. Res., 14:49–61.
Saarinen, S. (2004). ODB User Guide. ECMWF.
Tijm, S. (2004). Hirlam pseudo satellite images. HIRLAM Newsletter, (46):59–64.
Whelan, E., Gleeson, E., and Hanley, J. (2017). MÉRA paper. Q.J.R. Meteorol. Soc., In preparation.
WMO (1994). Guide to WMO Binary Code Forms: Part 1: Guide to FM94 BUFR. Part 2: Guide to FM92 GRIB. Technical Report 17, WMO.