Changes in soil free-living nematode communities
and their trophic composition along a climatic
gradient
Tal Levi*, Chen Sherman*, Stanislav Pen-Mouratov, Yosef Steinberger#
The Mina & Everard Goodman Faculty of Life Sciences, Bar-Ilan University, Ramat-Gan, Israel;
#
Corresponding Author: [email protected]
Received 6 February 2012; revised 11 March 2012; accepted 24 March 2012
ABSTRACT
Ambiguity exists concerning the effects of cli-mate on soil nematode-community composition. In this study, we examined the free-living nema- tode communities in soil along a climatic gra-dient representing humid-Mediterranean, Medi-terranean, semi-arid, and arid climate types. The relationships between abiotic soil characteris-tics (organic carbon, soil moisture (SM), wa-ter-holding capacity) and nematode parameters, such as abundance, trophic group composition, and diversity indices, were explored in the con-text of climate and seasonality. Nematode abun- dance was lowest at the arid site. At the humid- Mediterranean and Mediterranean locations, ne- matode abundance reached its peak in winter, while at the semi-arid and arid sites, an almost opposite trend was observed, with lowest abun- dances in winter, presumably due to a nutrient washout from the soil profile during the rainy season. On the trophic level, one trophic group demonstrated a positive correlation with SM and one trophic group demonstrated a negative one at each location, while the other two groups re-mained constant. Fungi-feeding nematodes were found to be unaffected by SM at the humid- Mediterranean and Mediterranean locations, while at the semi-arid and arid sites their proportion increased in correlation with decreasing SM. Bacteria-feeders increased with SM at the arid site, were unaffected at the semi-arid location, and decreased with SM at the humid-Mediter- ranean and Mediterranean sites. Plant-parasites were associated with SM only at the humid- Mediterranean site. Omnivores-predators were positively affected by SM at the two middle lo-cations, staying constant at the humid-Medi- terranean and arid sites. These findings point to
the strong linkage existing between nematode trophic behavior and climatic factors, demon-strating distinctive communal fingerprints for each climate type.
Keywords:Climate Gradient; Diversity; Soil
Nematode; Trophic Group
1. INTRODUCTION
The biological component of soil acts as a highly complex entity of flora and fauna embedded in the soil physical matrix, and controlled by a highly complex yet firm ecological consistency. The soil milieu enables the existence of a large diversity of underground organisms: microflora (bacteria and fungi), microfauna (protozoa), mesofauna (nematodes and arthropods), etc. Most of these organisms inhabit the 0 - 30 cm soil layer, in the spaces between soil particles where the soil moisture and organic matter are available [1]. Although many studies have investigated soil biotic communities, including the interactions between them, many unsolved questions remained unanswered [2].
Soil free-living nematodes are known to be one of the most abundant multicellular organisms among all soil organisms [3,4]. They are common in both terrestrial and aquatic ecosystems in all climates, even in the most ex-treme environments, where water availability is very low [5,6]. Such ecophysiological adaptation is possible due to their ability to shift between activity and “anhydrobiosis” stages in wet versus dry (extreme) seasons [7]. Moreover, nematodes are ubiquitous due to their belonging to vari-ous trophic groups: plant-parasites, bacteria-, fungi- and algae-feeders, or omnivores-predators [4]. In natural eco-systems, the soil free-living nematode community com-position, size, and level of activity are influenced by abiotic factors (e.g., soil temperature and moisture, the amount of organic matter, and pH), and food resources [8].
Due to their high occurrence, diversity, belonging to a wide range of trophic levels, and sensitivity to abiotic alterations, the soil free-living nematode community can be used as bioindicators of environmental changes asso-ciated with ecological processes. This, in addition to the relatively extensive knowledge and data available on nematode taxonomy and feeding habits compared to other organisms in the mesofauna [3], renders them as one of the most efficient bioindicators [9-13].
Despite all the advantages of using soil free-living nematodes as bioindicators of soil quality, the effect of climate change (temporal and spatial scale) on nematode communities (e.g., density, trophic group composition, etc) remained unclear. However, the recent publication of Gray et al. [14] on the effect of climate change on a soil microbial community has exposed the limited potential to predict changes in soil communities based on a single factor, such as CO2 elevation. Since the microbial com-munities are an integral component of the soil milieu, changes in their abundance will be followed by changes in both composition and functions of other soil biotic components. According to Kardol et al. [15], an increase in the total microbial community obtained in dry ambient temperature resulted in an opposite trend in bacteria- feeding nematodes.
The objective of this study was to examine the effect of a climatic gradient that included four distinct ecosys-tems, ranging from humid-Mediterranean to a desert sys- tem, along a 245 km stretch, on soil free-living nematode community abundance and trophic group composition. The main difference between the study sites was in the total mean multiannual rainfall and the temperature ranges [16]. Based on the above knowledge, we hypothesized
that soil moisture availability, longer duration of water availability, and smaller temperature span on a temporal and spatial scale will increase the density of a soil free- living nematode community and will probably favor some trophic groups over others.
2. MATERIALS AND METHODS
2.1. Gradient Characterization, Site Descriptions, and Sampling Design
Sampling was conducted at four sites located along a 245-km-long climatic gradient stretching the length of Israel from north to south. Environmental conditions at these sites represent humid-Mediterranean, Mediterra-nean, semi-arid, and arid climate types. The basic climate in the region is Mediterranean, characterized by rainy winters (October-April) and prolonged rainless summers. The plant-growing season commences soon after the first rains, between October and December. The plant commu-nities at the four study sites were found to differ strongly in their species composition [17].
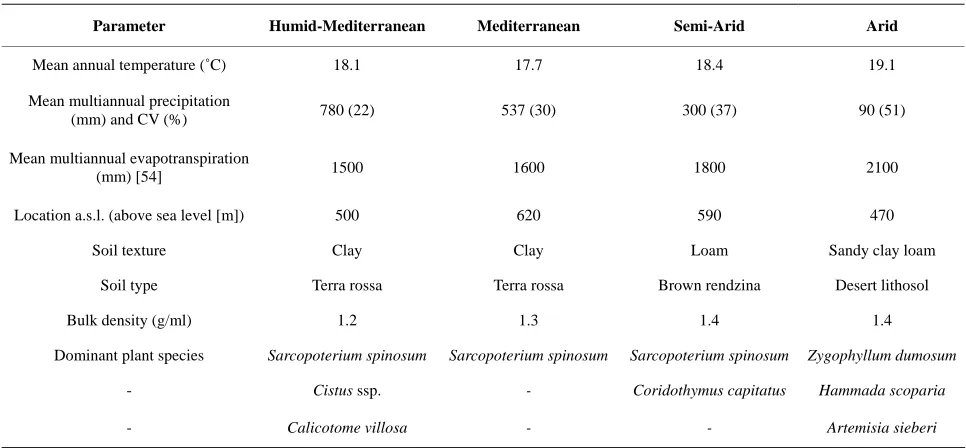
[image:2.595.56.539.513.737.2]The humid-Mediterranean (HM) site (N33˚0' E35˚14') is located in the northern Galilee Mountains at an eleva-tion of 500 m above sea level (a.s.l.), on montmorillonitic terra rossa soil [18]. Average annual rainfall amounts are up to 780 mm, with 20% inter-annual variation, and the mean annual temperature is 18.1˚C. Vegetation varies from closed oak maquis e.g., Quercus calliprinos Webb, to more open garrigue dominated by shrubs of Sarcopo-terium spinosum (L.) Spach, Cistus ssp., and Calicotome villosa (Poiret). Herbaceous vegetation, mainly com-posed of annuals, coexists with shrubs [17] (Table 1).
Table 1. Abiotic parameters, location, soil parameters, and plant dominance at each study site along the climatic gradient. Rainfall coefficient of variance (CV) is presented as a percentage [53].
Arid Semi-Arid
Mediterranean Humid-Mediterranean
Parameter
19.1 18.4
17.7 18.1
Mean annual temperature (˚C)
90 (51) 300 (37)
537 (30) 780 (22)
Mean multiannual precipitation (mm) and CV (%)
2100 1800
1600 1500
Mean multiannual evapotranspiration (mm) [54]
470 590
620 500
Location a.s.l. (above sea level [m])
Sandy clay loam Loam
Clay Clay
Soil texture
Desert lithosol Brown rendzina
Terra rossa Terra rossa
Soil type
1.4 1.4
1.3 1.2
Bulk density (g/ml)
Zygophyllum dumosum Sarcopoterium spinosum
Sarcopoterium spinosum Sarcopoterium spinosum
Dominant plant species
Hammada scoparia Coridothymus capitatus
-Cistus ssp.
-
Artemisia sieberi
-Calicotome villosa
The Mediterranean (M) site (N31˚42' E35˚3') is lo-cated at 620 m a.s.l., on terra rossa [18]. Average annual rainfall is 537 mm, with 22% inter-annual variation, and the mean annual temperature is 17˚C. Vegetation is domi- nated by shrubs of Sarcopoterium spinosum (L.) Spach and large numbers of herbaceous (mostly annual) plant species [17] (Table 1).
The semi-arid (SA) site (N31˚23' E34˚54') is located at 590 m a.s.l., on light brown rendzina [18]. Average annual rainfall is 300 mm, with 25% inter-annual varia-tion, and the mean annual temperature is 18.4˚C. Vegeta-tion is dominated by dwarf shrubs of Sarcopoterium spinosum (L.) Spach and Coridothymus capitatus (L.) associated with herbaceous (chiefly annual) plants [17] (Table 1).
The arid (A) site (N30˚52' E34˚46') is situated at the Negev Desert plateau at an elevation of 470 m a.s.l., on desert lithosol [18]. Average annual rainfall is 90 mm, with 430% inter-annual variation, and the mean annual temperature is 19.1˚C. The open vegetation of this site is dominated by small shrubs, such as Zygophyllum dumo-sum Boiss., Hammada scoparia (Pomel), Artemisia sieberi Besser, and sparsely growing desert annuals and geophytes [19] (Table 1).
All sampling sites were located on: 1) south-facing slopes, in order to minimize inter-site differences in access to light; 2) over calcareous bedrocks, thus conferring fairly invariable pH (around 8.3; soil:H2O ratio of 1:2); and 3) at similar elevations (470-620 m a.s.l.).
Gradient soils are classified as clay at the humid- Mediterranean and Mediterranean locations, loam at the semi-arid location, and sandy clay loam at the arid loca-tion.
Samples were collected from the open spaces between perennial plants. Four soil samples were taken randomly from each site across the slope (0 - 10 cm soil layer) using a soil auger (10 cm diameter). Data obtained were or-ganized according to seasons: winter, spring, summer, and autumn. Sampling was conducted for a period of 3 years when, in the first two years (from December 2005 to November 2007), the samples were collected on a monthly basis. During the last year, the samples were taken seasonally, with a single representative month in each season (winter was represented by January; spring by April; summer by July, and autumn by October. The soil samples were collected in the early morning hours, stored in individual plastic bags, and kept in a cooler in order to prevent their heating until arrival at the labora-tory. Upon arrival at the laboratory, the soil samples were sieved (<2 mm) in order to remove root fragments and other organic debris, and kept at 4˚C until biotic and abiotic analyses.
2.2. Laboratory Analysis
2.2.1. Soil Characterization
2.2.1.1. Abiotic Parameters
Moisture content was determined gravimetrically by drying soil samples for 24 h at 105˚C [20]. For the de-termination of the soil water-holding capacity (WHC), 100 g soil samples were flooded with tap water in a bot-tom-perforated vessel for five minutes. The WHC was inferred from the amount of residual water remaining following infiltration of gravitational water. In the cur-rent study, we treated soil moisture as a fraction of the WHC (SMWHC), thus forming a new concept reflecting soil water availability that is more adequate for biologi-cal activity assessments [21].
Total organic-carbon (TOC) content was determined by oxidation with 1 N potassium dichromate in an acidic medium, according to Rowell [22].
2.2.1.2. Biotic Parameters
The nematode population was determined by extrac-tion from 100 g fresh soil samples using the Baermann funnel procedure [8,23]. The recovered organisms were counted using a compound microscope and preserved in formalin. The nematodes from each sample were col-lected and classified according to known feeding habitats or stoma and esophageal morphology [8,24]. The total number of nematodes (Tnem) was recalculated and ex-pressed as the number of individuals per 100 g dry soil.
The individuals in each sample were assigned to 4 tro-phic groups according to Yeates et al. [4]: bacteria-feed- ers (BF); fungi-feeders (FF); plant-parasites (PP); omni-vores-predators (OP); and to colonizer-persister groups based on Bongers [25]. In the current study, we chose to particularly relate to the proportion of each group instead of the absolute number, for better comparison between the different nematode communities.
All data were processed using the following indices:
FB (FF/BF): The F/B ratio reflects the structure of the microflora community, which is known to be the primary decomposers directly affecting organic matter decompo-sition and nutrient cycling [26]. Bacteria-based food ex-hibits higher decomposition rates than fungi-based webs [27]. According to previous studies the F/B ratio values ranged between 0.1 and 0.52 [28-30].
Trophic diversity (TD): 1 2
i
P
describes the tro- phic group distribution. Communities dominated by one trophic group are characterized by low values of T and vice versa, where 1 2i
T
P and Pi is the proportionof the ith trophic group in the nematode community [31].
Simpson’s dominance index ():
Pi2 [33,34].2.3. Statistics
All data were subjected to statistical analysis of vari-ance using the SAS model (ANOVA, Duncan’s multiple range test, and Pearson correlation coefficient), and were used to evaluate differences between separate means. ANOVA was followed by Tukey’s HSD test to establish the significance of differences between plot areas using the statistical package Statistica 4.3. Differences obtained at levels of P < 0.05 were considered significant.
3. RESULTS
3.1. Abiotic Parameters
The mean total annual rainfall during the 3-year study period at the humid-Mediterranean, Mediterranean, and semi-arid locations (616, 442, and 200 mm, respectively), was 21%, 18%, and 33%, respectively, lower than the multiannual average (Table 1). This is in contrast to an addition of 11% above the average at the arid site (100
mm) that was found for this three-year period.
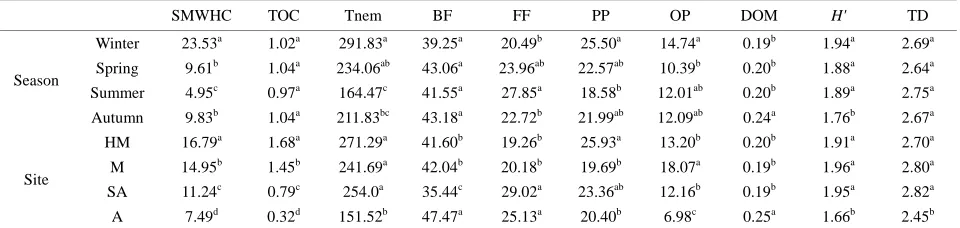
Using SMWHC allowed us to compare between the sites during the study period in order to evaluate changes in moisture availability as a function of soil holding ca-pacity. The results presented in Figure 1 reflect seasonal-ity changes in the mean values of the four sites along the gradient. This figure illustrates the gradual decrease in SMWHC at each site—HM, M, SA, and A, where the highest values were obtained in the winter season (29.2%, 28.84%, 23.86%, and 13.96%, respectively) followed by a continuous decline in spring (13.62%, 10.6%, 7.48%, and 8.2%, respectively) and summer (6.91%, 5.87%, 4.3%, and 2.91%, respectively), followed by a significant increase (P < 0.0001; Figure 1) in the autumn samples (15.36%, 13.76%, 6.96%, and 3.81% respectively), with the exception of the arid sampling site, where the SMWHC remained similar to that of the summer season. The over-all SMWHC on a three-year period on a season basis exhibited significant differences (P < 0.001) (Table 2), and a gradual and significant (P < 0.0001) decrease be-tween the sites along the climate gradient was obtained, where HM > M > SA > A site (Table 2).
0 5 10 15 20 25 30 35 40 45
H.M M S.A A
SM
W
H
C (
%
a
b b
c a
b b
c a
b b
c a
b
c
SM
W
H
C (
%)
0 0.5 1 1.5 2 2.5
H.M M S.A A
TO
C
(
%
a a
ab a ab
b
ba bab
TO
C
[image:4.595.64.536.361.506.2](%)
Figure 1. Water availability (SMWHC) and total organic-carbon (TOC) content at the various study locations (H.M = humid-Medi- terranean, M = Mediterranean, S.A = semi-arid, and A = arid) during the study period (3-year means). Pattern designation for seasons:
= Winter, = Spring, = Summer, = Autumn. Error bars show the standard error of the mean (n = 4). Different letters rep-resent significant differences (P < 0.05) between seasons at each site.
Table 2. Duncan grouping analysis of soil samples collected in different seasons and sampling sites along the climatic gradient for the parameters: soil moisture (SMWHC—%), total organic carbon (TOC—%), total number of nematodes (Tnem), bacteria-feeders (BF), fungi-feeders (FF), plant-parasites (PP), omnivores-predators (OM), Simpson’s dominance index (dom), Shannon-Weaver in-dex (H'), and trophic diversity (TD), during the study period. Different letters represent significant differences (P < 0.05) between seasons and sampling sites (each parameter separately).
SMWHC TOC Tnem BF FF PP OP DOM H' TD
Winter 23.53a 1.02a 291.83a 39.25a 20.49b 25.50a 14.74a 0.19b 1.94a 2.69a
Spring 9.61b 1.04a 234.06ab 43.06a 23.96ab 22.57ab 10.39b 0.20b 1.88a 2.64a Summer 4.95c 0.97a 164.47c 41.55a 27.85a 18.58b 12.01ab 0.20b 1.89a 2.75a Season
Autumn 9.83b 1.04a 211.83bc 43.18a 22.72b 21.99ab 12.09ab 0.24a 1.76b 2.67a HM 16.79a 1.68a 271.29a 41.60b 19.26b 25.93a 13.20b 0.20b 1.91a 2.70a
M 14.95b 1.45b 241.69a 42.04b 20.18b 19.69b 18.07a 0.19b 1.96a 2.80a SA 11.24c 0.79c 254.0a 35.44c 29.02a 23.36ab 12.16b 0.19b 1.95a 2.82a Site
[image:4.595.59.539.622.736.2]Soil TOC levels were found to show a pattern similar to soil moisture at the different sites corresponding to the climate gradient, i.e., HM > M >> SA >> A site, with significant (P < 0.0001) differences between them (Table 2, Figure 1). The overall TOC content on a temporal basis (3 years) was found to range between 1.6% and 1.7% in the samples collected at the HM site, while a five-fold decrease in samples collected at the A site was found (Figure 1). Seasonality effect was found only at the SA and A sites, while TOC was found to reach maximal values (P < 0.001) of 0.93% and 0.38%, respec-tively, in spring (Figure 1).
3.2. Biotic Parameters
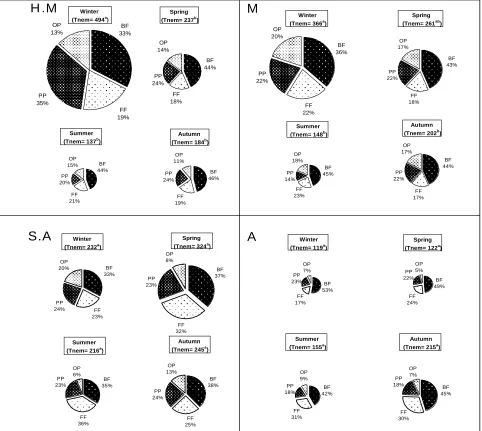
The nematode population was found to follow soil moisture availability, represented by the higher mean abundance value in the winter season, with a maximal of 494 individuals 100 g–1 dry soil at the HM study site, while over four-fold lower density was obtained at the A site for the winter season period (Figure 2). The abun-dance of the nematode population was found to change seasonally throughout the study period, demonstrating the strong and significant (P < 0.001) relationship be-tween abundance and seasonality, without dependence on sampling location along the gradient.
BF 33% FF 19% PP 35% OP 13% FF 18% BF 44% PP 24% OP 14% FF 21% PP 20% OP 15% BF 44% FF 19% PP 24% BF 46% OP 11% OP 20% PP 22% FF 22% BF 36% FF 18% PP 22% OP 17% BF 43% PP 14% OP 18% FF 23% BF 45% FF 17% PP 22% OP 17% BF 44% BF 33% FF 23% PP 24% OP 20% BF 37% FF 32% PP 23% OP 8% OP 6% BF 35% FF 36% PP 23% OP 13% BF 38% FF 25% PP 24% BF 53% PP 23% FF 17% OP 7% BF 49% PP 22% OP 5% FF 24% PP 18% BF 42% FF 31% OP 9% PP 18% OP 7% BF 45% FF 30%
H.M
M
Winter (Tnem= 232a)
Winter (Tnem= 366a)
Winter (Tnem= 119a
) Winter
(Tnem= 494a)
Summer (Tnem= 148b
) Summer
(Tnem= 137b)
Summer (Tnem= 155a
) Summer
(Tnem= 216a
)
Spring (Tnem= 122a
)
Autumn (Tnem= 245a)
Spring (Tnem= 261ab)
Spring (Tnem= 324a
) Spring (Tnem= 237b
)
Autumn (Tnem= 215a
) Autumn
(Tnem= 184b)
Autumn (Tnem= 202b
)
[image:5.595.58.540.247.678.2]A
S.A
At the HM and M locations, the average number of soil free-living nematodes in the winter season was 494 and 366 individuals, respectively, per 100 g dry soil, de-creasing more than two-fold toward the summer period to 137 and 148 individuals 100 g–1 dry soil, respectively. This pattern changed toward autumn, when a slight (but not significant) increase in density was observed, with a level of 184 and 202 individuals 100 g–1 dry soil at the HM and M sites, respectively. A positive Pearson corre-lation (P < 0.0001) was established between total free- living nematode-population density and SMWHC at these two sampling sites (HM and M) (Table 3). On the other hand, at the SA and A sites, winter and summer seasons were found to be the least favorable period for the nematode communities (232 and 119 individuals 100 g–1 dry soil in winter and 216 and 155 individuals 100 g–1 dry soil in summer for the semi-arid and arid locations, respectively) relative to spring and autumn (324 and 122 individuals 100 g–1 dry soil in winter and 245 and 215 individuals 100 g–1 dry soil in summer at the semi-arid and arid locations, respectively), although the differences between the seasons were not found to be significant (Figure 2). For the SA and A sampling sites, no signifi-cant correlation was found between SMWHC and nema-
tode abundance in contrast to the HM and M study sites (Table 3).
All sampling sites along the gradient were found to be significantly dominated (P < 0.0001) by bacteria-feeding nematodes in all seasons during the 3 years (Figure 2), representing 33% - 53% of the total nematode population. The fungi-feeding and plant-parasite nematodes followed the bacteria-feeding trophic group, with an abundance of 17% - 36% and 14% - 35%, respectively, while a higher abundance of fungi-feeding nematodes at the SA and A sites were found, representing 29% and 25% of the total density, respectively. The omnivores-predators were the least common trophic group at all locations (5% - 20%).
[image:6.595.58.545.411.739.2]It should be noted that: the HM location demonstrated a high and significant (P < 0.02) dominance of plant- parasite (P < 0.02) nematodes (26%); the M site demon-strated a significant (P < 0.01) dominance of omnivo-rous-predators; at the SA site, which may act as a transi-tion zone, the density of both fungi- and bacteria-feeders were found to significantly (P < 0004) dominate the site; while at the A site, bacteria-feeders were the dominant (P < 0.006) trophic group inhabiting the soil milieu system (Table 2).
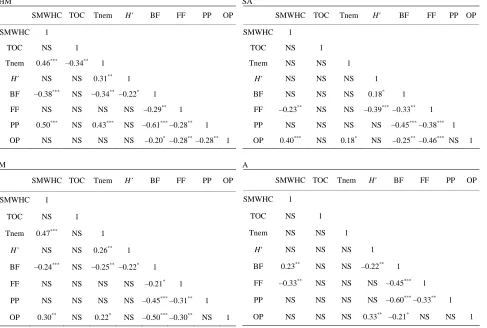
Table 3. Pearson’s correlation coefficients between the variables at the different study sites. Asterisks indicate significant correlation at probability levels of 0.05(*), 0.01(**) and 0.0001 (***); NS, not significant.
HM
SMWHC TOC Tnem H' BF FF PP OP
SMWHC 1
TOC NS 1
Tnem 0.46*** –0.34** 1
H' NS NS 0.31** 1
BF –0.38*** NS –0.34** –0.22* 1
FF NS NS NS NS –0.29** 1
PP 0.50*** NS 0.43*** NS –0.61*** –0.28** 1
OP NS NS NS NS –0.20* –0.28**–0.28** 1 SA
SMWHC TOC Tnem H' BF FF PP OP
SMWHC 1
TOC NS 1
Tnem NS NS 1
H' NS NS NS 1
BF NS NS NS 0.18* 1
FF –0.23** NS NS –0.39*** –0.33** 1
PP NS NS NS NS –0.45*** –0.38*** 1
OP 0.40*** NS 0.18* NS –0.25** –0.46*** NS 1
M
SMWHC TOC Tnem H’ BF FF PP OP
SMWHC 1
TOC NS 1
Tnem 0.47*** NS 1
H’ NS NS 0.26** 1
BF –0.24*** NS –0.25** –0.22* 1
FF NS NS NS NS –0.21* 1
PP NS NS NS NS –0.45*** –0.31** 1
OP 0.30** NS 0.22* NS –0.50*** –0.30** NS 1 A
SMWHC TOC Tnem H' BF FF PP OP
SMWHC 1
TOC NS 1
Tnem NS NS 1
H' NS NS NS 1
BF 0.23** NS NS –0.22** 1
FF –0.33** NS NS NS –0.45*** 1
PP NS NS NS NS –0.60*** –0.33** 1
Interestingly, different trophic groups were found to correlate with SMWHC at each sampling site along the gradient (Table 3). For example, at the HM location, bac-teria-feeders exhibited a negative correlation (P < 0.0001), while plant-parasites exhibited a positive correlation (P < 0.0001, R2 = 0.50428); at the M location, bacteria-feed- ers exhibited a negative correlation (P = 0.0118) and omnivores-predators—a positive correlation (P = 0.002); at the SA location, fungi-feeders exhibited a negative correlation (P = 0.013) and omnivores-predators—a positive correlation (P < 0.0001); and at the A location, fungi-feeders exhibited a negative correlation (P = 0.0003) and bacteria-feeders—a positive correlation (P = 0.0133) (Table 3).
The FB index was not found to reflect any significant temporal and spatial effects during the study period. Trophic diversity (TD) was found to be useful for the A site, where a significantly lower mean value of 2.45 was obtained, indicating a lower tendency to dominance of trophic groups (P < 0.0001) compared with the other three (HM, M, SA) sites, whose values ranged between 2.7 and 2.83 (Table 2). Differences in TD between sea-sons were found to be non-significant.
The dominance index (DOM) was found to show a relatively (P < 0.002) high value for the A site in com-parison to the other sampling sites, coupled with the ob-served trend of functional diversity (H') that showed a significantly (P < 0.01) lower value in comparison to the other sampling sites (Table 2). A similar trend was ob-served for the two indices on a seasonal basis (Table 2).
4. DISCUSSION
Our study demonstrates that climate gradient and a soil free-living nematode community at trophic-group composition and abundance level can be used as a possi-ble tool for the study of climate change. These findings are in line with the results obtained by Chen et al. [12], who found that nematodes are one of the soil communi-ties suitable as bioindicators. In their study on climate change, Kardol et al. [35] emphasized the importance of moisture as one of the components that induces shifts and affects the abundance, community composition, and structure of a microarthropod community. The climatic- gradient studied here conferred significant geographi-cally oriented trends to the levels of abiotic parameters: soil moisture, water-holding capacity, and total organic- carbon levels, which were found to gradually increase with increasing total amount of rainfall. These parame-ters were directly related to both nematode trophic-group composition and abundance, suggesting that nematode communities are strongly influenced by soil moisture availability.
As mentioned above, the abiotic parameters measured are strongly related and determined by the actual effects
of macro-climate changes (e.g. radiation, temperature, air humidity etc) which affect directly soil biota populations represented in this by soil free living nematode commu-nities. Neher et al. [36] emphasized that since climate generates differences among terrestrial zones, the soil nematode-community structure may respond considera-bly to the abiotic changes, as observed in our study sites in both nematode abundance and trophic-group composi-tion.
The present study clearly demonstrates that one of the main factors determining community size and composi-tion is SMWHC. On a climatic gradient, where total amount of rainfall and its distribution alter, the changes in SM are attributed to the WHC of soils, as presented by Oren and Steinberger [21]. The determined SMWHC elucidates soil moisture availability, which is one of most important factors determining soil biological activity, as shown by Anderson and Domsch [37], Freckman et al. [38], Whitford [7], and Berg and Steinberger [39].
In general, we found that nematode abundance at the arid location was significantly lower than in all other locations. This could be related to the relatively low SM- WHC and organic-matter content, as well as other factors, such as temperature, radiation and soil texture (i.e., [40]. Moreover, the water evaporation from pore caves of soil formations can increase the predation success of soil free-living nematodes, while daily rain increases the sur-vival potential of soil microorganisms since the predators require more time to find their prey [41]. All of these abiotic variables together create an special condition of the arid environment [7,33]. Indeed, a more specific in-fluence of water availability on the two distinct commu-nities (Mediterranean and arid) was observed: in the Mediterranean community, nematode abundance strongly depended on SMWHC on a seasonal basis while in the arid community, SMWHC did not correlate with nema-tode abundance. These results are in agreement with the uncertainties related to the traditional concept that nema-tode abundance has a positive correlation with water availability, since moisture content seems to have very small influence on nematode abundance at the arid loca-tions [8]. We assume that the arid community’s adjust-ment to the extreme habitat made them less sensitive to variations in water availability.
winter of both years compared to all other seasons. While it is understandable that in regions where annual precipi-tation is relatively high and organic matter is plentiful nematodes become more abundant as soil moisture in-creases, the trend observed at the southern locations was quite unexpected. We would assume that in soils where water content is a limiting factor, a high increase, rather than a decrease, in nematode numbers should occur after every rainfall event, when the soil moisture level is rela-tive high. Xie and Steinberger [42] measured signifi-cantly lower levels of soil organic carbon during the rainy period (November-March) compared with the rest of the year at a Negev Desert site located near the arid site investigated in the current study. Based on similar results, Oren and Steinberger [21] (who studied microbial communities at the same locations as those used in our current study) hypothesized that during the rainy season, most of the organic matter is washed by percolating rain-fall, thus reducing its concentration in soil. This could explain the decrease in the number of nematodes ob-served in winter at the arid sites, where less dense soil and poor vegetation cover makes nutrient washout easier, resulting in smaller amounts of food sources available to the nematodes. On the other hand, this community tended to flourish in spring and autumn, probably due to the fact that a large number of plants at the arid sites lose some of their leaves on a seasonal basis (winter leaves, summer leaves), usually in the spring and autumn months, thus enriching the soil with available organic matter and leading to the flourishing of microbial communities [39]. This is followed by an increase in fungi-feeding and bacteria-feeding nematodes.
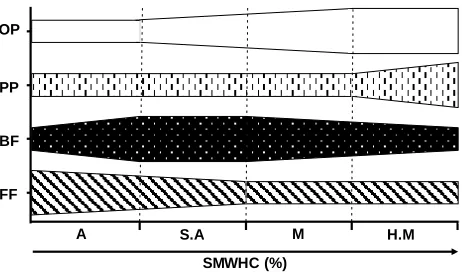
On the trophic level, at each location, one trophic group demonstrated positive correlation with SMWHC, one trophic group demonstrated a negative correlation, and the other two groups remained constant. It is well established that moisture availability acts as a trigger for changes in nematode food sources (e.g., bacteria, fungi, plants). Nonetheless, this factor has varying influences. Water availability is found to regulate the creation and germination of spores and the growth rate of the mycelia of saprophytic fungi [43]. Water content also directly regulates microbial activity in soil [44], or indirectly, by stimulating primary production and determining the car-bon contribution to the ecosystem that affects microbial diversity [45]. It is only reasonable that the nematode trophic composition will, therefore, be influenced by water availability and food source, as expressed by a specific behavior for each trophic group, in a strong association with SMWHC (Figure 3). This general model (Figure 3) illustrates the effect of increasing water availability (at each site) on trophic composition on a local scale as well as along the gradient. Fungi-feeding nematodes were found to be stable at the Mediterranean locations, unaffected by
OP
BF PP
FF
A S.A M H.M
[image:8.595.309.540.82.218.2]SMWHC (%)
Figure 3. A general model of soil free-living nematode trophic composition dynamics, as responding to soil water availability (SMWHC), along a climatic gradient (H.M = humid-Mediter- ranean, M = Mediterranean, S.A = semi-arid, and A = arid), with 3 possible conditions: relative proportion of the commu-nity increases, decreases, or remains stable. Pattern designation for trophic groups: = bacteria-feeders, = fungi-feeders,
= plant-parasites, = omnivores-predators.
changes in SMWHC, while at the arid locations, where the SMWHC was relatively low, this community in-creased its proportion in correlation with decreasing wa-ter availability [46].
Duyck et al. [47] elucidated the importance of tem-perature, rainfall, and soil type in relation to the abun-dance of nematode population, showing that trophic- group composition is related to food-source availability, soil type, and climate structure. These results are in line with our findings.
hu-mid-Mediterranean and arid locations with high and low numbers, respectively. This is not surprising, since om-nivorous nematodes feed on bacteria and fungi, in addi-tion to other components of the fauna community. With a decrease in bacterial or fungal communities, bacteria- feeders and fungi-feeders decrease as their food sources become depleted, while the omnivores can feed on other existing food sources, thus overtaking the relative share of bacteria- or fungi-feeders in the community.
Although the trophic structure changed seasonally and in a different manner at each location, the general trophic composition remained constant although species compo-sition might have varied along the gradient. Bacteria- feeders were the dominant group at all locations, fol-lowed by fungi-feeders and plant-parasites; omnivores- predators were the smallest feeding group. Such commu-nity composition is similar to communities reported in Wright and Coleman [51] and many other nematode tro-phic-group studies. The present study clearly illustrates the existence of a strong seasonal effect on nematode- community composition and abundance, thus supporting the findings of Neher et al. [49] and García-Álvarez et al. [52].
5. CONCLUSIONS
The present study elucidates the significance of envi-ronmental factors (climate, soil type, food availability) that were found to play an important role in governing system functions in general, and in shaping soil free- living nematode community density and trophic structure in particular. Indeed, their influence on trophic composi-tion and abundance varies from one ecosystem to another on a temporal and spatial scale. The present study dem-onstrated that each climate region has a distinct effect—a nematode-community “fingerprint”—that matches its en- vironmental conditions throughout the seasons. Such “fin- gerprints”, if tested and described, can be a valuable tool for evaluating the effects of climate changes on soil- ecosystem ecological processes. Such input demonstrates the importance, wide range, and high potential of using soil free-living nematodes as bioindicators. Further re- search and a holistic approach are needed in order to enhance our understanding of this subject.
6. ACKNOWLEDGEMENTS
Special thanks to Ms. Gineta Barness for technical assistance and to Ms. Sharon Victor and Dr. Adi Oren for their useful comments. We
thank Dr. Marcelo Sternberg, Tel-Aviv University, coordinator of the field stations of the GLOWA Jordan River project
(www.glowa-jordan-river.de), where the research was carried out. This research was supported by the Israel Science Foundation (grant number 1272/08).
REFERENCES
[1] Giller, K.E., Neare, M.H., Lavelle, P., Izac, A.M.N. and Swift, M.J. (1997) Agricultural intensification, soil bio-diversity and agrosystem function. Applied Soil Ecology,
6, 3-16. doi:10.1016/S0929-1393(96)00149-7
[2] Wardle, D.A., Bardgett, R.D., Klironomos, J.N., Setala, H., Van Der Putten, W.H. and Wall, D.H. (2004) Eco-logical linkages between aboveground and belowground biota. Science, 304, 1629-1633.
doi:10.1126/science.1094875
[3] Bongers, T. and Bongers, M. (1998) Functional diversity of nematodes. Applied Soil Ecology, 10, 239-251. doi:10.1016/S0929-1393(98)00123-1
[4] Yeates, G.W., Bongers, T., De Goede, R.G.M., Freckman, D. and Georgieva, S.S. (1993) Feeding habits in soil ne- matode families and genera—An outline for soil ecolo- gists. Journal of Nematology, 25, 315-331.
[5] Wall, D.H. and Virginia, R.A. (1999) Controls on soil biodiversity: Insight from extreme environment. Applied Soil Ecology, 13, 137-150.
doi:10.1016/S0929-1393(99)00029-3
[6] Hogg, I.D., Cary, S.C., Convey, P., Newsham, K.K., O’Donnell, A.G., Adams, B.J., Aislabie, J., Frati, F., Ste-vens, M.I. and Wall, D.H. (2006) Biotic interactions in Antarctic terrestrial ecosystems: Are they a factor? Soil
Biology and Biochemistry, 38, 3035-3040.
doi:10.1016/j.soilbio.2006.04.026.
[7] Whitford, W.G. (2002) Ecology of desert systems. Aca-demic Press, New York, London.
[8] Pen-Mouratov, S., He, X.L. and Steinberger, Y. (2004) Spatial distribution and trophic diversity of nematode popu- lations under Acacia raddiana along a temperature gra- dient in the Negev Desert ecosystem. Journal of Arid En-
vironments, 56, 339-355.
doi:10.1016/S0140-1963(03)00058-2
[9] Ettema, C.H. and Bongers, T. (1993) Characterization of nematode colonization and succession in disturbed soil using the maturity index. Biology and Fertility of Soils,
16, 79-85. doi:10.1007/BF00369407
[10] Elliott, E.T. (1997) Rationale for developing bioindicators of soil health. In: Pankhurst, C., Doube, B.M. and Gupta, V.V.S.R., Eds., Biological Indicators of Soil Health, Cen-tre for Agricultural Bioscience International, New York, 49-78.
[11] Ferris, H., Bongers, T. and De Goede, R.G.M. (2001) A framework for soil food web diagnostics: Extension of the nematode faunal analysis concept. Applied Soil
Ecol-ogy, 18, 13-29. doi:10.1016/S0929-1393(01)00152-4
[12] Chen, X.Y., Daniell, T.J., Neilson, R., O’Flaherty, V. and Griffiths, B.S. (2010) A comparison of molecular meth-ods for monitoring soil nematodes and their use as bio-logical indicators. European Journal of Soil Biology, 46, 319-324. doi:10.1016/j.ejsobi.2010.05.002
under agricultural and extensive land management. Euro-
pean Journal of Soil Biology, 49, 55-62.
[14] Gray, S.B., Classen, A.T., Kardol, P., Yermakov, Z. and Miller, R.M. (2011) Multiple climate change factors in-teract to alter soil microbial community structure in an old-field ecosystem. Soil Science Society of America Jour-
nal, 75, 2217-2226. doi:10.2136/sssaj2011.0135
[15] Kardol, P., Cregger, M.A., Campany, C.E. and Classen, A.T. (2010) Soil ecosystem functioning under climate change: Plant species and community effects. Ecology, 91, 767- 781. doi:10.1890/09-0135.1
[16] Fleischer, A. and Sternberg, M. (2006) The economic impact of global climate change on Mediterranean range-land ecosystems: A space-for-time approach. Ecological
Economics, 59, 287-295.
doi:10.1016/j.ecolecon.2005.10.016
[17] Holzapfel, C., Tielborger, K., Parag, H.A., Kigel, J. and Sternberg, M. (2006) Annual plant-shrub interactions along an aridity gradient. Basic Applied Ecology, 7, 268-279. doi:10.1016/j.baae.2005.08.003
[18] Dan, J., Yaalon, D.H., Koyumdji, H. and Raz, Z. (1972) The soil association map of Israel (1:1,000,000). Israel Journal of Earth Sciences, 2, 29-49.
[19] Evenari, M.E., Shanan, L. and Tadmor, W. (1982) The Negev: The challenge of a desert. Harvard University Press, Cambridge.
[20] Black, C.A. (1965) Methods of soil analysis: Part 1. Phy- sical and mineralogical properties. American Society of Agronomy, Madison.
[21] Oren, A. and Steinberger, Y. (2008) Catabolic profiles of soil fungal communities along a geographic climatic gra-dient in Israel. Soil Biology and Biochemistry, 40, 2578- 2587. doi:10.1016/j.soilbio.2008.05.024
[22] Rowell, D.L. (1994) Soil science: Methods and applica-tions. Longman Group UK Ltd., London.
[23] Cairns, E.J. (1960) Methods in nematology. In: Sasser, J.N. and Jenkins, W.R., Eds., Nematology, Fundamentals and Recent Advances with Emphasis on plant Parasitic and Soil Forms. University of North Carolina Press, Cha- pel Hill, 33-84.
[24] Steinberger, Y. and Sarig, S. (1993) Response by soil nematode populations in the soil microbial biomass to a rain episode in the hot, dry Negev Desert. Biology and Fertility of Soils, 16, 188-192.
doi:10.1007/BF00361406
[25] Bongers, T. (1990) The maturity index: An ecological measure of environmental disturbance based on nematode species composition. Oecologia, 83, 14-19.
doi:10.1007/BF00324627
[26] Hendrix, P.F., Parmelee, R.W., Crossley, D.A. Jr., Cole- man, D.C., Odum, E.P. and Groffman, P.M. (1986) Detri- tus food webs in conventional and no-tillage agroecosys- tems. Bioscience, 36,374-380. doi:10.2307/1310259
[27] Twinn, D.C. (1974) Biology of plant litter decomposition. Academic Press, London.
[28] Wasilewska, L. (1994) The effect of age of meadows on succession and diversity in soil nematode communities.
Pedobiologia, 38, 1-11.
[29] Steinberger, Y., Liang, W., Savkina, E., Mesh, T., Barness, G. (2001) Nematode community composition and diver-sity associated with a topoclimatic transect in a rain shadow desert. European Journal of Soil Biology, 37, 315-320. doi:10.1016/S1164-5563(01)01107-4
[30] Pen-Mouratov, S., Rakhimbaev, M. and Steinberger, Y. (2003) Seasonal and spatial variation in nematode communities in the Negev Desert ecosystem. Journal of Nematology,
35, 157-167.
[31] Heip, C., Herman, P.M.J. and Soetaert, K. (1988) Data processing, evaluation and analysis. In: Higgins, R.P. and Thiel, H., Eds., Introduction to the Study of Meiofauna, Smithsonian Institution Press, Washington DC, 197-231.
[32] Shannon, C.E. and Weaver, W. (1949) The mathematical theory of communication. University of Illinois Press, Ur- bana.
[33] Pen-Mouratov, S., Barness, G. and Steinberger, Y. (2008) Effect of desert plant ecophysiological adaptation on soil nematode communities. European Journal of Soil Biology,
44, 298-308. doi:10.1016/j.ejsobi.2008.03.005
[34] Simpson, E.H. (1949) Measurement of diversity. Nature,
163, 668. doi:10.1038/163688a0
[35] Kardol, P., Reynolds, W.N., Norby, R.J. and Classen, A.T. (2011) Climate change effects on soil microarthropod abun- dance and community structure. Applied Soil Ecology, 47, 37-44. doi:10.1016/j.apsoil.2010.11.001
[36] Neher, D.A., Wu, J., Barbercheck, M.E. and Anas, O. (2005) Ecosystem type affects interpretation of soil nema- tode community measures. Applied Soil Ecology, 30, 47- 64. doi:10.1016/j.apsoil.2005.01.002
[37] Anderson, J.P.E. and Domsch, K.H. (1978) Physiological method for quantitative measurement of microbial bio-mass in soils. Soil Biology and Biochemistry, 10, 215-221. doi:10.1016/0038-0717(78)90099-8
[38] Freckman, D.W., Whitford, W.G. and Steinberger, Y. (1987) Effect of irrigation on nematode population dy-namics and activity in desert soils. Biology and Fertility
of Soils, 3,3-10. doi:10.1007/BF00260571
[39] Berg, N. and Steinberger, Y. (2008) Role of perennial plants in determining the activity of the microbial com-munity in the Negev Desert ecosystem. Soil Biology and
Biochemistry, 40, 2686-2695.
doi:10.1016/j.soilbio.2008.07.019
[40] Kandji, S.T., Ogol, C.K.P.O. and Albrecht, A. (2001) Diversity of plant-parasitic nematodes and their relation-ships with some soil physico-chemical characteristics in improved fallows in western Kenya. Applied Soil Ecology,
18, 143-157. doi:10.1016/S0929-1393(01)00157-3
[41] Pen-Mouratov, S., Hu, C., Hindin, E. and Steinberger, Y. (2011) Soil microbial activity and a free-living nematode community in the playa and in the sandy biological crust of the Negev Desert. Biology and Fertility of Soils, 47, 363-375. doi:10.1007/s00374-011-0540-x
[43] Frey, S.D., Elliott, E.T. and Paustian, K. (1999) Bacterial and fungal abundance and biomass in conventional and no-tillage agroecosystems along two climatic gradients.
Soil Biology and Biochemistry, 31, 573-585.
doi:10.1016/S0038-0717(98)00161-8
[44] Klich, M.A. (2002) Biogeography of Aspergillus species in soil and litter. Mycologia, 94, 21-27.
doi:10.2307/3761842
[45] Robinson, C.H., Dighton, J., Frankland, J.C. and Roberts, J.D. (1994) Fungal communities on decaying wheat-straw of different resource qualities. Soil Biology and
Biochem-istry, 26, 1053-1058. doi:10.1016/0038-0717(94)90120-1
[46] Chen, J. and Ferris, H. (2000) Growth and nitrogen min-eralization of selected fungi and fungal-feeding nema-todes on sand amended with organic matter. Plant and
Soil, 218,91-101. doi:10.1023/A:1014914827776
[47] Duyck, P.F., Dortel, E., Tixier, P., Vinatier, F., Loubana, P.M., Chabrier, C. and Quénéhervé, P. (2012) Niche parti-tioning based on soil type and climate at the landscape scale in a community of plant-feeding nematodes. Soil Biology and Biochemistry, 44, 49-55.
doi:10.1016/j.soilbio.2011.09.014
[48] Holland, E.A. and Coleman, D.C. (1987) Litter placement effect on microbial and organic matter dynamics in an agro- ecosystem. Ecology, 68, 425-433.
doi:10.2307/1939274
[49] Neher, D.A., Weicht, T.R., Savin, M., Gorres, J.H. and Ama- dor, J.A. (1999) Grazing in a porous environment. 2. Ne- matode community structure. Plant and Soil, 212, 85-99.
doi:10.1023/A:1004665120360
[50] De Goede, R.G.M., Verschoor, B.C. and Georgieva, S.S. (1993) Nematode distribution, trophic structure and bio-mass in a primary succession of blown-out areas in a drift sand landscape. Fundamental and Applied Nematology, 16, 525-538.
[51] Wright, C.J. and Coleman, D.C. (2002) Responses of soil microbial biomass, nematode trophic groups, N-minerali- zation, and litter decomposition to disturbance events in the southern Appalachians. Soil Biology and Biochemistry,
34, 13-25. doi:10.1016/S0038-0717(01)00128-6
[52] García-Álvarez, A., Arias, M., Diez-Rojo, M.A. and Bello, A. (2004) Effect of agricultural management on soil ne- matode trophic structure in a Mediterranean cereal system.
Applied Soil Ecology, 27, 197-210.
doi:10.1016/j.apsoil.2004.06.002
[53] Sternberg, M., Holzapfel, C., Tielbörger, K., Sarah, P., Kigel, J., Lavee, H., Fleischer, A., Jeltsch, F. and Köchy, M. (2011) The use and misuse of climatic gradients for evaluating climate impact on dryland ecosystems—An example for the solution of conceptual problems. In: Blanco, J. and Kheradmand, H., Eds., Climate Change— Geophysical Foundations and Ecological Effects, InTech, Rijeka, 361-374.