Design and Implementation a Smart Energy Saving
System using an Arduino and RF Module
Abdulmuttalib T. Rashid
Electrical Engineering Dept. University of Basrah
Basrah, Iraq
Osama T. Rashid
Computer Engineering Dept. Iraq University Collage
Basrah, Iraq
ABSTRACT
The demand for electrical energy is steadily increasing, and the buildings sector represents one of the largest energy end use. The larger amounts of that energy are wasted due to unnecessary heating and cooling. Several studies have shown that the major reason for this behavior lies in poor controls and the lack of feedback information. In this paper, a new management system is designed and constructed in order to perform saving the electrical energy. This system consist of an Arduino microcontroller with various sensors such as a temperature sensors, simple RF modules as well as actuators to control the air conditions. The principal work of this system is based on measure the temperatures of several rooms in the smart home, and then send these information wirelessly to main control device which employing better controls and feedback information to turns on only one air condition in one room at each time to save the electrical energy. The simple measurement shows that using the suggested system can save the electricity cost for every test case.
General Terms
Energy saving system, Smart home.
Keywords
Smart home; Temperature sensor; RF module; actutars.
1.
INTRODUCTION
Currently, consumption of electrical energy is the most common problem in smart home and building environments. So that, the monitoring of electrical energy consumption data of electrical equipment is becoming increasingly important [1, 2]. In recent field of research, the design of efficient electrical management system for homes or buildings is an active subject. Nowadays, an energy saving is crucial for every home [3-5]. The electricity is used in our daily life such the use of lights, air conditions, fans etc. The demand for energy is steadily increasing, and the buildings sector represents one of the largest energy end use. In this situation, heating and cooling are responsible for the major part of energy consumed by residential buildings. The larger amounts of that energy are misused due to unnecessary heating and cooling. Several studies have shown that the major reason for this behavior lies in poor controls, along with misconceptions about conventional heating and cooling controls.One of the researcher is interested in developing a prototype of smart home for energy saving. The prototype uses a microcontroller with various sensors such as a temperature sensor as well as actuators to control the lights, air conditions, as well as the fans etc. [6]. Other researcher installs motion sensors and reed contacts on doors to sense residents’ occupancy of the dwelling, which was used to infer a heating schedule [7]. This process saving about 15% of the energy. In 2013 several techniques to enable energy savings are developed [8]: (1) passive infrared sensors and magnetic reed switches to detect
when residents are away; (2) a probabilistic model that uses the current sensor data and the historic sensor data to decide when the heating should be turned on and off; (3) a simple heuristic approach to achieve deeper setbacks when residents are away for longer periods of time. They are reported that an optimal prediction achieved 35.9% savings on average energy. In 2011 a passive infrared-based wireless sensor network solution from a commercial building to gather real-world occupancy data is used [9]. The Markov Model is developed and trained based on the data and predicted the occupancy level for the building. With a model and simulation in Energy Plus, the authors report savings of 42% on average energy. In 2009 the researchers developed a GPS thermostat to decrease and increase the temperature, depending on the travel-to-home time of the residents, which was determined by each resident’s smartphone location and a geo-location mapping service [10]. They tested the prototype for 14 days in a single household, also evaluating the potential energy savings using their own simulation framework. They reported savings of 3.4% over the period of 14 days. In 2014 another researcher closed that comparison gap by simulating the energy savings and comfort loss of most of the state-of-the-art approaches on a number of representative scenarios [11]. With their dataset and experimental setup, it turns out that all tested prediction algorithms achieved almost the same annual efficiency gains ranging from 6% to 17% energy saving. In this paper, a prototype of smart home for energy saving is developed. The prototype uses an Arduino microcontroller with various sensors such as a temperature sensor as well as actuators to control the air conditions. The principal of energy saving in this system depends on control the number of working air conditions at each moment. This process is achieved by choosing a suitable temperature to switch on and off the devices and at each time only limit number of air conditions to be operate. The rest of the paper is organized as follows: Section 2 explains the system architecture, the experimental results shown in section 3, and finally section 4 discuss the results.
2.
THE SYATEM ARCHITECTURE
Energy saving has raised a lot of interest because it provides the ability to save the energy and reduce the cost to the costumers. The energy save system has several devices with the same structure: The main control device and the auxiliary device. The main one is equipped by keypad to control the number of worked devices and the range of working temperature. In this paper our prototype system has one main and two control devices.
2.1.The Main Control Device
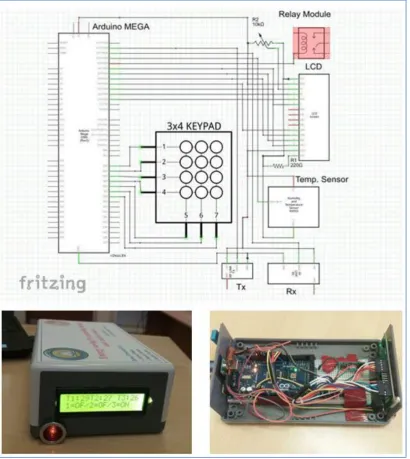
The hardware and the software parts. This hardware part equipped by the following parts: Arduino Mega, LCD Module, Heat Sensor DHT11, Relay Module, 433 MHz TX, 433 MHz Rx and 3*4 Keypad.
[image:2.595.323.536.72.192.2]The Arduino (Fig. 1) is a small microcontroller board with a USB plug to connect to your computer and a number of connection sockets that can be wired up to external electronics, such as motors, relays, light sensors, laser diodes, loudspeakers, microphones, etc.... It can either be powered through the USB connection from the computer or from a 9V battery.
Fig. 1. The Arduino Mega.
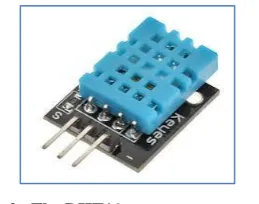
[image:2.595.52.282.199.331.2]The DHT11 digital temperature and humidity sensor is a composite Sensor contains a calibrated digital signal output of the temperature and humidity as shown in Fig. 2. The sensor includes a resistive sense of wet components and an NTC temperature measurement devices, and connected with a high-performance 8-bit microcontroller.
Fig. 2. The DHT11 temperature sensor.
[image:2.595.329.525.244.406.2]The RF modules (Fig. 3) are very popular among the Arduino tinkerers. The 433MHz is used on a wide variety of applications that require wireless control. These modules are very cheap and you can use them with any microcontroller (MCU).
Fig. 3. The 433MHz RF modules.
The LCDs are very popular and broadly used in electronics projects as they are good for displaying information like sensors data from your project, and also they are very cheap. It has 16 pins: the Ground, VCC, Vo, RS, and so on.
Fig. 4. The LCD module.
The relay (Fig. 5) is defined as an electrically controlled device that opens and closes electrical contacts, or activates and deactivates operation of other devices in the same or another electrical circuit.
Fig. 5. The Relay module.
[image:2.595.103.233.405.507.2] [image:2.595.362.497.462.555.2]Fig. 6. The complete circuit diagram and the front face of the main control device.
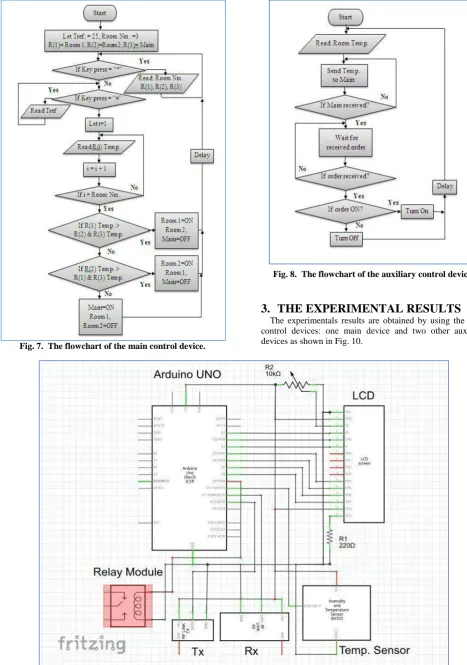
The software part of the main control device is shown in Fig. 7. The procedure for investigating this flow chart is as in following steps:
Step 1: When the main device equips by the keypad at first it checks if the number of devices or the reference temperature are need to change.
Step2: The main device reads it is room temperature.
Step 3: The main device waits for the temperature reading from the auxiliary control devices.
Step 4: According to these reading the main device decides which must be turn on and which one must be turn off.
2.2.The Auxiliary Control Devices
These devices are distributed in the other rooms in the smart home. They are used to read the temperatures of their sensors and send these reading wirelessly to the main control device. According to these reading the main device gives the order to turn on one device at each time. Each auxiliary device has the same hardware structure of the main control device except the
Keypad. The software used by these devices is shown in Fig. 8. The procedure for investigating this flow chart is as in following steps:
Step1: The auxiliary device reads it is room temperature. Step 2: The auxiliary device sends it is temperature reading to the main control devices.
Step 3: The auxiliary device waits to the order from the main control device to turn on or turn off.
Fig. 7. The flowchart of the main control device.
Fig. 8. The flowchart of the auxiliary control device.
3.
THE EXPERIMENTAL RESULTS
The experimentals results are obtained by using the three control devices: one main device and two other auxiliary devices as shown in Fig. 10.
[image:4.595.80.509.411.738.2]Fig. 10. The experimental setup using the main and auxiliary control devices.
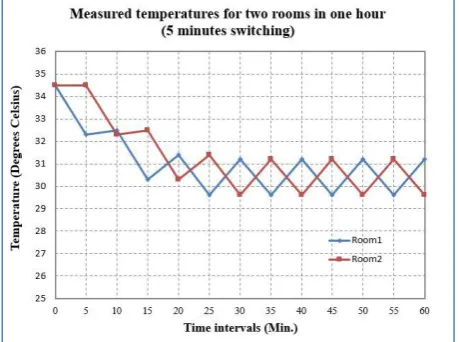
These experiments are used to measure the performance of the control system when the three control devices are switched on and off to control the temperature of two and three rooms. The experiments are repeated for two and three rooms and tested for different switching times. Fig. 11, 12, 13, 14 and 15 shows the results obtained for 5, 10, 15, 20 and 30 minutes switching times respectively. These experiments are used with two control devices.
Fig. 11. The two rooms measurement temperatures with 5 minutes switching time.
[image:5.595.316.543.470.640.2]
Fig. 12. The two rooms measurement temperatures with 10 minutes switching time.
[image:5.595.54.284.559.730.2]Fig. 13. The two rooms measurement temperatures with 15 minutes switching time.
[image:6.595.55.283.76.249.2]Fig. 14. The two rooms measurement temperatures with 20 minutes switching time.
Fig. 15. The two rooms measurement temperatures with 30 minutes switching time.
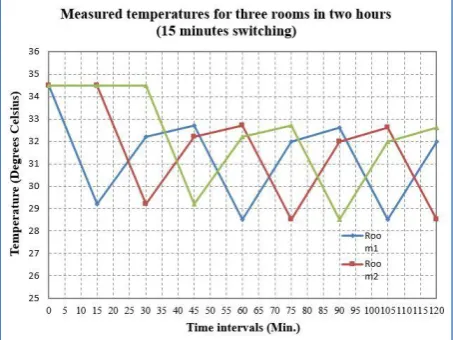
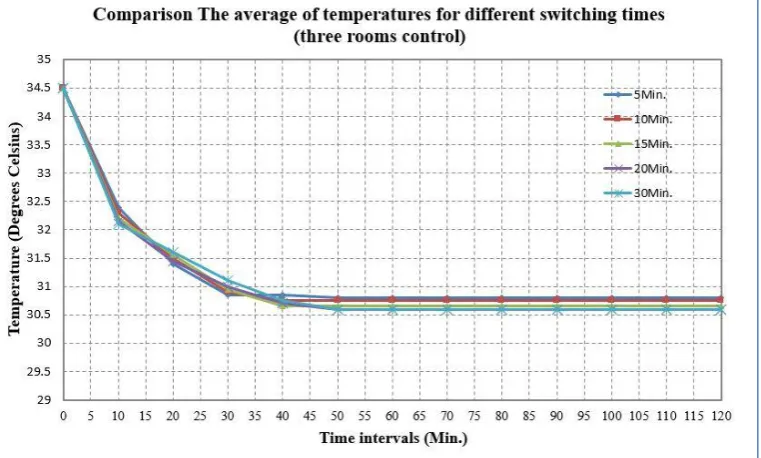
Fig. 17, 18, 19, 20 and 22 shows the results obtained for 5, 10, 15, 20 and 30 minutes switching times respectively. These experiments are used with three control devices. By comparison the average temperatures for each room in these experimenters (three rooms experiments with 5, 10, 15, 20 and 30 minutes switching times) we found that the experiment with 30 minutes switching time produces a pest cooling system as shown in Fig. 22. Finally, Fig. 23 shows a comparison between the two and three rooms systems. The switching time used in this comparison is 30 minutes. From figure we found that the two rooms system produces a pest cooling system.
4.
CONCLUSION
[image:6.595.52.281.80.440.2]In this paper the prototype for saving energy device is design and constructed. This system is builds by using a very cheap equipment's. A simple RF module is used for data transferring among the devices. This system is designed to turn on only one device at each time. This process reduce the amount of the spent energy and also, reduce the cost of the electricity for the users. The experiments show that the best case is obtained when the switching time is increased and also, when the number of the control devices are reduced.
[image:6.595.56.281.277.447.2] [image:6.595.109.493.524.750.2]Fig. 17. The three rooms measurement temperatures with 5 minutes switching time.
Fig. 18. The three rooms measurement temperatures with 10 minutes switching time.
[image:7.595.317.544.282.425.2]Fig. 19. The three rooms measurement temperatures with 15 minutes switching time.
Fig. 20. The three rooms measurement temperatures with 20 minutes switching time.
[image:7.595.55.281.287.459.2] [image:7.595.55.282.502.672.2]Fig. 22. The average temperatures comparison for different switching times (three rooms control).
Fig. 23. The average temperatures comparison for two and three rooms control.
5.
REFERENCES
[1] F. K. Handhal and A. T. Rashid, ” A prototype Design for Three Phase Smart Energy Meter“, Second Al-Sadiq International Conference on Multidisciplinary in IT and Communication Science and Applications, 2017. [2] F. K. Handhal and A. T. Rashid, “Design and building a
single-phase smart energy meter using Arduino and RF communication system “, Proc. of the 3rd Int. Sci. Conf., (14-15/march/2018).
[3] A. T. Rashid and M. T. Rashid,” Design and Implementation of Load Balancing System for a Smart Home“, Proc. of the 3rd Int. Sci. Conf., (14-15/march/2018).
[4] F. K. Handhal and A. T. Rashid,, ” Load Balancing in Distribution System Using Heuristic Search Algorithm “ , International Conference on Advances in Sustainable Engineering and Applications (ICASEA), Wasit University, Kut, Iraq, pp. 48-53, 2018.
[5] A. T. Rashid, F. K. Handhal and O. T. Rashid,” Wireless Control system for Three Phase Loads Balancing in Distribution Networks “, International Journal of Computer Applications (0975 – 8887) Vol. 182 – No. 7, pp. 38-46, 2018.
[image:8.595.109.491.348.590.2]International Journal of Smart Home, Vol. 7, No. 1, pp. 47-66, 2013.
[7] G. Gao and K. Whitehouse,” The Self-Programming Thermostat: Optimizing Setback Schedules based on Home Occupancy Patterns”, In Proceedings of the First ACM Workshop on Embedded Sensing Systems for Energy-Efficiency in Buildings. Berkeley, California: ACM Press, pp. 62–77, 2009.
[8] S. Lee,” Occupancy prediction algorithms for thermostat control systems using mobile devices”, In IEEE Transactions on Smart Grid, pp. 1332–1340, 2013. [9] V. L. Erickson, M. A. Carreira-Perpiñán and A. E.
“OBSERVE: Occupancy-Based System for Efficient
Reduction of HVAC Energy. In Information Processing in Sensor Networks (IPSN), 2011 10th International Conference on. IEEE, 2011.
[10] M. Gupta, S. Intille and K. Larson, “Adding GPS-control to traditional thermostats: An exploration of potential energy savings and design challenges”, In Pervasive Computing. Springer Berlin Heidelberg, pp. 95–114, 2009.
[11] W. Kleiminger, F. Mattern and S. Santini,”Predicting household occupancy for smart heating control: A comparative performance analysis of state-of-the-art approaches”, Energy and Buildings, Vol. 85, pp.493–
505, 2014