Determination of Apparent Formation Constants of
Eu(III) with Humic Substances by Ion Selective Liquid
Membrane Electrode
Takayuki Sasaki1*, Hatsumi Yoshida1, Taishi Kobayashi1, Ikuji Takagi1, Hirotake Moriyama2
1Department of Nuclear Engineering, Kyoto University, Kyoto, Japan 2Research Reactor Institute, Kyoto University, Osaka, Japan
Email: *[email protected]
Received April 15, 2012; revised May 10, 2012; accepted June 7, 2012
ABSTRACT
This is the novel measurement of the apparent formation constants of trivalent lanthanide with humic substances by potentiometric titration using an ion selective electrode (ISE) consisting of bis(diphenylphosphoryl)methane as an
ionophore. The ISE prepared exhibited a Nernstian response to the Eu3+ concentration in the test solutions in the
pres-ence of humic acid and fulvic acid. The effect of the solution conditions, including the pH, initial metal and humic sub-stance concentrations, and ionic strength, on the formation constants was examined. The present formation constants were compared with the reported data using solvent extraction method.
Keywords: Apparent Formation Constant; Humic Substance; Eu(III); Ion Selective Electrode; Titration
1. Introduction
Naturally occurring humic substances (fulvic and humic acids) exist in colloidal, suspended, and dissolved forms in groundwater. The molecular framework of these sub- stances consists of aromatic rings and hydrocarbon chains. The negatively charged major functional groups—car- boxyl and phenol groups—are distributed heterogene- ously and coordinate with numerous radionuclides, in- cluding those in the trivalent ions of Am, Cm, and lan- thanides [1,2] as radioactive wastes, which arise from the reprocessing of the spent fuel used in nuclear power plants. Thus, understanding the impact of humic sub- stances on the migration behavior of trivalent radionu- clides has been essential for safety assessments related to the disposal of such radioactive waste. The migration be- havior of the trivalent metal ions is predominantly con- trolled by the solubility products, along with the sorption onto an artificial barrier and host rock in groundwater. Therefore, there is an intrinsic need for the formation constants of water-soluble organometallic species from the chemical thermodynamics point of view.
The apparent formation constants of metal-humate complexes under a variety of aquatic conditions have been determined using several traditional methods such as solvent extraction [3], spectrophotometry, conductime- try, ion exchange methods such as Schubert’s method [4- 6], ultra filtration [7,8], equilibrium dialysis method [9],
and titration method using a pH- and/or ion selective electrodes (ISE) [10-12]. Potentiometric titration using an ISE is a very conventional approach that is used to di- rectly and easily measure the activity of free (uncom- plexed) metal ions. Although a few ion-selective elec- trodes have been developed for the potentiometric deter- mination of trivalent lanthanide and actinide ions [13-16], no application to determine the formation constant has been reported. Recently, we developed a novel technique to determine the formation constants of trivalent metal ions with carboxylic acid electrochemically, using a li- quid membrane electrode [17,18]. The ISE exhibited a Nernstian response to a wide range of pH values, as well as various concentrations of Eu3+ as an analogue of Am3+
and Cm3+, along with a fairly good response time. In the
present study, a titration technique using an ISE was utilized for the systematic measurement of the formation constants of europium with three humic substances. The constants were also determined using the traditional batch solvent extraction method for comparison.
2. Experimental
2.1. Reagents
The studied humic substance materials, humic acid (HA) and fulvic acid (FA), are commercial powders that are available from the International Humic Substances Soci- ety (IHSS) and Sigma-Aldrich Co. The Sigma-Aldrich
humic acid in sodium form was purified prior to use Liquid
membrane (nitrobenzene) 10-3M
Eu(BDPPM)3 ・3TPhB +10-2M BDPPM
Test solution
xM Eu3+
+ humic substance
I= 0.1, 0.01 (NaCl)
SSE2
0.1M LiClAg|AgCl SSE1
0.1M LiClAg|AgCl Inner solution
10-3M Eu3+
pH 2 (HCl)
following the known protocol (abbreviated as ALHA) [19], and has been characterized [20,21]. The IHSS HA (as SHA, Eliot soil humic acid, code 1S102H) and FA (as SFA, Suwanee river fulvic acid, code 1S101F), which have also been well characterized as standards for envi- ronmental organic matter [22], were used without further purification. Additional aqueous solutions were prepared using ultrapure Milli-Q water (Millipore) with a resi-
stivity of 18.2 MΩ/cm. All of the chemicals were of
analytical grade.
2.2. Titration with ISE
Prior to the titration to determine the formation constants of Eu(III) with the humic substances, the applicability of the present ISE was checked. A fresh nitrobenzene so- lution containing Eu(III)-bis(diphenylphosphoryl)methane (BDPPM) complex was prepared using an ion-pair sol- vent extraction with Na tetraphenylborate (TPhB) accor- ding to the procedure reported previously [17]. The con-
centrations of the extracted species, Eu(BDPPM)3·3TPhB
and BDPPM, were 1 × 10⁻³ mol/dm3 (M) and 1 × 10⁻² M,
respectively. As shown in Scheme 1, the inner solution
of ISE was 1 × 10⁻³ M Eu3+ at pH 2, and the identical
supporting electrolyte, 0.1 M LiCl, was adopted in the inner solution for the silver-silver chloride electrode (SSE1) and reference electrode (SSE2). The pH combi- nation electrode was calibrated to measure the hydrogen ion concentration ([H+] = 10–pHc), based on the reference
method [23,24]. A combination glass electrode (Kyoto Electronics, 98-100-C171) was used to measure the pH, and the reference electrode was filled with 3.6 M NaCl + 0.4 M NaClO4.
The Eu-ISE measurements were performed using an automatic potentiometric titrator (AT-510, Kyoto Elec- tro-nics) equipped with a 50-mL polypropylene vessel in a water bath at 298 ± 1 K, a magnetic Teflon stirrer, and a nitrogen gas purge system (10-mL/min). The potential,
denoted as ISE potential (ΔVISE), generated between
SSE1 and SSE2, after a constant potential was attained, was measured using a potentiostat (Hokuto-denko, HA- 151), and recorded by an X-Y recorder (Riken-denshi, SP-K2V).
0.1-mL portions of the titrants of the humic substances
(ALHA, SHA, SFA) were added to 10 ml of the 10–5 and
3 × 10⁻⁵ M Eu3+ solutions (I = 0.1 and 0.01 M (NaCl)) at
intervals of 300 sec. The pHc was automatically kept
constant by adding NaOH solution. The ionic strength of the test solution was controlled to be 0.1 and 0.01 using the Na+-Cl– system throughout the experiment.
2.3. Solvent Extraction
The procedure for determining the formation constants by solvent extraction was described previously in detail
Scheme 1. ISE cell configuration.
[25]. In brief, in order to obtain data about distribution
ratio D, an aqueous phase, containing various concentra-
tions (10–6 - 10–3 M) of the humic substances and Eu
(10–6 - 3 × 10⁻⁵ M), was adjusted to the desired pH c using
sodium hydroxide, perchloric acid. The organic phase of xylene contained TTA (2-thenoyltrifluoroacetone) as an extractant and TBP (tri-n-butyl phosphate) as a synergist. The aqueous and organic phases were shaken for 6 h at
298 ± 1 K. After the phase separation, the pHc of the
aqueous phase was measured and taken as the equili- brium pH. The Eu(III) concentrations in both phases were measured using inductively coupled plasma mass spectrometry, where the concentration in the organic
phase was determined after stripping with 0.1 M HNO3.
Because the recovery of Eu(III) was usually more than 95%, no serious unexpected reactions such as precipita- tion or a third phase formation were observed.
3. Theoretical
3.1. Determination of Apparent Formation Constants by Titration with ISE
Because of the heterogeneous chemical property of hu-mic substances, the number of functional groups per mo- lecule and the molecular weight cannot be clearly de- fined. Therefore, by analogy with Langmuir’s adsorption isotherm, the apparent formation constant, βapp, is defined
as follows [10],
[ ]
[
][ ]
app 3
EuL
Eu R
β
+ −
=
4 CLO−
(1)
where [Eu3+] and [EuL] are the concentrations of free
metal ions and metal ions bound with humic substance L, and [R–] is the concentration of the dissociated functional group in eq/dm3. Here, in the absence of metal ions, [R–]
is given on the basis of the charge balance, [H+] + [Na+]
= [R–] + [OH–] +
( )
, and
4 4
pH p pH
ini Na add ini add
ini add
Na ClO ClO
c w c
R K
c V c V c V c V
V V
− − = − −
′ ′
+ − −
+
+
10 10
ClO
(2)
where cNa and c 4are the concentrations of sodium
and perchlorate ions in the initial test solution, cNa′ ClO4
is the initial volume, Vadd is the added titrant volume, and
pHc is the negative logarithm of the absolute hydrogen
ion concentration (−log[H+]). The ion product (pK w) was
used from the literature [26]. By using the apparent pro-tonation constant, Kapp, as
app
K [HR]
[H ][R ]+ −
=
(
)
(3)
the degree of dissociation, α, can be written as
(
)
app] 1
1+ 1+K [H ]+
[R ] [HR] [R
[HR] [R ]
α − −
−
= +
= 1 = (4)
Similar to previous works [20,27], two major proton- dissociable functional groups—carboxylic and phenolic groups—are considered. Then, the two apparent protona- tion constants, Kapp,i (i = 1,2), can be rewritten as a func-
tion of pH and [Na+],
[
]
app, c
log log pH −blog Na+
( )
i i i
K = K +m (5)
where mi, b, and logKi are the characteristic constant pa-
rameters of the humic substance [28].
At a given I, the [R–] is defined by the sum of two dis- sociated functional groups of the humic substance (R–) in meq/g, where j g of the humic substance is dissolved in V
dm3 of the solution,
[ ]
R R 103j V
− = − (6)
The (R−) is given by
( )
(
)
1 1 2 2
app,
c
R
1 [H ]
log pH
1 10 ^ (1 )
1 1, 2
w
w w i
i i w i i i i i C C C K C K m i α α − + = + = + = − + − − =
log[Na ]m b +
−
w
C1 Cw
w
C
w
C w Cw
{ }
(7)
where and 2 mean the total carboxylic and
phenolic group concentrations, respectively, and 1 +
2 = tot in meq/g. These parameters, i, logKi/(1–mi),
and mi, were determined using a fitting analysis with
[image:3.595.309.538.99.277.2] [image:3.595.63.289.418.554.2]Equations (2) and (6) [21,29], and are summarized in
Table 1. The values are used for the calculation of the apparent formation constants, as described below.
C
The total concentration of the proton-exchanging sites,
CR, and metal ion[Eu]tot in mol/dm3 are described as
[ ]
R R1 R2
HR R
C C C
−
= +
= +
[
]
3 tot HS 10
EuL
w C
m
=
+ (8)
[ ]
Table 1. Characteristics of humic substances.
HS SFA [29] SHA [21] ALHA [21]
Origin 1S101F IHSS 1S102H IHSS 01816HH Aldrich
w
C1
2w
C
4.78 3.99 4.27 logK1/
(1 – m1) 3.27 3.69 4.29
m1 0.70 0.66 0.67
1.44 1.42 1.01 logK2/
(1 – m2) 8.98 9.82 9.46
m2 0.83 0.73 0.80
b 0.11 0.28 0.09
[
]
3+ EuL
= +
tot
Eu Eu (9)
2w 1w
C C 0.30 0.36 0.24
where {HS} is the mass concentration of the humic sub- stance in g/dm3, and m is the number of functional groups
binding a europium ion and is assumed to be 3, which is
equal to the charge number of Eu3+ in the present study.
When complex EuL is formed with each binding site, the three proton-exchanging groups are assigned to be for- mally satisfied with a charge-neutralized complex. Then, Equation (8) can be replaced by
[
]
(
)
[ ]
(
)
(
)
( )
R 3 tot R totR 3 EuL
R
3 Eu Eu w
C C C α − − + = −
= − − (10)
In the titration experiment with ISE, the concentration
of free metal ion [Eu3+] can be measured directly. The
observed ISE potential, ΔVISE, in mV, which arises from
the different activities, aEu,SSE, of the free Eu3+ ions
be-tween SSE1 and SSE2 in Scheme 1, is described by the
following Nernstian response,
(
Eu,SSE1 Eu,SSE2)
ISE ln ln const
3
RT a a
V
F −
Δ = +
3
ISE 19.7 log Eu const
V +
Δ = +
(11)
where R is a gas constant equal to 8.314 J/K/mol, T is the
temperature (K), and F is the Faraday constant, which is
equal to 96500 C/mol. When aEu ≈ [Eu3+] can be
as-sumed in the present experimental condition of low [Eu3+], the linear relationship between the potential and
concentration, with a slope of ca. 20 mV/decade, is shown as,
(12)
Equa-tion (1) is determined.
-80 -60 -40 -20 0 20
-8 -7 -6 -5 -4 -3 -2
log[Eu3+] (M)
Δ
VIS
E
(m
V)
3.2. Determination of βapp by Solvent Extraction The extraction equilibrium constant, Kex, of europium for
(
)
3
org
3
Eu 3HTTA
Eu TTA TBP
++ +
(
)
org
,org TBP
3H l
l
− + +
(
)
[
]
(13)
I=0.01
is described as I=0.03
(
)
[
]
3
org
org org
H
TBP l
l
− +
3
ex 3 3
Eu TTA TBP
Eu HTTA
K
+
=
(14)
I=0.1
where the subscript org denotes the species in the organic
phase. When the complex formation of Eu3+ by TTA–
and the hydrolysis reaction by OH– are negligible in the
aqueous phase at pHc < 5, the distribution ratio of Eu(III),
D0, in the absence of a complexing ligand can be simply
expressed by
[ ]
[
3]
org
Eu Eu+
0 =
D (15)
Then, distribution ratio D in the presence of a humic
substance is given by
[ ] [ ]
[ ]
[
]
[ ]
(
)
3+ EuL
+
org tot org
org 3
app
Eu Eu Eu Eu
Eu
Eu 1 R
D
β
+ −
= =
=
+
(16)
where the “initial” concentration of Eu is defined as
[ ]
3[
] [ ]
ini
Eu =Eu ++ E
uL + Euorg (17)
Finally, from the difference between the presence (D)
and absence (D0) of humic substances,
(
)
app 0
β = D D−1 R−
(18)
The βapp values in Equation (18) can be determined,
where the [R–] is described by Equations (4) and (10), as follows,
[ ]
(
)
)
R Eu 1−D D0
(
totR− α C 3
= ⋅ −
(19)
4. Results and Discussion
4.1. Electrochemical Response of ISE
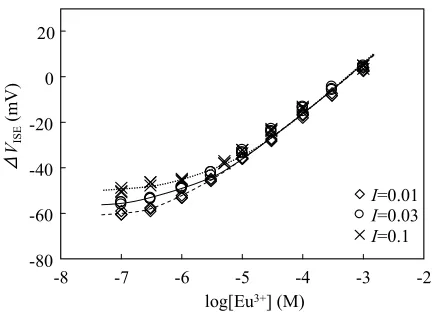
The electrochemical properties of the present ISE were
characterized prior to use. Figure 1 shows the variation
in ΔVISE as a function of the logarithm of [Eu3+] at dif-
ferent ionic strengths in the absence of humic substances. Although deviations from the Nernstian behavior (ap- parently as a result of the NaCl background) were ob- served in solutions containing lower europium concen- trations, the ISE gave a good linear response with a slope of ca. 20 mV/decade for Eu3+ in the log[Eu3+] range of –6 -
[image:4.595.315.531.81.237.2]–3 at I = 0.01 and –5.3 - –3 at I = 0.1. The interference with the potential response by competitive ions is not
Figure 1. Potential response of ISE for Eu3+ at different ionic strengths of NaCl (pHc 5, 298 K).
considered here, because the quantification of the selec-
tivity of the present ISE among the actinide series, Pu3+
vs. UO22+, U4+, NpO2+, and Pu4+, has been investigated,
and showed good selectivity for the different valence state ions [17]. Indeed, no other metal ions, except Na and anions, would be present in this experiment.
The electrode response on the pHc of the test solutions
was investigated as shown in Figure 2. The reading po-
tential value remained constant at the pHc range of 3 - 6,
while the values at pHc 5 decreased slightly because of
the competitive response for protons. In addition, a flat ISE response was found in a wide range of [Eu3+].
At europium concentrations of 10–3 - 5 × 10⁻⁶ M, the
potential remained sufficiently stable over 6 h, and good reproducible readings in several sets of titration experi- ments in the system of the carboxylic acid-Eu complexa- tion were obtained [18]. Similarly, the reading potential values remained constant after repetitive use of ISE in the present humic substance system, suggesting an unde- sirable reaction such as the sorption and the dissolution of humic substance for the ISE did not occur. Here, in order to investigate the dynamic response time of the ISE, the potential change in the test solution before and after
the addition of Eu3+ was recorded with time. As shown in
Figure 3, the addition of 10–2 M EuCl
3 to the initial
europium solution induced a sudden increase in the read- ing potential. The occurrence of this phenomenon just
after the addition (tc ~ 0) must have been caused by a
local increase in the Eu concentration near the electrode. In fact, the potential became stable within 30 sec, sug- gesting a homogeneous condition.
A similar behavior was observed in the presence of a
humic substance. The [Eu3+] evaluated according to Equ-
ation (12) over time is shown in Figure 4. When the
ALHA portion was dropped into the test solution to at- tain CR = 0 to 10–4 eq/dm3, the free Eu3+ ions were rap-
I=0.1
I=0.01
-60 -40 -20 0 20
4 2
0
pHc -60
-40 -20 0 20
Δ
VISE
(m
V
)
Δ
VIS
E
(m
V)
[image:5.595.61.284.83.313.2]8 6
Figure 2. pH dependence of ISE response for different con- centrations of Eu3+ at I = 0.1 (top) and 0.01 (bottom); log[Eu3+] = –3 (♦),–4(□), –5 (▲), and –5.3 for I = 0.1 and –6 for 0.01 (×).
-40 -30 -20 -10 0
-20 0 20 40
tc(sec)
Δ
VISE
(m
V)
[image:5.595.62.287.374.511.2]60 80
Figure 3. Potential response change from log[Eu3+] = –5.3 to –4 at pHc = 5 and I = 0.1.
-5.5 -5 -4.5 -4 -3.5
-100 0 100 103
tc(sec)
lo
g[
Eu
3+] (
M
)
104
~ ~~~
~ ~~~
Figure 4. Time dependence of free Eu ion concentration with addition of ALHA solution; 20 ml of [Eu]tot = 3 × 10⁻⁵ M solution (pHc = 5, I = 0.1), and the titrant of 1 ml ALHA is CR = 2 × 10⁻³ eq/dm3.
after 100 sec. In the following experiment, the expected
CR change for each drop was <10–5 eq/dm3 and the drop-
ping interval was 300 sec. Thus, it is possible to conclude that this good property of ISE meets the basic require- ments of the present study.
4.2. Titration Plot
Potentiometric titrations were made under the controlled
constant pHc. The typical result of the logarithm of the
europium concentration as a function of CR is shown in
Figure 5. Because of the complexation of Eu with humic substances, the free europium ion concentration de- creased with an increase in the amount of humic sub- stances. The apparent formation constants, βapp, at each
titration point were calculated based on the determined free [Eu3+].
4.3. Apparent Formation Constants
The dependency of CR on the apparent formation con-
stants, βapp, is shown in Figure 6. Because of the hetero-
geneous property of HA, the βapp value varied with the
pH, metal ion and humic substance concentrations, and ionic strength. In the presence of excess CR to the [Eu3+],
the Eu3+ ions preferentially interacted with the stronger
coordination sites [30]. Then, the βapp values would in-
crease. On the other hand, the weaker coordination sites need to be used for complexation under the condition of
a smaller amount of CR. A similar explanation is avail-
able from the viewpoints of the Eu concentration and ionic strength. At a given logCR condition, the series of βapp at [Eu]tot = 3 × 10⁻⁵ M are lower than that at 10–5 M,
and the higher amount of Na+ (I = 0.1) effectively inter-
feres with the occupation of Eu3+ on the binding sites of
HA. Such an ionic strength effect on the metal complex- ation has been discussed by several researchers. Some model concepts have been represented by a linear rela- tionship between the apparent formation constants and ionic strength with an empirical parameter [10,31].
The βapp data for SHA determined using the solvent
extraction method, are also plotted in Figure 6. Although
the CR range examined was different from each method,
the increasing tendency of βapp with an increase of CR can
be observed, suggesting the heterogeneous property of SHA. Thus, the data will be useful for constructing a semi-empirical model of the formation constants of metal ion-humic substance complexation [30]. On the other
hand, Figure 7 shows the lower impact of I and [Eu] on
the βapp for the SFA system. Even at the higher logCR
above –3.5, the βapp value did not increase with increas-
ing CR.
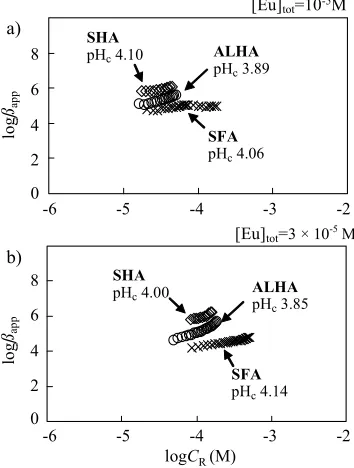
A comparison of the βapp data for the three humic sub-
stances under similar solution conditions is shown in
[image:5.595.60.288.561.686.2]-7 -6 -5 -4 -3
lo
g[
E
u
3+ ] (M)
0.01, 4.06, 10-5[ISE]
0.01, 4.10, 3x10⁻⁵ [ISE]
0.1, 4.18, 3x10⁻⁵ [ISE]
[image:6.595.59.285.84.237.2]0 5×10⁻⁵ 1×10⁻⁴ 1.5×10⁻⁴ 2×10⁻⁴ CR(M)
Figure 5. Titration plots of logarithm of free europium con- centration as function of CR at constant pHc of 4.87 and I = 0.01 (NaCl). The [Eu]tot is 3 × 10⁻⁵ M, the titrant is 2 × 10⁻³ M of ALHA.
0 2 4 6 8 a)
-6 -5 -4
I, pH
-3 -2
c, [Eu]tot(M)
0.01, 4.10, 10-5[ISE]
0.1, 4.09, 3x10⁻⁵ [ISE]
0.01, 3.95, 10-5 [Extr.]
0.01, 4.00, 3x10⁻⁵ [ISE]
0.1, 3.98, 3x10⁻⁵ [Extr.]
0.01, 4.99,
10-5[ISE] 0.0
3x
0.1, 5.03, 3x10⁻⁵[ISE]
1, 4.87, 10-5 [ISE]
0.1, 4.15, 0.01, 3.89,
10-5[ISE]
0.1, 4.15, 3x10⁻⁵ [ISE]
0. 3x1 [IS
-6 -5 -4
--6 -5 -4
-0 2 4 6 8 b)
0 2 4 6 8
c)
lo
g
ßapp
lo
g
ßap
p
lo
g
ßapp
logCR(M)
10-5 [Extr.]
01, 3.85, 0-5
E]
3 -2
3 -2
0.01
[Ex, 3.86, 3x10
-5
tr.]
3 × 10⁻⁵ 3 × 10
-5 3 × 10⁻⁵
3 × 10⁻⁵
3 × 10⁻⁵
3 × 10⁻⁵
3 × 10⁻⁵ 3 × 10⁻⁵
Figure 6. Dependence of logCR, I, [Eu]tot, and analytical method on logβapp: (a) SHA; (b, c) ALHA.
ALHA compared to SFA might be related to the logK/(1–m) value in Table 1, which provided a measure of the strength of proton binding as the acidity. The high value is affected by strong intramolecular hydrogen
0.01, 5.05, 10-5[ISE]
0.01, 5.04, 3x10⁻⁵ [ISE]
-6 -5 -4 -3 -2
0 2 4 6 8
log
ßapp
logCR(M)
-6 -5 -4 -3 -2
0 2 4 6 8
lo
g
ßapp
I,pHc, [Eu]tot(M) 10
3 × 10⁻⁵
3 × 10⁻⁵
[image:6.595.335.508.87.299.2]3 × 10⁻⁵
Figure 7. Dependence of logCR, [Eu]tot and I on logβapp for SFA.
SHA
pHc4.10
[Eu]tot=10-5M
ALHA
pHc3.89
SFA
pHc4.06
[Eu]tot=3x10⁻⁵M
SHA
pHc4.00 ALHApH c3.85
SFA
pHc4.14
-6 -5 -4 -3 -2
0 2 4 6 8
lo
g
ßap
p
logCR(M) 0
2 4 6 8
lo
g
ßapp
-6 -5 -4 -3 -2
a)
b)
3 × 10⁻⁵M
/
w w C C
Figure 8. Intercomparison of logβapp for humic substances at pHc ~ 4, I = 0.01 (NaCl), and [Eu]tot = 10–5 M (a) and 3 × 10⁻⁵ M (b). Data were obtained by the titration with ISE.
bonds among the neighboring multi-functional groups. This fact might introduce a strong chelate complexation, resulting in the higher βapp values. However, it is difficult
to correlate the ratio of the number of carboxylic and
phenolic functional groups, 2 1 , to the reason for
the different βapp values. The other reason would be the
[image:6.595.74.268.300.646.2] [image:6.595.334.511.342.576.2]aggregate than FA. If the polyvalent metal ion Eu3+ was
incorporated by the aggregation, the βapp might increase.
5. Conclusion
The apparent formation constants of europium ions with humic acid and fulvic acid could be determined by po- tentiometric titration using an ion selective electrode (ISE) under several solution conditions. The electrode exhibited a stable and quick Nernstian response during the period of measurement. Unlike the batch-type solvent extraction method, the present titration can acquire mul-tiple data points at once without troublesome experimen-tal preparations.
REFERENCES
[1] J. I. Kim and T. Sekine, “Complexation of Neptunium(V) with Humic-Acid,” Radiochimica Acta, Vol. 55, No. 4, 1991, pp. 187-192.
[2] V. Moulin, J. Tits and G. Ouzounian, “Actinide Speci-ation in the Presence of Humic Substances in Natu-ral-Water Conditions,” Radiochimica Acta, Vol. 58, 1992, pp. 179-190.
[3] Y. Takahashi, Y. Minai, S. Ambe, Y. Makide, F. Ambe and T. Tominaga, “Simultaneous Determination of Sta-bility Constants of Humate Complexes with Various Metal Ions Using Multitracer Technique,” Science of the Total Environment, Vol. 198, No. 1, 1997, pp. 61-71. doi:10.1016/S0048-9697(97)05442-9
[4] D. Wenming, Z. Hongxia, H. Meide and T. Zuyi, “Use of the Ion Exchange Method for the Determination of Sta-bility Constants of Trivalent Metal Complexes with Hu-mic and Fulvic Acids—Part I: Eu3+ and Am3+ Complexes
in Weakly Acidic Conditions,” Applied Radiation and Isotopes, Vol. 56, No. 6, 2002, pp. 959-965.
doi:10.1016/S0969-8043(01)00055-0
[5] M. Schnitzer and S. I. M. Skinner, “Organo-Metallic In- teractions in Soils: 7. Stability Constants of Pb++-, Ni++-,
Mn++-, Co++-, Ca++-, and Mg++-Fulvic Acid Complexes,” Soil Science, Vol. 103, No. 4, 1967, pp. 247-252. doi:10.1097/00010694-196704000-00004
[6] M. Schnitzer and S. I. M. Skinner, “Organo-Metallic In- teractions in Soils: 5. Stability Constants of Cu++-, Fe++-,
and Zn++-Fulvic Acid Complexes,” Soil Science, Vol. 102,
No. 6, 1966, pp. 361-365.
doi:10.1097/00010694-196612000-00002
[7] M. Caceci, “The Interaction of Humic-Acid with Euro-pium(III) Complexation Strength as a Function of Load and pH,” Radiochimica Acta, Vol. 39, 1985, pp. 51-56. [8] J. H. Ephraim, “Heterogeneity as a Concept in the
Inter-pretation of Metal-Ion Binding by Humic Substances—The Binding of Zinc by an Aquatic Fulvic Acid,” Analytica Chimica Acta, Vol. 267, No. 1, 1992, pp. 39-45. doi:10.1016/0003-2670(92)85004-P
[9] M. A. Glaus, W. Hummel and L. R. Van Loon, “Equilib-rium Dialysis-Ligand Exchange: Adaptation of the Me- thod for Determination of Conditional Stability Constants
of Radionuclide-Fulvic Acid Complexes,” Analytica Chi- mica Acta, Vol. 303, No. 2-3, 1995, pp. 321-331. doi:10.1016/0003-2670(94)00534-S
[10] A. Kirishima, T. Ohnishi, N. Sato and O. Tochiyama, “Simplified Modeling of the Complexation of Humic Substance for Equilibrium Calculations,” Journal of Nu-clear Science and Technology, Vol. 47, No. 11, 2010, pp. 1044-1054. doi:10.1080/18811248.2010.9711669 [11] J. G. Hering and F. M. M. Morel, “Humic Acid
Com-plexation Calcium and Copper,” Environmental Science and Technology, Vol. 22, No. 10, 1988, pp. 1234-1237. doi:10.1021/es00175a018
[12] J. P. Pinheiro, A. M. Mota and M. F. Benedetti, “Lead and Calcium Binding to Fulvic Acids: Salt Effect and Competition,” Environmental Science and Technology, Vol. 33, No. 19, 1999, pp. 3398-3404.
doi:10.1021/es990210f
[13] T. Ito, C. Goto and K. Noguchi, “Lanthanoid Ion-Selec- tive Solvent Polymeric Membrane Electrode Based on 1-Phenyl-3-methyl-4-octadecanoyl-5-pyrazolone,” Analy- tica Chimica Acta, Vol. 443, No. 1, 2001, pp. 41-51. doi:10.1016/S0003-2670(01)01192-8
[14] M. R. Ganjali, N. Davarkhah, H. Ganjali, B. Larijani, P. Norouzi and M. Hossieni, “A Novel Europium(III) Sensor Based on 4E-4-(2-phenylviazenyl)-2-((E)-(2-aminoethyli- mino)methyl)phenol,” International Journal of Electro-chemical Science, Vol. 4, No. 6, 2009, pp. 762-771. [15] J. B. Harrell, A. D. Jones and G. R. Choppin, “A Liquid
Ion-Exchange Membrane Electrode for Polyvalent Cations,” Analytical Chemistry, Vol. 41, No. 11, 1969, pp. 1459-1462. doi:10.1021/ac60280a026
[16] D. A. Chowdhury, T. Ogata, S. Kamata and K. Ohashi, “Samarium(III)-Selective Electrode Using Neutral Bis (thiaalkylxanthato)alkanes,” Analytical Chemistry, Vol. 68, No. 2, 1996, pp. 366-370. doi:10.1021/ac950814b [17] Y. Kitatsuji, H. Aoyagi, Z. Yoshida and S. Kihara,
“Plu-tonium(III)-Ion Selective Electrode of Liquid Membrane Type Using Multidentate Phosphine Oxide Ionophore,” Analytica Chimica Acta, Vol. 387, No. 2, 1999, pp. 181- 187. doi:10.1016/S0003-2670(99)00121-X
[18] T. Sasaki, H. Yoshida, Y. Kitatsuji, I. Takagi and H. Mo-riyama, “Formation Constants of Eu(III)-Carboxylates Determined by Ion Selective Liquid Membrane Elec-trode,” Chemistry Letters, Vol. 40, 2011, pp. 870-871. doi:10.1246/cl.2011.870
[19] J. I. Kim, G. Buckau, G. H. Li, H. Duschner and N. Psar-ros, “Characterization of Humic and Fulvic Acids from Gorleben Groundwater,” Fresenius Journal of Analytical Chemistry, Vol. 338, No. 3, 1990, pp. 245-252.
doi:10.1007/BF00323017
[20] A. Kirishima, T. Ohnishi, N. Sato and O. Tochiyama, “Determination of the Phenolic-Group Capacities of Hu-mic Substances by Non-Aqueous Titration Technique,” Talanta, Vol. 79, No. 2, 2009, pp. 446-453.
doi:10.1016/j.talanta.2009.04.008
Extrac-tion Method,” Radiochimica Acta, 2012, in press. [22] “International Humic Substances Society,” 2012.
http://www.humicsubstances.org
[23] G. Gran, “Determination of the Equivalence Point in Po-tentiometric Titrations.Part II,” Analyst, Vol. 77, No. 920, 1952, pp. 661-671. doi:10.1039/an9527700661
[24] K. Fujiwara, H. Yamana, T. Fujii, K. Kawamoto, T. Sa-saki and H. Moriyama, “Solubility of Uranium(IV) Hy-drous Oxide in High pH Solution under Reducing Condi-tion,” Radiochimica Acta, Vol. 93, No. 6, 2005, pp. 347- 350. doi:10.1524/ract.93.6.347.65643
[25] T. Sasaki, S. Kubo, T. Kubota, I. Takagi and H. Mori-yama, “Complex Formation of Lanthanides(III) and Acti-nides(III) with Dicarboxylates Containing Soft Donor Groups,” Journal of Alloys and Compounds, Vol. 408- 412, 2006, pp. 1283-1286.
doi:10.1016/j.jallcom.2005.04.130
[26] C. F. Baes and R. E. Mesmer, “The Hydrolysis of Cations,” John Wiley & Sons, New York, 1976.
[27] J. Du, N. Sato and O. Tochiyama, “Potentiometric Study
on the Proton Binding of Humic Substances,” Journal of Nuclear and Radiochemical Sciences, Vol. 6, No. 1, 2005, pp. 25-29.
[28] O. Tochiyama, Y. Nibbori, K. Tanaka, H. Yoshino, T. Kubota, A. Kirishima and B. Setiawan, “Modeling of the Complex Formation of Metal Ions with Humic Acids,” Radiochimica Acta, Vol. 92, No. 9-11, 2004, pp. 559-565. doi:10.1524/ract.92.9.559.54996
[29] K. Müller and T. Sasaki, “Complex Formation of Np(V) with Fulvic Acid at Tracer Metal Concentration,” Radio-chimica Acta, 2012, in press.
[30] T. Sasaki, T. Kobayashi, I. Takagi and H. Moriyama, “Discrete Fragment Model for Complex Formation of Europium(III) with Humic Acid,” Journal of Nuclear Science and Technology, Vol. 45, No. 8, 2008, pp. 718- 724. doi:10.3327/jnst.45.718
[31] W. Hummel, M. A. Glaus and L. R. Van Loon, “Trace Metal-Humate Interactions. II. The ‘Conservative Roof’ Model and Its Application,” Applied Geochemistry, Vol. 15, 2000, pp. 975-1001.

![Figure 2. pH dependence of ISE response for different con- centrations of Eulog[Eu3+ at I = 0.1 (top) and 0.01 (bottom); 3+] = –3 (♦),–4(□), –5 (▲), and –5.3 for I = 0.1 and –6 for 0.01 (×)](https://thumb-us.123doks.com/thumbv2/123dok_us/9288591.424254/5.595.61.284.83.313/figure-dependence-ise-response-different-centrations-eulog-eu.webp)