A Low-Memory-Requiring and Fast Approach to Cluster
Large-Scale Decoy Protein Structures
Yate-Ching Yuan1, Yingzi Shang2, Hongzhi Li1*
1Department of Molecular Medicine, City of Hope National Medical Center and Beckman Research Institute, Duarte, USA 2The School of Mathematics and Statistics, Hebei University of Economics and Business, Shijiazhuang, China
Email: *[email protected], [email protected]
Received February 24, 2012; revised April 1, 2012; accepted April 12,2012
ABSTRACT
This work demonstrates the so-called PCAC (Protein principal Component Analysis Clustering) method, which clusters large-scale decoy protein structures in protein structure prediction based on principal component analysis (PCA), is an ultra-fast and low-memory-requiring clustering method. It can be two orders of magnitude faster than the commonly- used pairwise rmsd-clustering (pRMSD) when enormous of decoys are involved. Instead of N N
1 2
least-square fitting of rmsd calculations and N2 memory units to store the pairwise rmsd values in pRMSD, PCAC only requires Nrmsd calculations and N × P memory storage, where N is the number of structures to be clustered and P is the number of preserved eigenvectors. Furthermore, PCAC based on the covariance Cartesian matrix generates essentially the iden- tical result as that from the reference rmsd-clustering (rRMSD). From a test of 41 protein decoy sets, when the eigen- vectors that contribute a total of 90% eigenvalues are preserved, PCAC method reproduces the results of near-native selections from rRMSD.
Keywords: Protein Structure Predicition; Protein Structure Cluster; Principal Component Analysis;
Low-Momery-Requiring Clustering; Ultra-Fast Clustering
1. Introduction
In ab initio protein-structure prediction, usually a large amount of protein conformations (decoys) are generated. Clustering of similar predicted protein structures is a commonly adopted procedure [1-4]. The clustering pro-cedure simplifies data analysis by reducing the enormous number of decoys generated from the large-scale con-formational search and provides information of the dis-tribution of the structures in conformational space. In order to compare clustering results from diversed pro-teins, an adaptive cluster cutoff method is recommended [5] instead of K-means algorithm. The main drawback of K-means clustering [6,7] is that a pre-determined number of clusters is required, which is not suitable for decoy clustering.
Structural clustering (e.g., leader algorithm [8]) is usu-ally based on the pairwise root-mean-squared distance (pRMSD), which is a more accurate similarity measure than other measures, e.g., distance of internal coordinates [9,10]. The pRMSD requires N N
1 2
least-square fitting of rmsd calculations for N structures. It is time- consuming when a large amount of decoys are involved. Li et al. have developed a fast decoy clustering method(SCUD) that is based on reference root-mean-squared distance (rRMSD), which only requires N rMSD calcula-tions to a reference conformation [11]. A randomly se-lected reference conformation is used to remove overall translational and rotational motion for all the decoys and rmsd between any two conformations is determined without further reorientation. From a test of 53 decoy sets of or proteins, the near-native selections of rRMSD is similar to that of pRMSD. SCUD is 8 times faster without significant change in the accuracy of near-native selections. However, both pRMSD and rRMSD methods require N2 memory units to store the rmsd values of each
pair of structures in order to speed up calculation, which may exceed the computer’s available memory limit when the number of decoys ranges from 104 to 106 [12].
Principal Component Analysis (PCA) is one of the most valuable results from linear algebra. It can be used to reduce the number of variables from a linear Gaussian data set or to classify them [13]. PCA was first intro-duced to biosystem analysis by Gower in 1966 [14,15]. It has been successfully implemented to describe molecu- les’ energy landscape [16-18], nonlinear motions in pro-teins [19-21], as well as many other bioinformatics fields [22-28]. From a sample data set with p variables and N
individuals, there are two ways to build the PCA matrix. One method constructs a p × p matrix to measure the discrepancy of the individuals along principal axes in the
p-dimensional space. The other method, i.e., principal coordinate analysis, builds a N × N matrix to analyze the similarity of the individuals [14,29]. Normally, a covari-ance matrix [19] is constructed, since its eigenvalue is the variance of the N individuals along the corresponding eigenvector. The matrix can also be constructed as a dis-tance matrix [29], in which the eigenvalue is not directly related to the variance of the individuals any more. The elements of the matrix can be calculated either from the Cartesian coordinates, internal coordinates (e.g., pair dis- tances between two atoms [30], bond angles or dihedral angles [31]), their derivations [32], or any other reason-able measures [23].
In this study, we describe that a clustering method based on PCA, which is called PCAC (Protein principal Component Analysis Clustering), is also a powerful tool for clustering the predicted protein structures. PCAC clustering based on Cartesian coordinates is identical to rRMSD clustering when all the eigenvectors are pre-served. From a test of 41 proteins 5 with 2000 folding decoys each, PCAC results in similar near-native selec-tions as rRMSD method when the eigenvectors (about 17) that contribute a total of 90% eigenvalues are preserved. The method needs only N least-square fitting of rMSD calculations instead of N N
1 2
in pRMSD. Fur-thermore, other than N2 memory units needed in pRMSDand rRMSD clustering, PCAC requires only N × P mem-ory units to store the preserved eigenvectors, where P is the number of preserved eigenvectors that is usually a fixed number less than 100 and independent to the num-ber of decoys N. Consequently, it can be hundreds of times faster than pRMSD method when a large number of decoys are studied and the computer cannot store the
N2 pairwise rmsd values in memory. PCAC may be
im-plemented to cluster other large-scale database as well, e.g., compound library for virtual screening.
2. Methods
2.1. Constructing Covariance Matrix in Cartesian Coordinates
The covariance matrix [13] of C atoms in Cartesian co-ordinates is used in the PCA calculation. The element σij
(covariance of two coordinates) in the 3p × 3p matrix (p
number of C atoms in protein that have a total of 3p Car-tesian coordinates) is defined as
11 1
N
i j li i lj j
l
x x x x N
where N is the number of decoys for a specific protein, l
en th
2.2. PCAC: Clustering in PCA Space
coys in PCA
(1)
is the decoy index, i and j are the coordinate indices of a total of 3p Cartesian coordinates, and xi and xj are the average of the conformations along ith and jth coordi-nates, respectively. Before the covariance matrix is con-structed, the decoys are translated and rotated to match a reference conformation: thus the rMSD in between the decoy and the reference is minimized. A total of N rMSD calculations is required to remove the overall rotation.
The eigenvalues are sorted in descending order wh e covariance matrix is diagonalized. Only the eigen-vectors that have significant eigenvalues are preserved for further analysis. We either preserve eigenvectors with the highest eigenvalues, or set an eigenvalue-percent- age-cutoff value (the fraction of the preserved eigenval-ues over the total eigenvaleigenval-ues) to select the number of preserved eigenvectors.
PCAC is based on pairwise distance of de
space. The PCA distance, dmn, between structures m and
n is defined as
2 1P
mn k k
k
d m n
(2)where P is the number of preserved important
eigenvec-alized to a scaled Carte-si
tors (P ≤ 3p), and mk and nk are the coordinates of the two decoys projected on the kth eigenvector. During clustering, the projected coordinates of each decoy is stored in N × P memory units.
The PCA-distance dmn is norm
an PCA-distance in order to compare it with the rRMSD method
1
s
mn mn
d d p
(3)
where p is the number of C atoms to build the Cartesian
o the diversity of protein decoy sets, an adaptive cl
3. Discussion
est PCAC method is obtained from the energy-minimization of 41 helical proteins [5]. The num- covariance matrix. All the decoys close to each other within a cluster cutoff in PCA space are clustered to one family.
Due t
uster cutoff value is strongly recommended. The cluster cutoff value is calculated when the number of decoys in the top 3 largest clusters includes 5% of the total decoys (T35 value [11]). The top 5 largest clusters are selected as the best prediction for a specific protein and the value of the structure selection listed in tables is the one that has minimum rMSD from native among the 5 selected structures.
ber of residues in the proteins ranges from 40 to 124 and the number of helices is from 2 to 6. For each protein, at least 2000 initial structures are produced. The initial structures are constructed with random dihedral angles for the residues in nonhelical regions and native dihedral angles for the residues in helical regions [33,34]. The DFIRE energy function [35], together with improper torsion energy and a simple repulsive potential, are em-ployed to minimize the initial structures in dihedral space to fold the protein. As proved by Equation (5), PCAC generates the exactly same results as rRMSD when all the eigenvalues are preserved, no further decoy sets are needed on test of the new methodology.
3.1. PCA-Distance and rRMSD
The rRMSD value used in SCUD, rectly calculated rMSD of two decoyrMSD
r mn
s indexed as, is the di- m and ize their
n when both of conformations minim rMSD val-ues to the reference conformation [11],
3
2
1 rMSD
p r
mn
mknk1
k
p (4)
where p is the total number of C atoms i
culation, and mk′ and nk′ are the k′th laboratory Cartesian
oordinates on the PCA ei
nvolved in
cal-coordinates (after least-square fitting to the reference conformation) of the two decoys.
Since the decoy’s coordinates measured in PCA space are the projections of laboratory c
genvectors, the Cartesian distance of any two C atoms remains constant in both laboratory coordinates and PCA coordinates. Thus, from Equations (2)-(4), we have,
1rMSDr s when 3
mn dmn P p
p (5)
Apparently, from the above equation, we
the rRMSD value is identical to the scaled PCA-distance w
luster Cutoff
ined cutoff value is selected to However, it is difficult to set one
produced and the nu
can see that
hen all the eigenvectors resulted from PCA are consid-ered.
3.2. C
Normally a pre-determ cluster the structures.
cutoff value for the diverse proteins because this will lead to too few clusters for some proteins and too many clusters for the others [5,36].
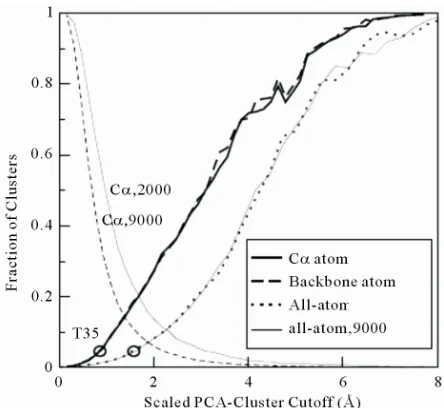
Figure 1 depicts the effect of cluster cutoff on the
fraction of the number of clusters
[image:3.595.312.534.83.287.2]mber of decoys included in the top 3 largest clusters. We can see that the fraction of the number of clusters strongly depends on the number of decoys, whereas the fraction of the number of decoys included in the top 3 largest clusters is independent. A well-defined cluster cutoff value should be constant as the number of ana-
Figure 1. The fraction of decoys in the top 3 largest clusters (two lines end at right-top corner) and number of cluster
toff s T35 value, i.e. the number of decoys in the top 3
larg-Be Preserved
envalues contrib-ure similarity in
steadily as the eigenvalue-percentage-cutoff in- cr
s (two lines start at left-top corner) over the total number of decoys as a function of PCA cluster cutoff value from 1GAB10-51 decoy set (scaled by Equation (3)). The
eigen-value-percentage-cutoff is 70%. The solid lines are from 2000 decoys, whereas the dashed lines are from 9000 decoys. The circle at the left-bottom corner of the figure illustrates the selected cluster cutoff T35 value (see text for detail).
lyzed decoys varies. Hence, we select the cluster cu a
est clusters accounts for 5% of the total decoys. T35 val-ue is selected as cluster cutoff based on the fact that a statistically significant amount of decoys are included in the top largest cluster (over 40 for a 2000 decoy set), meanwhile, most of the diverse decoys (about 50%) are conserved. Li et al. have tested the effect of using dif-ferent cutoffs as 1%, 3%, 5%, 10%, 15% and 20% of all decoy structures contained in top three clusters [11]. It shows that a cutoff between 3% to 5% produces the best near-native selections.
3.3. Eigenvectors to
Only the eigenvectors with highest eig ute significantly to determining struct
PCA. The eigenvalue distribution of protein 1GAB10-51 is
illustrated in Figure 2. The top 5 and 10 eigenvectors
from 1GAB10-51 contain 70% and 85% of the eigenvalues,
respectively. We can also see that the curves from 2000 and 9000 decoys are almost identical, implying the ei-genvalue distribution is independent to the number of decoys.
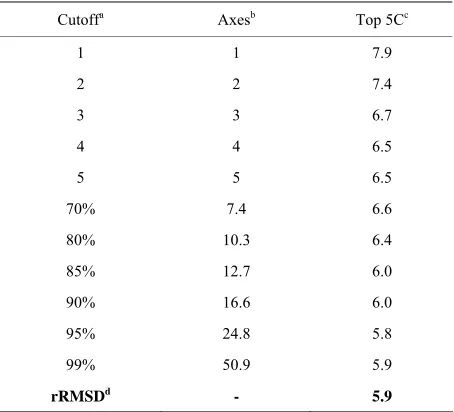
As listed in Table 1, the near-native selection result
improves
diction similar to rRMSD, which preserves only 17 ei-genvectors on average. Table 2 compares the best
[image:4.595.314.532.100.693.2]struc-ture selection of 41 proteins from rRMSD and PCAC at 90% eigenvalue-percentage-cutoff. The average near- native selection of top 5 clusters from PCAC is 6.0 Å, which is very close to the 5.9 Å value from rRMSD me-thod. At 99% eigenvalue-percentage-cutoff (on average 51 eigenvetors are preserved), the average near-native selections from the two methods are identical.
Figure 2. The eigenvalue distribution of protein 1GAB10-51
The solid line and dashed line represent the distributio
41 proteins using ifferent numbers of principal axes.
[image:4.595.60.285.202.406.2]. n from 2000 and 9000 decoys, respectively.
Table 1. Average structure selections of d
Cutoffa Axesb Top 5Cc
1 1 7.9
2 2 7.4
70% 7.
80% 10.
rRMSDd
-3 -3 6.7
4 4 6.5
5 5 6.5
4 6.6
3 6.4
85% 12.7 6.0
90% 16.6 6.0
95% 24.8 5.8
99% 50.9 5.9
5.9
aThe numbe ipal axes prese ber) or the ei lue-per-
centage- ntage); bThe aver umber of principa selected;
c
r of princ rved (num genva
cutoff (perce age n l axes
The minimum rmsd value from native of the top five structures ranked by cluster size after clustering (in Å); dThe result from rRMSD method using
[image:4.595.59.286.481.687.2]the same reference conformation.
Table 2. Structure selections of 41 proteins from rRMSD method and PCA-clustering.
PDB Nresa rRMSDb PCAc
1G6U 48 0.8(1) 0.7(2)
2ERL 40 2.9(4) 3.8(1)
1LP1 55 2.9(1) 2.9(1)
1EZ3 124 5.1(1) 5.6(1)
1LVFA 106 3.2(1) 3.1(1)
1BW6 56 3.6(1) 3.7(1)
1DV0 45 3.6(4) 3.8(2)
1EDK 56 8.5(1) 2.8(4)
1EF4 55 5.1(4) 5.9(4)
1IDY 54 5.9(1) 5.9(1)
1BDD 60 6.6(4) 6.6(4)
1MBE 53 8.5(4) 7.2(3)
1 44
1
1 60
1A 56
1
1A 96 88
1 68
1B 740 90
1 86
PRB10−53 2.6(2) 2.6(3)
1PRU 56 5.7(3) 6.4(5)
2SPZ 58 1.9(5) 2.8(3)
2HOA 68 12.2(4) 12.4(3)
1CKT 71 10.4(1) 11.1(4)
1DV5 80 7.4(3) 7.4(1)
GAB10-51 42 2.7(1) 2.4(2)
LBU17-76 7.8(3) 7.7(5)
1LEA6-52 47 4.1(5) 4.7(1)
1LRE 81 5.3(2) 5.4(1)
2OCC 79 7.7(2) 8.4(3)
4Helix 106 7.1(1) 6.3(4)
04A158-213 2.5(2) 2.5(4)
1A6S 87 7.7(1) 8.1(3)
1C5A 65 8.0(3) 8.2(4)
FFH2-88 87 3.1(2) 3.1(3)
1NKL 78 4.2(4) 4.2(1)
2ABD 86 8.1(1) 8.1(1)
ISB1109-11 5.1(2) 7.7(5)
B0NA1-68 5.4(3) 5.4(4)
1B0XA916-977 62 3.1(1) 5.2(3)
1UNKA 7 10.5(1) 9.5(2)
1CTJ 89 8.6(4) 9.6(1)
1KDXA 81 7.1(1) 6.3(5)
MTA651- 5.1(3) 3.2(3)
QC7235-320 4.9(1) 8.8(3)
1BXM 98 8.8(3) 8.8(1)
1NGR 85 9.8(4) 9.9(5)
1RZL 91 7.9(5) 7.8(3)
Ave. 71.4 5.9(2.4) 6.0(2.7)
aThe num esidues; bT inimum from na
rank) of t five structu d by e from r
r-n Å) minimum m lue from nd the ra top
ber of r he m rmsd value tive (and the
he top
; cThe res rankesd va cluster siz native (a RMSD clustenk) of the
ing (i r
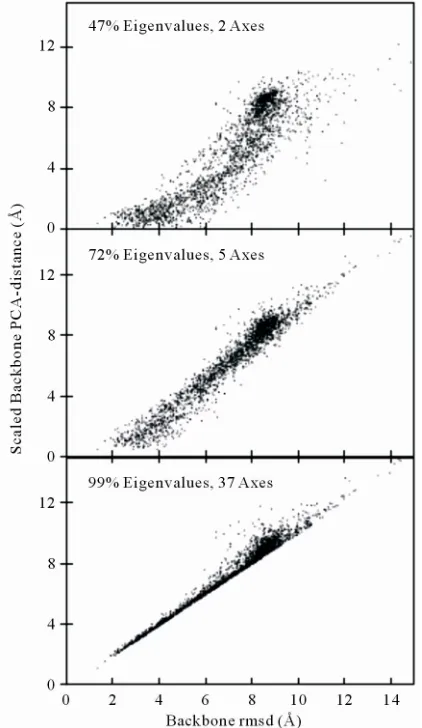
PCAC method is a sufficient method to cluster struc-tures as rRMSD is further displayed in Figure 3. The
fig
on
n be af- ure shows the relationship of the scaled PCA-distance and the least-square fitting rMSD value of protein 1GAB10-51 at different eigenvalue-percentage-cutoffs. The
correlation coefficient increases from 0.88 to 0.99 at 47% and 99% eigenvalue-percentage-cutoffs. As the scaled PCA-distances at 99% eigenvalue-percentage-cutoff are almost identical to the rmsd values within the cluster cutoff region, the clustering results from the two methods are expected to be almost identical as well.
3.4. Choose the Reference Conformati
Results from principal component analysis ca
Figure 3. Backbone rmsd from the structure in largest cluster of 2000 1GAB10-51 decoys vs the scaled backb e
As discussed above, PCAC from covariance matrix in essentially the same
re-on PCA-distance to that structure at different eigenvalue-per- centage-cutoff values. The PCA reference conformation is the random-selected energy-minimized structure. The ei-genvalue-overall-cutoff values are of 47% (2 most impor-tant principal axes are calculated from a total of 126 axes), 72% (5 axes) and 99% (37 axes) for the three plots, respec-tively.
fected by the selection of the reference structures [37]. As shown in Table 3, the near-native selection result
from using native as reference is artificially enhanced. We must avoid selecting the native as a reference con-formation in PCAC. However, it is shown that the aver-age near-native selection result is not sensitive to a ran-domly selected structure, even if the unfolded initial structure is picked as reference [5]. As listed in Table 3,
we tested using 3 randomly selected energy-minimized structures (on average 10 Å rMSD from native) and 2 initial unfolded structures (16 Å from native) as refer-ence states. The resulting near-native selections are simi-lar. Therefore, in terms of near-native structure selections, using any structure that is not close (within the cluster cutoff) to the native (and/or close to any of the top 5 clusters) can produce similar and unbiased results.
3.5. An Ultra-Fast Method
Cartesian coordinates produces
sult as the rRMSD method. Moreover, PCAC can be hundreds of times faster when thousands or more decoys are calculated. The pairwise rmsd clustering requires
1 2
N N calculations of pairwise least-square fitting rmsd values. We also need N2 memory units to store the
res lting rmsd values, which can easily surpass computer memory when tens of thousands of decoys are included. For example, upto 1,000,000 loop decoys were generated by Jacobson et al. [12]. On the other hand, PCAC only needs N least-square fitting rmsd calculations and N × P
memory units to store the preserved P eigenvectors. The overhead of PCAC method is the PCA calculation, which includes constructing the covariance matrix (needs on
u
[image:5.595.67.278.272.636.2]e round calculation of N least-square fittings to the reference conformation), diagonalizing the matrix, and
Table 3. Average structure selections of 41 proteins using different reference conformations.
90 % Cutoffa 99 % Cutoffa
Referenceb
Top 5Cc Axesd Top 5Cc Axesd
final(1) e 6.0 16.4 5.9 50.9
final(2) 5.8 16.5 5.4 50.7
final(3) 5.9 16.5 6.1 50.6
initial(1) 5.9 16.6 5.5 50.9
initial(2) 5.8 16.6 5.8 51.1
native 5.3 16.4 5.1 50.6
aEige entage-c ; bRefer onform three -s
elected -minimize l) stru s, two ra m-selecte l
(initia res, and na cThe mi rmsd v rom na he
nvalue-perc utoff ence c ation: random
energy l) structu
d (fina tive;
cture nimum
ndo alue f
d initia tive of t top five structures ranked by cluster size from PCA clustering (in Å); dThe
number of principal axes preserved; eThis random-selected energy-mini-
[image:5.595.308.538.553.680.2]projecting the structures on the preserved eigenvectors. In the test of clustering on 9000 1GAB10-51 decoys,
324 Mb memory storage is needed for the pairwise e as
accordingly. Because the eigenvalue dist tio
onstrates that PCAC is an extremely fast requiring algorithm to cluster l
. PCAC method ca
g. HL ap-his deep discussion o
[1] O. M. Becker, “Geometric versus Topological Clustering: An Insight int ,” Proteins:
Struc-ture, Function l. 27, No. 2, 1997,
rMSD values (each rMSD value occupies 4 bytes storag a real number). If the required memory storage can not be satisfied, each pair of rMSD values must be recalcu-lated when needed. The computing time for traditional pRMSD method to cluster the 9000 decoy set is 53,500 seconds (including a total of 10 rounds of clustering to search the cluster cutoff T35 value). For PCAC, less than 1 Mb memory storage is required for the clustering of 9000 decoys at 90% eigenvalue-percentage-cutoff. It takes a total of 274 seconds, which includes 102 seconds for PCA calculation and 172 seconds for clustering. PCAC method is almost 200 times faster than pRMSD method when the computer memory can not hold N2 real
numbers.
The more decoys analyzed, the faster PCAC method becomes, since the fraction of the overhead PCA calcula-tion drops ribu-n is almost iribu-ndeperibu-nderibu-nt to the ribu-number of decoys (shown in Figure 2), another way to speed up PCA
cal-culation is analyzing only a small number of decoys (e.g., 2000) to calculate the PCA matrix and implementing the obtained eigenvectors to a large number of decoys. Con-sequently, the overhead of PCA calculation can be fur-ther reduced.
4. Conclusion
This work dem and
low-memory-scale predicted protein structures
arge- n be over 100 times faster than pairwise-rMSD clustering method. The computer memory requirement also drops from O(N2) to O(N), where N is the size of the dataset.
PCAC algorithm may be implemented to cluster other large-scale bioinformatics dataset as well when the data-set can be effectively described in PCA space.
5. Acknowledgements
We thank Ms. Sue Hargrave for proof readin preciates Dr. Yaoqi Zhou for
work.
n this
REFERENCES
o Conformation Mapping , and Bioinformatics, Vo pp. 213-226.
doi:10.1002/(SICI)1097-0134(199702)27:2<213::AID-P ROT8>3.0.CO;2-G
[2] D. Shortle, K
Low-Energy Conformations near the Native Structures o
Small Proteins,” Pr
. T. Simons and D. Baker, “Clustering of f
oceedings of the National Academy
Sciences of the USA, Vol. 95, No. 19, 1998, pp. 11158-
11162. doi:10.1073/pnas.95.19.11158
[3] M. R. Betancourt and J. Skolnick, “Finding the Needle in a Haystack: Educing Native Folds from Ambiguous Ab initio Protein Structure Predictions,” Journal of Compu-tational Chemistry, Vol. 22, No. 3, 2001, pp. 339-353. doi:10.1002/1096-987X(200102)22:3<339::AID-JCC100 6>3.0.CO;2-R
[4] J. B. Holmes and J. Tsai, “Some Fundamental Aspects Building Protein Structures from Fragment Libraries,”
Protein Science
of
, Vol. 13, No. 6, 2004, pp. 1636-1650. doi:10.1110/ps.03494504
[5] H. Li and Y. Zhou, “Fold Helical Proteins by Energy Minimization in Dihedral Space and a Dfire-Based Sta tical Energy Function,” Journa
tis-l of Bioinformatics and
Computational Biology, Vol. 3, No. 5, 2005, pp. 1151-
1170. doi:10.1142/S0219720005001430
[6] J. Fetrow, M. Palumbo and G. Berg, “Patterns, Structures, and Amino Acid Frequencies in Structural Building Blocks, a Protein Secondary Structure Classification Scheme,” Pro- teins, Vol. 27, No. 2, 1997, pp. 249-271.
doi:10.1002/(SICI)1097-0134(199702)27:2<249::AID-P ROT11>3.3.CO;2-X
[7] O. Sander, I. Sommer and T. Lengauer, “Local Protein Structure Prediction Using Discriminative Models,” BMC Bioinformatics, Vol. 7, 2006, p. 14.
doi:10.1186/1471-2105-7-14
[8] J. Hartigan, “Clustering Algorithms,” John Wiley & Sons, New York, 1975.
[9] M. J. Rooman, J. Rodriguez and S. J. Wodak, “Automatic
Molecular Biology, Vol. 213, No. 2,
Definition of Recurrent Local Structure Motifs in Pro-teins,” Journal of
1990, pp. 327-336. doi:10.1016/S0022-2836(05)80194-9 [10] F. Cohen and M. Sternberg, “On the Prediction of Protein
Structure: The Significance of the Root-Mean-Square De- viation,” Journal of Molecular Biology, Vol. 138, No. 2, 1980, pp. 321-333. doi:10.1016/0022-2836(80)90289-2 [11] H. Li and Y. Zhou, “Scud: Fast Structure Clustering of
Decoys Using Reference State to Remove Overall Rota-tion,” Journal of Computional Chemistry, Vol. 26, No. 11, 2005, pp. 1189-1192. doi:10.1002/jcc.20251
[12] M. P. Jacobson, D. L. Pincus, C. S. Rapp, T. J. F. Day, B. Honig, D. E. Shaw and R. A. Friesner, “A Hierarchical Approach to All-Atom Protein Loop Prediction,” Proteins:
Structure, Function, and Bioinformatics, Vol. 55, No. 2, 2004, pp. 351-367. doi:10.1002/prot.10613
[13] L. David, “Linear Algebra and Its Applications,” 3rd Edi- tion, Addison-Wesley, New York, 2002.
[14] J. C. Gower, “Some Distance Properties of Latent Root
5-338.
and Vector Methods Used in Multivarient Analysis,”
Biometrika, Vol. 53, No. 3-4, 1966, pp. 32 doi:10.1093/biomet/53.3-4.325
rfaces,” Science
Multidimensional Potential Energy Su , Vol. 271, No. 5251, 1996, pp. 963-965.
doi:10.1126/science.271.5251.963
[17] J. N. Onuchic, Z. L. Schulten and P. G. Wolynes, “The-ory of Protein Folding: The Energy La
tive,” Annual Reviews of Physica
ndscape
Perspec-l Chemistry, Vol. 48, 1997, pp. 545-600.
doi:10.1146/annurev.physchem.48.1.545
[18] N. Kamiya, J. Higo and H. Nakamura, “Conformational Transition States of
dered and Disordered Conformations in Ea β-Hairpin Peptide between the Or-xplicit Water,”
Protein Science, Vol. 11, No. 10, 2002, pp. 2297-2307. doi:10.1110/ps.0213102
[19] T. Ichiye and M. Karplus, “Collective Motions in Proteins: A Covariance Analysis of Atomic Fluctuations in M lecular Dynamics and N
o-ormal Mode Simulations,” Pro-teins: Structure, Function, and Bioinformatics, Vol. 11, No. 3, 1991, pp. 205-217. doi:10.1002/prot.340110305 [20] A. E. Garcia, “Large-Amplitude Nonlinear Motions in
Proteins,” Physical Review Letters, Vol. 68, No. 17, 1992, pp. 2696-2699. doi:10.1103/PhysRevLett.68.2696 [21] U. Schieborr and H. Ruterjans, “Bias-Free Separation of
Internal and Overall Motion of Biomolecules,” Proteins:
Structure, Function, and Bioinformatics, Vol. 45, No. 3, 2001, pp. 207-218. doi:10.1002/prot.1141
[22] N. Kannan and S. Vishveshwara, “Identification of Side- Chain Clusters in Protein Structures by a Graph Spectral Method,” Journal of Molecular Biology, Vol. 292, No. 2, 1999, pp. 441-464. doi:10.1006/jmbi.1999.3058
[23] P. Koehl and M. Levitt, “Improved Recognition of Na-tive-Like Protein Structures Using a Family of Designed Sequences,” Proceedings of National Academy Sciences of USA, Vol. 99, No. 2, 2002, pp. 691-696.
doi:10.1073/pnas.022408799
[24] E. G. Emberly, R. Mukhopadhyay, N. S. Wingreen and C. Tang, “Flexibility of α-Helices: Results o
Analysis of Database Protein Structures,” Journal of Mo-f a Statistical lecular Biology, Vol. 327, No. 1, 2003, pp. 229-237. doi:10.1016/S0022-2836(03)00097-4
[25] J. C. Liao, R. Boscolo, Y.-L. Yang, L. M. Tran, C. Sabatti and V. Roychowdhury, “Network Component Anal Reconstruction of Regulatory Signals in Biological Sys-ysis: tems,” Proceedings of National Academy Sciences of USA, Vol. 100, No. 26, 2003, pp. 15522-15527.
doi:10.1073/pnas.2136632100
[26] U. Bastolla, M. Porto, H. E. Roman and M. Vendruscolo, “Principal Eigenvector of Contact Matric
phobicity Profiles in Proteins,”
es and
Hydro-Proteins: Structure,
Func-BMC tion, and Bioinformatics, Vol. 58, 2005, pp. 22-30. [27] K. Ikeda, T. Hirokawa, J. Higo and K. Tomii, “Protein-
Segment Universe Exhibiting Transitions at Intermediate Segment Length in Conformational Subspaces,”
Structural Biology, Vol. 8, 2008, pp. 37-54. doi:10.1186/1472-6807-8-37
[28] H. Shen, F. Xu, H. Hu, F. Wang, Q. Wu, Q. Wang, “Coevolving Residues
Huang and H. of (β/α)8-Barrel Proteins Play Roles in Stabilizing Active Site Architecture and Coordinating Protein Dynamics,” Journal of Structural Biology, Vol. 164, No. 3, 2008, pp. 281-292.
doi:10.1016/j.jsb.2008.09.003
[29] N. Elmaci and R. S. Berry, “Principal Coordi sis on a Protein Model,” Jour
nate
Analy-nal of Chemical Physics, Vol. 110, No. 21, 1999, pp. 10606-10622.
doi:10.1063/1.478992
[30] R. Abseher and M. Nilges, “Are There N namics Cross-Correlati
on-Trival Dy-ons in Proteins?” Journal of Mo-lecular Biology, Vol. 279, No. 4, 1998, pp. 911-920. doi:10.1006/jmbi.1998.1807
[31] D. M. F. V. Aalten, B. L. D. Groot, J. B. C. Findlay, C. Berendsen and A. Amade
H. J. i, “A Comparision of Tech-niques for Calculating Protein Essential Dynamics,”
Journal of Computional Chemistry, Vol. 18, No. 2, 1997,
pp. 169-181.
doi:10.1002/(SICI)1096-987X(19970130)18:2<169::AID -JCC3>3.0.CO;2-T
evealed by Dihedral Angle Principal [32] Y. Mu, P. H. Nguyen and G. Stock, “Energy Landscape
of a Small Peptide R
Component Analysis,” Proteins: Structure, Function, and Bioinformatics, Vol. 58, No. 1, 2005, pp. 45-52.
doi:10.1002/prot.20310
[33] M. Nanias, M. Chinchio, J. Pillardy, D. R. Ripo A. Scheraga, “Packing H
ll and H. elices in Proteins by Global Op-timization of a Potential Energy Function,” Proceedings
of National Academy of Sciences of the USA, Vol. 100,
No. 4, 2003, pp. 1706-1710. doi:10.1073/pnas.252760199 [34] C. Zhang, J. Hou and S. H. Kim, “Fold Prediction of
Helical Proteins Using Torsion Angle Dynamics and Pre-dicted Restraints,” Proceedings of National Academy of Sciences of the USA, Vol. 99, No. 6, 2002, pp. 3581-3585. doi:10.1073/pnas.052003799
[35] H. Zhou and Y. Zhou, “Distance-Scaled, Finite Ideal-Gas Reference State Improves Structure-Derived Potentials of Mean Force for Structure Selection and Stability Predic-tion,” Protein Science, Vol. 12, No. 9, 2003, p. 2121. doi:10.1002/pro.122121
[36] Y. Zhang and J. Skolnick, “Spicker: A Clustering proach to Identify Near-N
Ap-ative Protein Folds,” Journal of
Computional Chemistry, Vol. 25, No. 6, 2004, pp. 865-
871. doi:10.1002/jcc.20011
[37] J. J. Prompers and R. Bruschweiler, “Dynamic and Structural Analysis of Isotropically Distributed Molecular Ensembles,” Proteins: Structure, Function, and Bioin-formatics, Vol. 46, No. 2, 2002, pp. 177-189.