Predicting Testing Effort Using Artificial
Neural Network
Yogesh Singh, Arvinder Kaur, Ruchika Malhotra
Abstract— The importance of software quality is
becoming a motivating force for the development of techniques like Artificial Neural Network (ANN), which are being used for the design of prediction models of quality attributes. The purpose of this work is to examine the application of ANN for software quality prediction using Object-Oriented (OO) metrics. Testing effort has been predicted using ANN method and independent variables are OO metrics given by Chidamber and Kemerer. The public domain NASA data has been used to find the relationship between OO metrics and testing effort. The model has estimated testing effort within 35 percent of the actual effort in more than 72.54 percent of the classes, and with a MARE of 0.25. The results are quite interesting, however, more similar types of studies are required to be carried out with large data sets in order to establish the acceptability of the model.
Keywords— Software quality, Measurement,
Metrics, Artificial neural network, Coupling, Cohesion, Inheritance, Principal component analysis
I. INTRODUCTION
There are several metrics available in the literature to capture the quality of OO design and code, for example, (Aggarwal et al. [13]; Briand et al., [14, 15]; Bieman and Kang [7]; Cartwright and Shepperd [17]; Chidamber and Kemerer [21, 22]; Harrison et al. [20]; Henderson-sellers [3]; Hitz and Montazeri [18]; Lake and Cook [2]; Li and Henry [27]; Lee et al. [28] Lorenz and Kidd [19]; Tegarden et al [5]).
These metrics provide ways to evaluate the quality of software and their use in earlier phases of software development that can help organizations in assessing large software development quickly, at a reasonable cost.
Manuscript received June 16, 2008..
Prof. Yogesh Singh is with GGS Indraprastha University, Delhi, India (email: [email protected])
Dr. Arvinder Kaur is with GGS Indraprastha University, Delhi, India (e-mail: [email protected].)
Ruchika Malhotra (Corresponding Author phone: 91-011-26431421) is with GGS Indraprastha University, Delhi, India (email: [email protected])
But how do we know which metrics are useful in capturing important quality attributes such as fault-proneness, effort, productivity or amount of maintenance modifications? An empirical study of real systems may provide relevant answers. There have been empirical studies evaluating the impact of OO metrics on software quality and constructing models that utilize them in predicting quality attributes in the system, such as (Basili et al. [26]; Binkley and Schach [1]; Briand et al [16]; Cartwright and Shepperd [17]; Chidamber and Kemerer [23]; El Emam et al. [9]; Gyimothy et al. [24]; Harrison et al. [20]; Li and Henry [27]; Ping et al. [29]).
Khoshgaftaar et al. [25] introduced the use of the neural networks as a tool for predicting software quality. In their study, they presented a large telecommunications system, classifying modules as fault prone or not fault prone. They compared the ANN model with a non-parametric discriminant model, and found that ANN model had better predictive accuracy. We conduct our study in the OO paradigm. However, since the OO paradigm is different from procedural paradigm, different software design metrics have to be defined and used. We explore the relationship between these design metrics and testing effort. Our ANN model aims to predict OO software quality by estimating the number of lines added or changed per class throughout the life cycle of the defect.
Unlike regression approaches, which fit the data to a descriptive function, in ANN the input data is transformed on each layer, changing the dimensional space to define the rule to get to the decision region. Thus, the regression and ANN approaches are inherently different, raising the question to evaluate performance of ANN approach. To investigate this question, the performance of ANN method was analysed in the study for predicting testing effort. The public domain NASA data set is used in this study to empirically evaluate the relationship of OO software metrics with number of lines changed per class.
summarizes the metrics studied and describes the sources from which data is collected. Section 4 presents the research methodology followed in this paper. The results of the study are given in section 5. Conclusions of the research are presented in section 6.
II. RELATED WORK
Based on a study of eight medium-sized systems, developed by students Basili et al. [26] found that several of the Chidamber and Kemerer metrics were associated with fault proneness. Briand et al. [18] empirically explored the relationship between OO metrics and the probability of fault detection in system classes. Their results indicated that very accurate prediction models could be derived to predict faulty classes.
Yu et al. [29] chose eight metrics, and they examined the relationship between these metrics and the fault-proneness. The subject system was the client side of a large network service management system developed by three professional software engineers. It was written in Java consisting of 123 classes and around 34,000 lines of code. First, they examined the correlation among the metrics and found four highly correlated subsets. Then, they used univariate analysis to find out which metrics could detect faults and which could not.
Gyimothy et al. [24] empirically validated Chidamber and Kemerer [21] metrics on open source software for fault prediction. They employed regression (linear and logistic regression) and machine learning methods (neural network and decision tree) for model prediction.
Most of these prediction models are built using statistical models. ANN has seen an explosion of interest over the years, and is being successfully applied across a range of problem domains such as finance, medicine, engineering, geology and physics. Indeed, neural networks are being introduced to solve the problems of prediction, classification, or control. ANN can be used as a predictive model because it is very sophisticated modeling technique and is capable of modeling complex functions.
Khoshgoftaar et al. [25] presented a case study of real-time avionics software to predict the testability of each module from static measurements of source code. They found that ANN is a promising technique for building predictive models, because they can model nonlinear relationships.
The ANN model built in our study aims to predict software quality by estimating the number of lines changed per class.
III. RESEARCH BACKGROUND
In this work, we empirically validate OO metrics given by Chidamber and Kemerer [21]. The dependent variable is testing effort measured in terms of lines of code added or changed during the life cycle of a defect. In this section, we present the summary of dependent and independent variables chosen in this paper (Section A) and the description about the empirical data collection is provided in Section B.
A. Dependent and Independent Variables
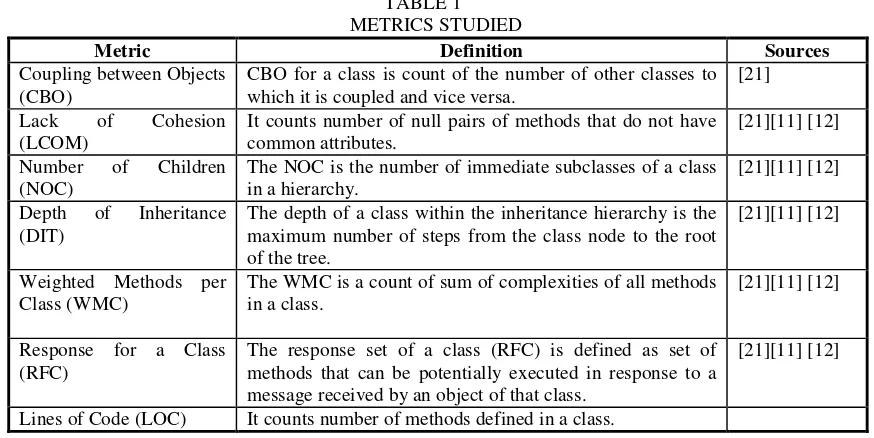
The continuous dependent variable in our study is testing effort. The goal of our study is to empirically explore the relationship between OO metrics and testing effort at the class level. We use ANN to predict testing effort per class. Testing effort is defined as lines of code changed or added throughput the life cycle of the defect per class. The independent variables are OO metrics chosen for this study. The metrics selected in this study are summarized in Table 1.
B. Empirical Data Collection
This study makes use of public domain data set KC1 from the NASA Metrics Data Program [38]. The data in KC1 was collected from a storage management system for receiving/processing ground data, which was implemented in the C++ programming language. This system consists of 145 classes that comprise of 2107 methods, with a total of 40K lines of code. KC1 provides both class-level and method-level static metrics. At the method level, 21 software product metrics based on product’s complexity, size and vocabulary are given. The testing effort is measured by using the number of lines changed per class. At the class level, values of 10 metrics are computed including seven metrics given by Chidamber and Kemerer [21]. These OO metrics are taken in our study (see Table 1) for analysis. In KC1 three files are of particular interest, one representing the association between classes and modules, second representing association between modules and defects and third representing association between defects and lines of code added or changed.
TABLE 1 METRICS STUDIED
Metric Definition Sources
Coupling between Objects (CBO)
CBO for a class is count of the number of other classes to which it is coupled and vice versa.
[21]
Lack of Cohesion (LCOM)
It counts number of null pairs of methods that do not have common attributes.
[21][11] [12]
Number of Children (NOC)
The NOC is the number of immediate subclasses of a class in a hierarchy.
[21][11] [12]
Depth of Inheritance (DIT)
The depth of a class within the inheritance hierarchy is the maximum number of steps from the class node to the root of the tree.
[21][11] [12]
Weighted Methods per Class (WMC)
The WMC is a count of sum of complexities of all methods in a class.
[21][11] [12]
Response for a Class (RFC)
The response set of a class (RFC) is defined as set of methods that can be potentially executed in response to a message received by an object of that class.
[21][11] [12]
Lines of Code (LOC) It counts number of methods defined in a class.
IV. RESEARCH METHODOLOGY
We used the following methodology in this study: 1. The input metrics were normalized using
min-max normalization. Min-min-max normalization performs a linear transformation on the original data [8]. Suppose that minA and maxA are the minimum and maximum values of an attribute A. It maps value v of A to v’ in the range 0 to 1 using the formula:
A A
A
v v
min max
min '
− −
= (1)
2. Perform principal components analysis on the OO metrics to determine whether these metrics are independent or are capturing the same underlying property of the object being measured. 3. Perform univariate analysis to find the individual
effect of each metrics on the lines of code added or changed.
4. Develop ANN model based on training data sets. 5. Apply the ANN model to validate data set in
order to evaluate the accuracy of the model. In order to predict accuracy of a model it should be applied on different data sets. We therefore performed k-cross validation of models [16]. The data set is randomly divided into k subsets. Each time one of the k subsets is used as the test set and the other k-1 subsets are used to form a
training set. Hence, we get the fault proneness for all the k classes.
A. ANN Modeling
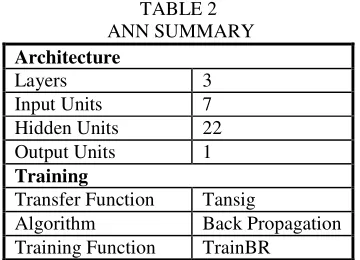
The network used in this work belongs to Multilayer Feed Forward networks and is referred to as M-H-Q network with M source nodes, H nodes in hidden layer and Q nodes in the output layer [10]. The input nodes are connected to every node of the hidden layer but are not directly connected to the output node. Thus, the network does not have any lateral or shortcut connection. The ANN was trained by standard error back propagation algorithm at a learning rate of 0.005, having the minimum square error as the training stopping criterion.
The input layer has one unit for each input variable. Each input value in the data set is normalized within the interval [0, 1] using min-max normalization.
TABLE 2 ANN SUMMARY Architecture
Layers 3
Input Units 7
Hidden Units 22
Output Units 1
Training
Transfer Function Tansig
Algorithm Back Propagation Training Function TrainBR
We performed univariate analysis to find out the metrics that are most important in predicted testing effort. Then we find the combined effect of OO metrics on testing effort using backward elimination method with metrics selected in principal component analysis and univariate analysis. The backward elimination method includes all the independent variables in the model. Variables are deleted one at a time from the model until stopping criteria is fulfilled.
B. Performance Evaluation
In this study, the main measure used for evaluating model performance is the Mean Absolute Relative Error (MARE). MARE is the preferred measure for calculating error and is calculated as follows [6]:
n actual
actual estimate
n
i
÷
−
=
∑
=1
MARE
(2)
where:
estimate is the predicted output by the network for
each observation.
n are the number of observations.
“To establish whether models are biased and tend to over or under estimate, the Mean Relative Error (MRE) is calculated as follows” [6]:
n actual
actual estimate
n
i
÷
−
=
∑
=1
MRE
(3)
A large positive MRE would suggest that the model over estimates the number of lines changed per class, whereas a large negative value will indicate the reverse [6].
Mean Square Error (MSE) is calculated as follows:
(
estimate actual)
nn
i
÷
− =
∑
=1
2
MSE
(4)
V. RESULTS
In this section, we present the results of the analysis performed to find the relationship between OO metrics and testing effort of the classes.
A. ANN Results
In this section, we present the results of univariate and multivariate analysis using ANN method.
Univariate Analysis Results
The Table 3 provides the MSE, MARE, MRE, correlation coefficient (r) between actual and predicted testing effort measured in terms of lines of code added or changed per defect in a class during the software development life cycle, significance of r (p) for each measure.
The predicted lines of code added or changed using SLOC metric are highly correlated with actual lines of code added or changed. Furthermore, the values of MARE (0.02) and MRE (0.31) are lowest for SLOC metric. Hence, it is the best predictor of testing effort. WMC and RFC also show less values of MARE. NOC metric predicted constant values of testing effort, hence value of correlation coefficient (r) could not be calculated. The values of MRE and MARE are very high for NOC and DIT metrics. Hence, these metrics will not be considered in model prediction using ANN method.
TABLE 3
RESULTS OF UNIVARIATE ANALYSIS
Metric MSE MARE MRE r p
CBO 1.284 0.23 0.57 0.796 0.000
LCOM 1.923 0.27 0.61 0.672 0.000
NOC 3.522 0.4 0.9 - -
RFC 1.009 0.04 0.38 0.843 0.000 WMC 0.904 0.03 0.35 0.861 0.000
SLOC 0.737 0.02 0.31 0.888 0.000
DIT 3.03 0.31 0.87 0.377 0.003
Multivariate Analysis Results
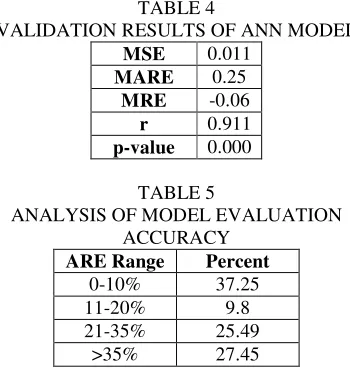
results of ANN model evaluated using 10-cross validation. The correlation between the predicted lines of code changed and the actual lines of code changed is represented by the coefficient of correlation (r). The significant level of a validation is indicated by a value. A commonly accepted p-value is 0.05.
[image:5.595.101.276.253.437.2]When model evaluation is performed using 10-cross validation, the percentage error smaller than 10 percent, 20 percent, and 35 percent is shown in Table 5. The value of MARE and MRE are 0.25 and -0.06 respectively.
TABLE 4
VALIDATION RESULTS OF ANN MODEL
MSE 0.011
MARE 0.25
MRE -0.06
r 0.911
p-value 0.000
TABLE 5
ANALYSIS OF MODEL EVALUATION ACCURACY
The value of correlation coefficient (r) between the predicted lines of code added or changed and the actual lines of code added or changed is 0.911. This means the predicted testing effort and actual testing effort are highly correlated. Thus, the results show that the accuracy of the model predicted using ANN is good.
Figure 1 shows the relationship between actual and predicted number of lines added or changed per class. Figure 2 shows the squared error (in percent) of model predicted, for each data point. From the result shown in Figure 1 and Figure 2 and Table 5, it is observed that the predicted values are in good agreement with actual values and the predicted error is less. Therefore, the proposed ANN model with the developed structure shown in Table 2 can perform good prediction with least error. We conclude that impact of prediction is valid for this data set.
VI. CONCLUSIONS
This empirical study presents the prediction of testing effort using ANN technique. We conducted an empirical analysis of the Chidamber and
Kemerer OO metric suite. The main goal of our study was to examine ANN method in order to find individual and combined impact of OO metrics on testing effort. We used public domain NASA data set to find the relationship between OO metrics and testing effort measured in terms of number of lines changed or added per class. The results presented above shows that these independent variables appear to be useful in predicting testing effort. The ANN model demonstrated that they were able to estimate testing effort within 35 percent of the actual effort in more than 72.54 percent of the classes, and with a MARE of 0.25. Thus, ANNs have shown their ability to provide an adequate model for predicting testing effort.
The performance of ANN model is to a large degree dependent on the data on which they are trained, and the availability of suitable system data will determine the extent to which testing effort models can be developed. However, these results provide guidance for future research on the use of ANN method to find the impact of OO metrics on fault proneness, further validations are necessary with different systems to draw stronger conclusions. More similar type of studies must be carried out with large data sets to get an accurate measure of performance outside the development population. We further plan to replicate our study to predict models based on other artificial intelligence techniques.
0 500 1000 1500 2000 2500
5 74 97 120
120143235281304327327396419442442488488557649741764856994168422362306
Number of Lines Added or Changed (Actual)
N
u
m
b
e
r
o
f
L
in
e
s
A
d
d
e
d
o
r
C
h
a
n
g
e
d
(
P
re
d
ic
te
d
[image:5.595.307.509.447.604.2]l)
Fig. 1: Comparison between Actual and Predicted values for Testing Effort
ARE Range Percent
0-10% 37.25
11-20% 9.8
21-35% 25.49
0 1 2 3 4 5 6 7 8 9 10
1 3 5 7 9 11 13 15 17 19 21 23 25 27 29 31 33 35 37 39 41 43 45 47 49 51 53 56 58 60
Data Points
S
q
u
a
re
d
E
rr
o
r
(%
[image:6.595.95.286.109.280.2])
Fig 2: Squared Error with respect to each Data Point
REFERENCES
[1] A.Binkley and S.Schach, “Validation of the Coupling Dependency Metric as a risk Predictor”, Proceedings in ICSE 98, 452-455, 1998.
[2] A.Lake, C.Cook, “Use of factor analysis to develop OOP software complexity metrics”. Proc. 6th Annual Oregon Workshop on Software Metrics, Silver Falls, Oregon, 1994.
[3] B.Henderson-sellers, “Object-Oriented Metrics, Measures of Complexity”, Prentice Hall, 1996. [4] C.R.Kothari. “Research Methodology. Methods and
Techniques”, New Age International Limited.
[5] D.Tegarden, S. Sheetz, D.Monarchi, “A Software Complexity Model of Object-Oriented Systems. Decision Support Systems”, vol. 13, pp.241-262. [6] G.Finnie and G. Witting, “AI Tools for Software
Development Effort Estimation”, International Conference on Software Engineering: Education and practice, 1996.
[7] J.Bieman, B.Kang, “Cohesion and Reuse in an Object-Oriented System”, Proc. ACM Symp. Software Reusability (SSR’94), pp.259-262, 1995.
[8] J.Han, M. Kamber, “Data Mining: Concepts and Techniques”, Harchort India Private Limited, 2001. [9] K.El Emam , S.Benlarbi , N.Goel , Rai, “A Validation
of Object-Oriented Metrics”, Technical Report ERB-1063, NRC, 1999.
[10] K.K.Aggarwal, Yogesh Singh, Arvinder Kaur, “A Neural Net Based Approach to Test Oracle”, ACM SIGSOFT, vol. 29, issue 3, 2004.
[11] K.K.Aggarwal, Yogesh Singh, Arvinder Kaur, Ruchika Malhotra, “Analysis of Object-Oriented Metrics”, International Workshop on Software Measurement (IWSM), 2005.
[12] K.K.Aggarwal, Yogesh Singh, Arvinder Kaur, Ruchika Malhotra, “Empirical Study of Object-Oriented Metrics”, Accepted to be published in Journal of Object-Technology.
[13] K.K.Aggarwal, Yogesh Singh, Arvinder Kaur, Ruchika Malhotra, “Software Reuse Metrics for Object-Oriented Systems”, Third ACIS Int'l Conference on Software Engineering Research, Management and Applications (SERA'05), IEEE Computer Society, pp. 48-55, 2005. [14] L.Briand , W.Daly and J. Wust, “Unified Framework for
Cohesion Measurement in Object-Oriented Systems”, Empirical Software Engineering, vol. 3, pp.65-117, 1998.
[15] L.Briand , W.Daly and J. Wust, “A Unified Framework for Coupling Measurement in Object-Oriented Systems. IEEE Transactions on software Engineering”, Vol. 25, pp.91-121, 1999.
[16] L.Briand , W.Daly and J. Wust, “Exploring the relationships between design measures and software quality”, Journal of Systems and Software, Vol. 5, pp.245-273, 2000.
[17] M.Cartwright, M.Shepperd, “An Empirical Investigation of an Object-Oriented Software System”, IEEE Transactions of Software Engineering, 1999. [18] M.Hitz, B. Montazeri, “Measuring Coupling and
Cohesion in Object-Oriented Systems”, Proc. Int. Symposium on Applied Corporate Computing, Monterrey, Mexico, 1995.
[19] M.Lorenz, and J.Kidd, “Object-Oriented Software Metrics”, Prentice-Hall, 1994.
[20] R.Harrison, S.J.Counsell, and R.V.Nithi, “An Evaluation of MOOD set of Object-Oriented Software Metrics”, IEEE Trans. Software Engineering, vol. SE-24, no.6, pp. 491-496, June 1998.
[21] S.Chidamber and C.F.Kemerer, “A metrics Suite for Object-Oriented Design”, IEEE Trans. Software Engineering, vol. SE-20, no.6, 476-493, 1994. [22] S.Chidamber, C. Kemerer, “Towards a Metrics Suite for
Object Oriented design”. Proc. Conference on Object-Oriented Programming: Systems, Languages and Applications (OOPSLA’91). Published in SIGPLAN Notices, vol 26 no. 11, pp.197-211, 1991.
[23] S.Chidamber, D. Darcy, C. Kemerer, “Managerial use of Metrics for Object-Oriented Software: An Exploratory Analysis”, IEEE Transactions on Software Engineering, vol.24 no.8, 629-639, 1998.
[24] T.Gyimothy , R.Ferenc , I.Siket , “Empirical validation of object-oriented metrics on open source software for fault prediction”, IEEE Trans. Software Engineering, vol. 31, Issue 10, pp.897 – 910, Oct. 2005.
[25] T.M.Khoshgaftaar, E.D.Allen, J.P Hudepohl, S.J Aud,., "Application of neural networks to software quality modeling of a very large telecommunications system," IEEE Transactions on Neural Networks, Vol. 8, No. 4, pp. 902--909, 1997.
[26] V.Basili, L.Briand, W.Melo, “A Validation of Object-Oriented Design Metrics as Quality Indicators”, IEEE Transactions on Software Engineering, vol. 22 no.10, pp. 751-761, 1996.
[27] W.Li, S.Henry, “Object-Oriented Metrics that Predict Maintainability”, Journal of Systems and Software, vol 23 no.2, pp.111-122, 1993.
[28] Y.Lee, B.Liang, S.Wu and F.Wang, “Measuring the Coupling and Cohesion of an Object-Oriented program based on Information flow”, 1995.