University of Warwick institutional repository: http://go.warwick.ac.uk/wrap
A Thesis Submitted for the Degree of PhD at the University of Warwick
http://go.warwick.ac.uk/wrap/61954
This thesis is made available online and is protected by original copyright. Please scroll down to view the document itself.
Development of an X-ray Excited Optical
Luminescence Microscope (XEOM)
by
Matthew J. Hand
Thesis
Submitted to the University of Warwick
for the degree of
Doctor of Philosophy
Department of Physics
Contents
Acknowledgments viii
Declarations x
Abstract xi
Abbreviations xii
Chapter 1 Introduction 1
1.1 Science for Protecting Our Cultural Heritage . . . 1
1.2 Analytical Techniques In Conservation Science . . . 3
1.3 A Microscope on the Past . . . 7
1.4 Thesis Scope . . . 8
1.5 Summary. . . 10
Chapter 2 Background & Theory 13 2.1 Synchrotron Radiation . . . 13
2.1.1 Synchrotron Radiation Facilities. . . 15
2.1.2 Natural Sources of Synchrotron Radiation . . . 19
2.2 X-ray Absorption Spectroscopy. . . 20
2.2.1 Principles of X-ray Absorption . . . 21
2.2.2 Extended X-ray Absorption Fine Structure . . . 24
2.2.3 X-ray Absorption Near-Edge Structure . . . 27
2.2.4 Detection Modes . . . 30
2.3 X-ray Excited Optical Luminescence . . . 31
2.3.1 XEOL Processes . . . 31
2.3.2 XEOL-XAS . . . 36
2.4 Previous work — ODXAS1 . . . 40
2.5 Summary. . . 42
Chapter 3 XEOM Design & Construction 48 3.1 Optics . . . 48
3.1.1 Design Considerations . . . 48
3.1.2 Lens Design and Simulation . . . 50
3.1.3 Evaluation of Optics . . . 54
3.2 Hardware. . . 57
3.2.1 Optical Column . . . 57
3.2.2 Detectors . . . 61
3.2.3 Auxiliary Components . . . 65
3.2.4 Control and Data Acquisition. . . 65
3.2.5 Electronics Interface Unit . . . 66
3.3 Control Software . . . 70
3.3.1 eCell Controller Overview. . . 70
3.3.2 Imaging Functionality . . . 71
3.3.3 Hardware Control . . . 74
3.3.4 Operational Modes . . . 75
3.3.5 Image Pre-processing . . . 78
3.4 Data Handling. . . 81
3.4.1 ECCD Image Format. . . 81
3.4.2 Data Storage Considerations . . . 82
3.5 Summary. . . 83
Chapter 4 Experimental Testing & Development 85 4.1 XEOM1 Setup . . . 86
4.1.1 Setup on BM28 XMaS . . . 88
4.1.2 Setup on BM26A DUBBLE . . . 88
4.1.3 Synchronization of Data Acquisition . . . 91
4.2 Samples . . . 93
4.2.1 Copper Coupons . . . 94
4.2.2 TEM Meshes. . . 94
4.2.3 Corrosion Protocols . . . 95
4.3.1 esaProject . . . 97
4.3.2 Athena . . . 99
4.4 Assessment of Microscope Characteristics . . . .101
4.4.1 First XEOM1 Images. . . .101
4.4.2 Sensor Defects . . . .103
4.4.3 Selection of the Large-area Sensor Camera. . . .105
4.5 Filtered Imaging and Focusing . . . .109
4.5.1 Dichroic Filters. . . .111
4.5.2 Filtered Imaging Characteristics . . . .111
4.5.3 Fluorescence Line Filters . . . .115
4.6 Chemical Mapping . . . .117
4.6.1 Difference Maps. . . .118
4.6.2 Image Stacks . . . .118
4.7 Summary. . . .129
Chapter 5 Further Work 132 5.1 XEOL Spectroscopy. . . .132
5.2 New Optics Concept . . . .134
5.3 Filter Wheel . . . .135
5.4 X-ray Beam Effects . . . .136
5.5 Data Processing . . . .137
5.5.1 Linear Combination Fitting and Principal Component Analysis . . . .139
5.6 eCell . . . .139
5.7 Beyond Heritage Science . . . .141
5.8 Summary. . . .141
Chapter 6 Conclusions 144 6.1 Project Summary. . . .144
6.2 Beam Time Allocations . . . .146
6.3 Implications For Previous Results . . . .147
6.4 Final Thoughts . . . .148
List of Tables
3.1 FLI Microline ML1109 spectroscopy CCD camera specifications 62 3.2 Andor iKon-L large area sensor CCD camera specifications . . 63
3.3 Agilent U2353A technical specifications.. . . 67
4.1 Beamline specifications for BM28 XMaS and BM26A DUBBLE 86 4.2 Comparison of CCD camera candidate specifications . . . .107
4.3 Manufacturer specifications for Edmund Optics dichroic filters.111
4.4 Manufacturer specifications for Schott UG1 and KG1 filters . .113
List of Figures
1.1 XRF analysis of a 16th-century salt cellar . . . 4
2.1 Emission of synchrotron radiation by a charged particle . . . 14
2.2 Schematic of a synchrotron radiation facility . . . 16
2.3 Crab nebula (M1) . . . 19
2.4 Mass attenuation coefficient for copper and lead . . . 20
2.5 Schematic of X-ray fluorescence and Auger emission . . . 22
2.6 Example Cu X-ray absorption spectrum illustrating key regions 24 2.7 Illustration of photoelectron scattering from nearest-neighbour atom which gives rise to the EXAFS oscillations. . . 25
2.8 XANES spectra of copper and two of its oxides . . . 28
2.9 Schematic energy level diagram of XEOL processes. . . 32
2.10 XEOL spectra of PbCl demonstrating negative edge step. . . . 38
2.11 ODXAS1 deployed on BM28 XMaS . . . 41
3.1 Screenshot of OSLO main interface. . . 51
3.2 Evolution of the XEOM1 lens design . . . 53
3.3 Isometric view of final XEOM1 lens layout . . . 54
3.4 Ray intercept diagram of XEOM1 optics . . . 55
3.5 Minimum RMS OPD with relative lens position. . . 56
3.6 3D section view of XEOM1 optical column . . . 58
3.7 Photograph of XEOM1 sample stub end cap . . . 59
3.8 Photos of sample holders . . . 60
3.9 Quantum efficiency curves for the Hamamatsu S10140-1009 and e2v CCD42-40 NIMO CCD sensors. . . 64
3.10 Functional block diagram of electronics interface unit . . . 68
3.11 Photos of electronics interface unit . . . 69
3.13 Screenshot of eCell Controller trigger capture dialog . . . 77
4.1 X-ray optics on BM28 XMaS and BM26A DUBBLE . . . 87
4.2 Photograph of XEOM1 on BM28 XMaS . . . 89
4.3 Photograph of XEOM1 on BM26A DUBBLE . . . 90
4.4 XEOL-XANES spectra of tenorite-coated copper coupon, cuprite powder and tenorite powder. . . 95
4.5 Screenshot of the esaProject XEOM Image Stack Processor window . . . 97
4.6 Screenshots of Athena data analysis and plotting windows. . .100
4.7 First XEOM image test — filament lamp . . . .101
4.8 Beam alignment using X-ray fluorescent paper . . . .102
4.9 First XEOM image — tenorite mesh . . . .103
4.10 Demonstration of reflection artefacts in FLI camera images . .104
4.11 Close-up photo of Hamamatsu sensor defects . . . .106
4.12 Comparison of dark current for candidate CCD sensors. . . . .108
4.13 Green and green+envelope filtered images of cuprite-coated grid. . . .112
4.14 Edmund Optics dichroic filter optical density and transmission profiles . . . .114
4.15 Edmund Optics TECHSPEC® fluorescence filter optical den-sity and transmission profiles . . . .116
4.16 Difference map of topological insulator Cu0.12Bi2Se3 . . . .119
4.17 XEOM image of cuprite-coated mesh affixed to nantokite-coated coupon . . . .120
4.18 First XEOL spectrum extracted from an image stack acquired using XEOM1 . . . .121
4.19 ROIs used for extraction of spectra from cuprite-coated grid image stack . . . .122
4.20 XEOL spectra extracted from image stack of cuprite-coated grid123 4.21 Filtered images of nantokite-coated grid on cuprite-coated coupon indicating ROIs used for spectrum extraction . . . .124
4.23 ROI spectra extracted from filtered images stacks of nantokite grid on cuprite coupon (raw) . . . .128
5.1 Spectroscopy arm concept design. . . .133
Acknowledgments
Of course, the most thanks must go to my supervisor, Prof. Mark Dowsett. Apart from providing me with invaluable guidance and support, without his tireless ef-forts in his mechanical workshop (read: garage) construction of the microscope would simply not have been possible. The input of our close colleague and my co-supervisor, Prof. Annemie Adriaens, is also greatly appreciated.
Thanks also to the beamline staff who acted as local contacts for their assistance in carrying out experiments: Paul Thompson (XMaS), Simon Brown (XMaS), Miguel Silveira (DUBBLE), and Sergey Nikitenko (DUBBLE). I’d like to give an extra special thanks to Paul who’s creative thinking and willingness to offer support during beam times has been nothing short of extraordinary.
Declarations
Abstract
X-ray excited optical luminescence (XEOL) refers to the trans-visible emis-sion produced as a consequence of X-ray bombardment and provides an al-ternative detection method for X-ray absorption spectroscopy (XAS). Whereas XAS measured by conventional means (absorption, X-ray fluorescence) gener-ally yields spectra characteristic of the bulk, the shallow escape depth of visible photons provides surface specificity of∼200 nm. Combining this with the rel-ative ease of manipulating the emission using conventional optics gives us the basis for a method of mapping surface chemical states on the micron scale — XEOL microscopy (XEOM).
As part of an ongoing project looking into the use of XEOL to study the chemical systems relevant to the corrosion of heritage artefacts, a portable XEOM instrument, XEOM1, has been constructed. Here, a detailed account of the development process is given, including descriptions of the microscope it-self (optics, detectors, auxiliary hardware) and of its support system (control electronics and software). Data processing challenges are also discussed.
Abbreviations
EIU Electronics Interface Unit
ESRF European Synchrotron Radiation Facility
EXAFS Extended X-ray absorption fine structure
OPD Optical path difference
OSLO Optics Software for Layout and Optimization
PIXE Particle-induced X-ray emission
SIMS Secondary ion mass spectrometry
UVFS UV-grade fused silica
XANES X-ray absorption near-edge structure
XAS X-ray absorption spectroscopy
XEOL X-ray excited optical luminescence
Chapter 1
Introduction
1.1
Science for Protecting Our Cultural Heritage
Heritage science is no stranger to the use of analytical techniques to further our understanding of historical objects. By studying the composition and structure of the materials in heritage artefacts, information can be gained about their provenance and the techniques used to manufacture them. This in turn can give insights into the lives of those people who produced and used these objects. Such techniques are also used to study corrosion on heritage artefacts in order to develop protective treatments and to preserve them for future generations to appreciate. This thesis concerns the development of instrumentation for a novel surface chemical mapping technique for applications in this and other areas.
The most obvious and crucial requirement for a protective coating is that it is effective at passivating active corrosion and preventing further damage. Beyond this, there some further characteristics which are highly desirable if the coating is to be applied to a heritage artefact.
Removable/re-treatable
Preserve the aesthetics of the object
The field of cultural heritage is driven by a set of ethical concerns which define the acceptable practice when working with heritage artefacts. Ex-cept in very specific cases, it is undesirable for any protective coating to influence the look of an object in any significant way. This is especially true when the artefact is to be put on display.
Ease of application
It would not be unusual for application of a protective coating to be done by persons who do not have expertise in scientific methodology, which rules out the use of complex deposition techniques. An example of an ideal coating would be one which could be applied to smaller artefacts by simple dip coating, or to larger objects by ‘painting’ it on with a brush.
Cost and ease of manufacture
As funding for conservation is often very limited, cost is a major concern. Unusual, extremely high purity, or difficult to manufacture component compounds can be expensive and should be avoided. The process by which the treatment itself is produced should also be simple and inexpensive.
Safety
The use of highly toxic chemicals is undesirable. Apart from any health concerns, the cost of using such substances is driven up by the need for special containment equipment or extra personal protection equipment (PPE). Again, those without a practical scientific background will not pos-sess the requisite knowledge for safely dealing with hazardous materials.
Related to aforementioned ethical concerns, there are some characteris-tics which are desirable for any analytical technique which is to be applied to a heritage artefact. Highly invasive techniques should be avoided; that is, any method which requires that a large sample be removed from the artefact or re-quires that the object be placed in a harsh environment e.g. vacuum techniques. The technique should also be non-destructive if it is to be applied directly to an artefact — causing damage or discolouration is equally objectionable. In certain circumstances it can be acceptable to take a very small sample from a discreet location on the object, but the preference would be to avoid this.
Recent work in this area, undertaken by a collaboration between the An-alytical Science Projects group at the University of Warwick and the Department of Analytical Chemistry at Ghent University, Belgium, has related to the devel-opment of protection systems (chemical coatings) for metallic artefacts. Such objects could be entirely metallic, such as a bronze coin, or have some metal-lic component, such as a steel knife which has a wooden handle. The latter is referred to as a composite. Specific metals of interest have been lead [1, 2], copper[3–5], and silver[6].
1.2
Analytical Techniques In Conservation
Sci-ence
Modern scientists have a wide variety of analytical techniques at their disposal for materials analysis. However, the usefulness of any particular technique is highly dependent on both the sample characteristics and the type of information to be determined. As mentioned above, the unique nature of many historical objects places further limitations on the methods which can be applied in order to study them. The following is a brief overview of some of the more commonly used techniques and the characteristics which make them useful in the context of heritage science.
X-ray fluorescence spectroscopy (XRF)
Figure 1.1: XRF analysis of a 16th-century salt cellar made of gold, ebony and enamel at the Kunsthistorische Museum, Vienna, Austria. Credit: Dean Calma / IAEA
analytical techniques used in heritage science research. Several factors contribute to its appeal: (a) it is relatively inexpensive; (b) only a small amount of training is required in order to interpret the results; (c) very little equipment is required so it is suitable for even the smallest laborato-ries (Figure 1.1) — portable systems can even be taken into the field for in-situ analysis [7, 8].
Particle-induced X-ray emission spectroscopy (PIXE)
increase rapidly, and the requirement of an accelerated particle source lim-its lim-its flexibility[9]. PIXE analysis has been successfully applied to a wide variety of cultural heritage materials including metals, where PIXE com-bined with XRF allowed the authentication of Dacian gold bracelets [10], medieval stained glass[11], tapestries[12], and many more besides.
Secondary ion mass spectrometry (SIMS)
Mono-energetic primary ions (e.g. Ga+, In+, O+2, Cs+) incident on the sample deposit kinetic energy in the solid surface. This initiates a collision cascade which leads to the liberation of atomic or molecular species from the surface of the sample. A fraction of these is ionized during the process, collected by an electric field, and focused into a mass spectrometer for analysis [13]. SIMS can provide trace analysis in the ppm–ppb range, and depth and lateral resolution on the nanometre scale (although not usually simultaneously). However, as with all forms of mass spectrometry, SIMS is inherently a destructive technique. In addition, measurements are performedin vacuoso the artefact must be vacuum-compatible, and should be no larger than a few millimetres in size or a sample must be taken
[14]. Further examples of the use of SIMS in heritage science include the analysis of painting cross-sections [15] and depth profiling of replica Venetian glassware[16].
X-ray absorption spectroscopy (XAS)
X-ray diffraction (XRD)
X-ray diffraction is a fundamental tool in solid state research. Its intrinsic sensitivity to long-range order and symmetry in crystals make it useful not only for identification of compounds, but also for structural analysis of the sample. This includes the texture and orientation of crystalline phases, and the microstructure of the material in terms of crystallite size [18]. The complexity of cultural heritage material resulting from degradation, contamination, and alteration can lead to equally complex diffraction pat-terns making analysis challenging. However, it has been successfully used in the characterization of Romanesque wall paintings [19], and as a tool for in-situ monitoring of conservation coatings for heritage lead[20].
Analytical chemistry
There are several aspects to the application of analytical chemistry tech-niques to cultural heritage science, and electrochemical techtech-niques are em-ployed in many instances[21]. The first is their use for active investigation of chemical processes whereby corrosion is induced in the sample through application of an electrochemical potential — for example, anodic polar-ization has been used to identify chloride-induced corrosion mechanisms in quaternary bronze [22]. Another aspect is their use for monitoring of chemical treatments; monitoring of the corrosion potential has been used to evaluate the effectiveness of storage and stabilization methods applied to archaeological copper artefacts[3]. Finally, they can be used as a direct treatment method, as demonstrated through the electrolytic stabilization of iron cannon recovered from an eighteenth-century frigate[23].
1.3
A Microscope on the Past
As mentioned above, one of the more commonly used analytical techniques to be used for analysis of heritage artefacts is XRF. Spot analysis can be useful in itself, but it is often desirable to know how the composition varies across the surface. By scanning the XRF probe across an area of the sample and recording the spectrum at each point, an elemental map can be produced. While this can be done in a laboratory, the relatively low intensity X-ray sources available re-quire dwell times of typically 5–10 s pixel−1; to scan a 30 cm2at 1 mm resolution will take 5 to 10 days (recent developments[26] in this area utilizing multiple detectors reduce this by approximately a factor of 10). However, extremely fast results can be obtained by carrying out the same analysis using a synchrotron X-ray source, which can generate an X-X-ray flux many orders of magnitude greater than a laboratory source, reducing the scanning time to a matter of hours.
While it is clear that XRF mapping is an extremely useful technique, its characteristics can reduce its suitability in certain situations. The penetration depth of the X-ray probe is difficult to control and highly dependent on the sam-ple composition. The need to use relatively high energy X-rays (up to∼50 keV) in order to excite a wide range of elements leads to penetration depths of tens or even hundreds of microns (although this very feature has been used to great effect to reveal hidden artworks by great painting masters such as Van Gogh
the optical luminescent emission resulting from X-ray bombardment to probe the chemical structure of a sample. Detection of X-ray absorption in this man-ner gives enhanced surface specificity for opaque materials as a consequence of the shallow escape depth of visible photons. However, the property of primary interest for this project is the comparative ease with which the optical emission can be manipulated using conventional optics. This naturally leads to the con-cept of imaging the surface in order to obtain a chemical map of the corrosion products. The process of acquiring chemical data from XEOL microscopy usually requires that a series of images, hereafter referred to as a ‘stack’, be acquired as the X-ray source energy is swept across an ‘absorption edge’ — a sharp rise in absorption when the X-ray excitation energy exceeds the binding energy of an atomic shell. It is in spectra extracted from these images stacks that the chemi-cal information is encoded. A difficulty of the technique is that interpretation of these spectra is can be a significant challenge, and a full treatment requires the use of a sophisticated modelling and fitting procedure. However, XAS spectra are far richer in chemical information so there is potential to gain a much deeper insight into the corrosion systems. An additional requirement for XEOL is the use of a tunable X-ray source so analyses must2 be carried out at synchrotron
radia-tion facility. While this currently precludes the possibility of developing a XEOL microscope for the field until a tunable and portable X-ray source is developed, it still provides an alternative to synchrotron-based XRF analyses.
1.4
Thesis Scope
The work presented in this thesis is part of a project looking into the use of XEOL to study the chemical systems relevant to the corrosion of heritage artefacts. Previously, a portable optically-detected X-ray absorption spectrometer, known as ODXAS1 [30, 31], was constructed and has successfully been used to carry out XEOL spectroscopy analysis. The aim of this project has been to take the next logical step of building a complete XEOL imaging system based on the concept described above.
refers to an optically-detected X-ray absorption spectrum.
Contained herein is an account of the development process for the X-ray exited optical luminescence microscope (XEOM), referred to hereafter as XEOM1. This has included the design of a bespoke optical system, integration of a variety of control and measurement systems, including two CCD spectroscopy cameras, and implementation of a software control solution which synchronizes operation of XEOM1 with synchrotron beamline systems. The complete micro-scope system has been deployed during multiple beam time allocations at which the X-ray absorption data presented here were acquired.
In addition to giving a complete description of the device and its control system, this thesis sets out to answer the following questions:
• Will spectra produced from an image stack be of high enough quality for chemical analysis?
• How does the visible yield compare with fluorescent X-ray yield and what effect do the respective detector characteristics have on the resulting spec-tra?
• With the potential for generation of hundreds of images and spectra, how can all this data be handled in a practical manner?
• How long will a typical measurement take, i.e. what is the potential for measuring fast chemical processes?
• Is it feasible to perform spectroelectrochemical imaging experiments sim-ilar to those previously carried out using ODXAS1, i.e. use in conjunction with an electrochemical cell?
1.5
Summary
In this first chapter the use of analytical techniques for heritage science has been introduced, and restrictions on their use imposed by the unique nature of his-torical objects have been outlined. An overview of some techniques commonly used in this area has also been given. The concept of XEOL microscopy has been introduced and the potential key benefits over the commonly used XRF mapping technique have been highlighted. Finally, an overview of the areas which will be covered in the remainder of the thesis has been given.
References
[1] A Adriaens, et al. Growth and real time corrosion resistance monitoring of lead decanoate coatings. Appl. Surf. Sci., 254(22):7351–7355, 2008.
[2] K De Wael, et al. Electrochemical deposition of dodecanoate on lead in view of an environmentally safe corrosion inhibition. J. Solid State Elec-trochem., 14(3):407–413, March 2009.
[3] K Leyssens, et al. Study of corrosion potential measurements as a means to monitor the storage and stabilisation processes of archaeological copper artifacts. Proc. Met. 2004, pages 332–343, April 2004.
[4] K Leyssens, et al. Simultaneous in situ time resolved SR-XRD and corro-sion potential analyses to monitor the corrocorro-sion on copper. Electrochem. Commun., 7(12):1265–1270, 2005.
[5] A Adriaens, et al. Insights into electrolytic stabilization with weak polariza-tion as treatment for archaeological copper objects. Anal. Bioanal. Chem., 387(3):861–8, 2007.
[6] M G Dowsett, et al. The use of ultra-low-energy dynamic SIMS in the study of the tarnishing of silver. Nucl. Instrum. Meth. B, 239(1-2):51–64, 2005.
[7] R Cesareo, et al. Portable equipment for energy dispersive X-ray fluores-cence analysis of Giotto’s frescoes in the Chapel of the Scrovegni. Nucl. Instrum. Meth. B, 213:703–706, 2004.
[8] C R Appoloni, et al. Study of the pigments elementary chemical
portable X-rays fluorescence system.Nucl. Instrum. Meth. A, 580:710–713, 2007.
[9] H R Verma. Atomic and Nuclear Analytical Methods. Springer, 2007.
[10] B Constantinescu, et al. Micro-SR-XRF and micro-PIXE studies for archae-ological gold identification - The case of Carpathian (Transylvanian) gold and of Dacian bracelets.Nucl. Instrum. Meth. B, 266(10):2325–2328, May 2008.
[11] M Vilarigues and RC da Silva. Ion beam and infrared analysis of medieval stained glass.Appl. Phys. A Mater. Sci. Process., 79(2):373–378, July 2004.
[12] A Manhitaa, et al. Rediscovering the materials of Arraiolos tapestries: fibre
and mordant analysis by SEM-EDS andµ-PIXE. Microsc. Microanal., 14:
91–94, 2008.
[13] M G Dowsett and A Adriaens. The role of SIMS in cultural heritage studies.
Nucl. Instrum. Meth. B, 226(1-2):38–52, 2004.
[14] A Adriaens and M G Dowsett. Applications of SIMS to cultural heritage
studies. Appl. Surf. Sci., 252(19):7096–7101, 2006.
[15] K Keune and J J Boon. Imaging secondary ion mass spectrometry of a paint cross section taken from an early Netherlandish painting by Rogier van der
Weyden. Anal. Chem., 76(5):1374–85, March 2004.
[16] S Fearn, D S McPhail, and V Oakley. Room temperature corrosion of
mu-seum glass: an investigation using low-energy SIMS. Appl. Surf. Sci., 231-232:510–514, June 2004.
[17] M Sandström, et al. Deterioration of the seventeenth-century warship Vasa by internal formation of sulphuric acid. Nature, 415(6874):893–7, Febru-ary 2002.
[18] G Artioli. Science for the cultural heritage: the contribution of X-ray diffraction. Rend. Fis. Acc. Lincei, 24(S1):55–62, October 2012.
[19] N Salvadó, et al. The use of combined synchrotron radiation micro
FT-IR and XRD for the characterization of Romanesque wall paintings. Appl. Phys. A, 90(1):67–73, August 2007.
[20] R Grayburn, et al. Time-lapse synchrotron X-ray diffraction to monitor conservation coatings for heritage lead in atmospheres polluted with oak-emitted volatile organic compounds. Corros. Sci., 82:280–289, 2014.
Methods in Archaeometry, Conservation and Restoration. Springer, 2009.
[22] O Papadopoulou, et al. Surface and interface investigation of electrochem-ically induced corrosion on a quaternary bronze. Surf. Interf. Anal. (early web access), March 2014.
[23] E Guilminot, et al. Electrolytic treatment of archaeological marine chloride impregnated iron objects by remote control. InMet. ’07, 2007.
[24] K Janssens and R Van Grieken, editors. Non-destructive micro analysis of cultural heritage materials, volume 42. Elsevier Science, 2004.
[25] P Dillmann, et al., editors.Corrosion and Conservation of Cultural Heritage Metallic Artefacts. Woodhead Publishing, 2013.
[26] M Alfeld, et al. Optimization of mobile scanning macro-XRF systems for the in situ investigation of historical paintings. J. Anal. At. Spectrom., 26 (5):899, 2011.
[27] M Alfeld, et al. Scanning XRF investigation of a Flower Still Life and its underlying composition from the collection of the Kröller-Müller Museum.
Appl. Phys. A, January 2013.
[28] J Dik, et al. Visualization of a lost painting by Vincent van Gogh using synchrotron radiation based X-ray fluorescence elemental mapping. Anal. Chem., 80(16):6436–42, 2008.
[29] M Alfeld, et al. Visualizing the 17th century underpainting in Portrait of an Old Man by Rembrandt van Rijn using synchrotron-based scanning macro-XRF. Appl. Phys. A, December 2012.
[30] M G Dowsett, et al. Optically detected X-ray absorption spectroscopy
mea-surements as a means of monitoring corrosion layers on copper. Anal.
Chem., 80(22):8717–24, 2008.
[31] A Adriaens, et al. Real time observation of X-ray induced surface
modifica-tion using simultaneous XANES and XEOL-XANES. Anal. Chem., 85(20):
Chapter 2
Background & Theory
Apart from the microscope itself, the most important piece of equipment used to complete the work in this project was the synchrotron. Without this, most of the techniques described here would be extremely impractical, if not impossible. This chapter begins with a brief description of synchrotron radiation and how it is generated for use as a physical probe. This is followed by a more detailed description of X-ray absorption spectroscopy and X-ray excited optical lumines-cence, the specific XAS variant which was used during this project. A history of XEOL as an analytical tool is given, including work completed at the University of Warwick on ODXAS1, the precursor instrument to XEOM1. Further informa-tion on the topics covered in Secinforma-tions 2.1 and 2.2 can be found in[1–3].
2.1
Synchrotron Radiation
highly compressed, a consequence of the relativistic Doppler effect. If the emis-sion of a highly energetic electron (>1 GeV) is observed directly along its axis, the electromagnetic radiation will be in the X-ray regime.
v « c v ≈ c
Figure 2.1: An accelerating charged particle travelling at a sub-relativistic speed emits electromagnetic radiation with a dipole pattern. In contrast, a particle mov-ing at a relativistic velocity, i.e. only a very small amount less than the speed of light, will emit EM radiation in a very narrow cone parallel to its instantaneous velocity vector.
The first observation of this intense emission was in 1947 from the 70 MeV electron synchrotron (hencesynchrotron radiation) at the General Electric Re-search Laboratory, New York, USA. It was initially regarded as a nuisance, an unavoidable energy loss mechanism in particle accelerators. However, an inves-tigation by Tomboulian and Hartman in 1956[4]showed the potential utility of synchrotron radiation, and in 1961 the Synchrotron Ultraviolet Radiation Facil-ity (SURF I) opened its doors. First-generation synchrotron radiation sources, including SURF I, were built onto accelerators which were still primarily desig-nated for high energy or particle physics, so were often referred to asparasitic
facilities. It was not until the development of efficient electron storage rings (Figure 2.2) for long-term operation, that facilities designed specifically for the generation of synchrotron radiation were constructed. The first of these so-called second-generation facilities was the 2 GeV Synchrotron Radiation Source
(SRS) at Daresbury, UK, completed in 1981 [5]. The bending magnets
(dis-cussed further below) used to guide the electrons in their orbit also acted as the primary sources of synchrotron radiation. Since then, advances in storage
ring magnet technology has led to the development of so-called insertion
these manipulate the electron beam to optimize the source brilliance (photon flux per unit frequency, surface area, and solid angle). The inclusion of such insertion devices defines the third generation of synchrotron radiation sources, the first of which to be completed was the European Synchrotron Radiation Fa-cility (ESRF) in Grenoble, France in 1994. With an electron storage ring operat-ing energy of 6.04 GeV, it is the most energetic dedicated synchrotron radiation source in Europe. All the synchrotron experiments related to the project which will be discussed here have been carried out at this facility. More recently con-structed third-generation facilities continue to improve on the performance of older sources in all areas: brilliance, and both spatial resolution (smaller beam footprint) and energy resolution (high degree of monochromaticity). Beyond these, a new fourth generation of synchrotron sources defined by even greater brilliance and coherence is becoming a reality. Candidates for such sources in-clude energy recovery linacs (ERLs) and free electron lasers (FELs). A further 3 to 10 orders of magnitude in peak brilliance could potentially be gained over a modern third generation source[6].
2.1.1
Synchrotron Radiation Facilities
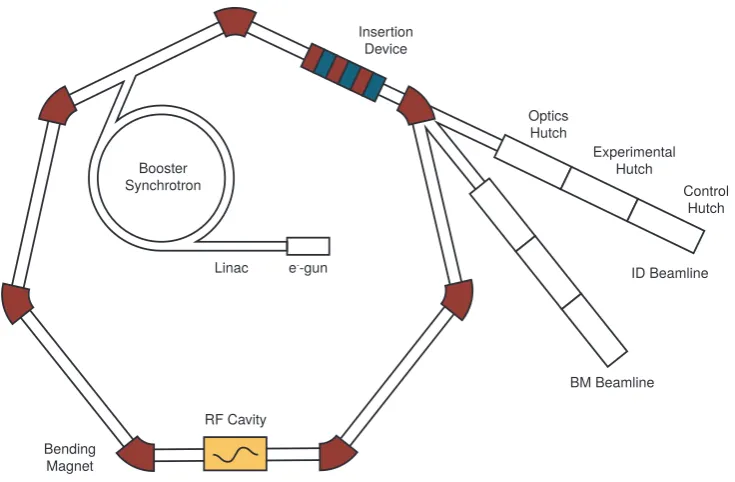
The discussion of dedicated synchrotron radiation facilities will focus on the characteristics and features common to modern third generation sources. Syn-chrotron radiation is generated by electrons which are forced to orbit in a closed path by an array of magnets (the ‘magnet lattice’) at energies in the gigaelectron-volt range. The source of electrons is usually a hot filament in an electron gun which generates electrons by thermionic emission. A linear accelerator (linac) accelerates the electrons up to around 100 MeV. Electrons from the linac travel into a booster synchrotron which further accelerates them up to the energy of the storage ring. From here, the electrons are injected into the storage ring to main-tain its operating current. This occurs periodically, usually when the current falls below about 1−1e ≈70%. During injection, user experiments must usually be
Diamond Light Source[7]— whereby electrons are quasi-continuously injected into the storage ring. Apart from the obvious advantage of allowing for continu-ous operation, this also reduces the thermal stress on beamline optics resulting from repeated changes in X-ray intensity.
Booster Synchrotron
e--gun
Linac
Bending Magnet
RF Cavity
Insertion Device
ID Beamline
BM Beamline Optics
Hutch
Experimental Hutch
[image:30.595.138.506.197.438.2]Control Hutch
Figure 2.2: Schematic illustration of the arrangement of the major components of a modern third generation synchrotron radiation facility (not to scale). The total circumference of the storage ring is often hundreds of metres with beamlines typically 10–30 m in length. In reality, the number of straight sections is much greater than shown here — the ESRF has 32, for example.
Bending magnets
Synchrotron radiation produced at a bending magnet is emitted in a flat-tened cone as the pencil-like beam sweeps around the curve like a search-light. The cone angle is determined by the angular change in path of the electrons, plus a small amount due to the natural photon beam divergence
given by θ ∼ 1/γ, where γ is a dimensionless parameter known as the
Lorentz factor given by γ = E/mc2, with E the storage ring energy, and
mc2the electron rest mass energy (511 keV). For typical storage ring
ener-gies θ is in the range 0.06–0.5 mrad. The narrow beam passes the
beam-line aperture in a time ∆t which, from the general property of Fourier transforms, leads to a characteristic critical frequency ωc. Therefore, the
emitted spectrum of bending magnet radiation is very broad with a sharp cut-off in spectral intensity for photon frequencies greater thanωc∼γ3ω,
where ω is the angular frequency of the electron orbit. A photon flux of 1012–1014s−1could be expected from a bending magnet source, some 4–5
orders of magnitude greater than a laboratory source.
Insertion devices
Insertion devices (IDs) are placed in the straight sections of the storage ring and generate the highest photon fluxes at a third-generation facility. The two types of ID both operate by forcing the electron beam to deviate from a straight path in an oscillatory fashion and are distinguished by the amplitude of these oscillations. In awigglerthe excursions are larger than the natural opening angleγ−1 so the radiation emitted from each ‘wiggle’ does not overlap and the spectral characteristics are similar to a bending magnet, but with 2N greater intensity, where N is the number of periods of oscillation. The oscillations in an undulator are smaller than γ−1 so
the radiation cones overlap and interfere. In this case, the spectrum has extremely intense peaks at frequencies where the interference is construc-tive. Brown et al. [8] give a more detailed description of both wigglers and undulators.
they pass through. Rather than trying to inject electrons in the correct phase of the RF voltage cycle, one simply relies on the self-equilibrating nature of the system. To maintain a stable path, the electrons must be given a certain boost
eVr e f. If an electron is travelling too slowly it will arrive late and receive a greater boost, if it is travelling too fast it will arrive early an receive a smaller boost. Any electrons arriving outside this range will not gain the correct boost and be lost. When running ‘normally’ the electron beam structure consists of evenly spaced bunches, but different bunch structures are often used to suit certain types of experiment. In single bunch mode, as the name implies, only one bunch of electrons circulates the ring. This allows time-resolved experiments to be synchronized with the bunch passing the beamline. Hybrid modes, where some bunches are dropped, produce a reasonable compromise with beam flux for most users, while still allowing for time-resolved experiments to be synchronized with an isolated bunch.
Beamlines, constructed tangentially to the storage ring, are where users carry out their experiments. A single beamline will capture synchrotron
ra-diation from either a bending magnet or an insertion device though its front
end, the interface with the storage ring. This section of the beamline is heavily shielded (by∼1 m of concrete) against radiation which includes X-rays not
cap-tured by the primary aperture, and Bremsstrahlung (braking radiation) in the
during this project are given as part of the experimental setup in Section 4.1. As users cannot enter the experimental hutch while the beam is ‘on’ due to the extreme radiation hazard, all the beamline components are controlled remotely. The high level of computer control allows for sophisticated automation of many types of experiment. In this regard, the components of XEOM1 must be treated like any other beamline system with similar remote control and synchronization requirements.
[image:33.595.200.441.294.536.2]2.1.2
Natural Sources of Synchrotron Radiation
Figure 2.3: Three colour composite image of the Crab nebula observed with the FORS2 instrument for the Very Large Telescope (VLT) at the European Southern Observatory (ESO). The blue light is primarily a result of synchrotron emission. Credit: ESO
SN 1054, generates a pulsar wind which accelerates electrons and positrons to energies as high as ∼104TeV. The observed synchrotron radiation is emitted from this relativistic plasma moving through the magnetic field generated by the pulsar. Other astronomical features which can at least partly be attributed to synchrotron radiation are the non-thermal emission from active galaxies, and gamma-ray bursts (GRBs).
2.2
X-ray Absorption Spectroscopy
10-2 10-1 100 101 102 103 104 105
Mass attenuation coefficient / cm
2 g
-1
1 10 100 1000 10000
[image:34.595.153.482.297.528.2]Energy / eV
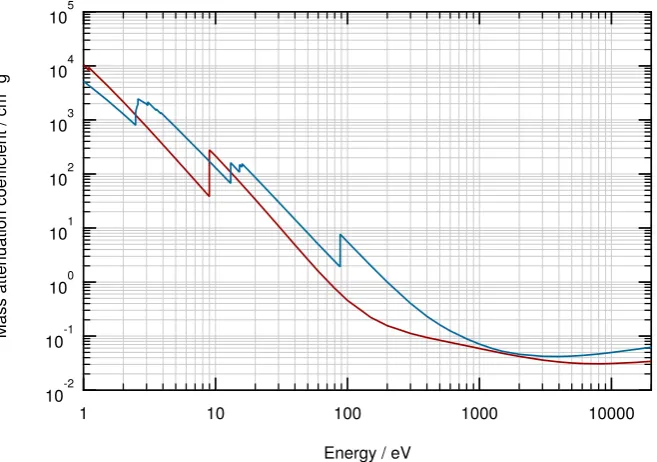
Figure 2.4: The mass attenuation coefficientµ/ρfor copper (red curve) and lead (blue curve) as a function of photon energy. Data from http://www.nist.gov/pml/ data/xraycoef/.
and photoelectric absorption. The scattering part is due to Rayleigh (elastic) and Compton (inelastic) scattering of X-rays, and photoelectric absorption is the ionization of an inner-shell electron. In general,µ(E)decreases smoothly with increasing X-ray energy, approximately as 1/E3. However, at characteristic en-ergies a sharp rise in absorption is observed (illustrated in Figure 2.4). These occur when the X-ray photon has sufficient energy to liberate an electron from a core-level bound state within the atom. Each rise is known as an absorption edge, and it is the spectral features in the vicinity of these edges which provide the structural and chemical information. Importantly, XAS is element specific as the X-ray absorption edge energies of different elements have different energies. The absorption edges are denoted by the core electron state being excited — the
K-edge corresponds to excitation of a 1selectron, the L1, L2, and L3 edges cor-respond to excitation of 2s, 2p1/2, and 2p3/2 electrons respectively, and so on. Moreover, the position of the edge is shifted by up to several eV depending on the oxidation state of the atom, in a compound specific manner.
2.2.1
Principles of X-ray Absorption
X-rays interact with matter in numerous ways, but the process which underpins XAS is the photoelectric effect. When an atom absorbs a sufficiently energetic photon a core electron is ejected into a continuum state. The loss of a core elec-tron leaves the absorbing atom in an excited state which can relax via several different mechanisms, the most significant of these being X-ray fluorescence and Auger electron emission (Figure 2.5). The probability of each decay mechanism is dependent on excitation energy; Auger emission is usually dominant at lower energies, but fluorescent X-ray yields approach 1 at higher energies i.e. those ap-propriate for excitation of K-shell electrons in elements withZ>40. Relaxation times are on the femtosecond scale. Both relaxation mechanisms begin with the transition of an electron from a more weakly bound shell to fill the core hole, but the subsequent process by which the resulting excess in energy is removed from the atom is different in each case.
Figure 2.5:The core hole left behind after ejection of a photoelectron is filled when an electron from a higher shell ‘falls down’ to the core level. The excess energy from this transition is either converted into a photon (fluorescence) or transferred to another electron causing it too to be ejected from the atom (Auger emission).
rules for electric dipole radiation, namely ∆l = ±1; ∆s =0; ∆j =0,±1 (but
not 0→0), wherelandsare the orbital angular momentum and spin quantum
numbers respectively, and j is their vector sum i.e. j=l+s. Hence, for exam-ple, a transition from the 2sto 1s level isforbidden. The nomenclature for X-ray fluorescence emission is based on the initial and final states of the electron un-dergoing a transition. For example,KαandKβ refer to transitions of the electron to the 1s state (n=1, l =0, s =±1/2) from the L and M shells respectively. With sufficiently high energy resolution, these can be further resolved to transi-tions from different split energy levels resulting from spin-orbit coupling. Since the electron energy levels (and their differences) are specific to each element, the fluorescence emission can be used for compositional analysis, as described in Section 1.3.
source is still many orders of magnitude lower than a synchrotron, and the pho-ton frequency is restricted by the source material used.
In contrast to fluorescence, Auger emission is a non-radiative process whereby the energy remaining from the initial outer shell electron relaxation is carried away by a second electron which is itself ejected from the atom. The excess energy is given by|Ec−En|, whereEcandEnare the core- and outer-shell binding energies respectively. The ejected electron, assuming the excess energy is greater than its binding energy, then has kinetic energy|Ec−En−E0m|, where
Em is the binding energy of the Auger electron. The prime denotes that this
binding energy is slightly modified as the electron is originating from an already ionized atom[2].
Absorption Spectrum Characteristics
50
40
30
20
10
0
Normalized intensity / A.U.
9.4 9.2
9.0 8.8
Energy / keV
EXAFS
Pre-edge
[image:38.595.147.481.115.344.2]XANES
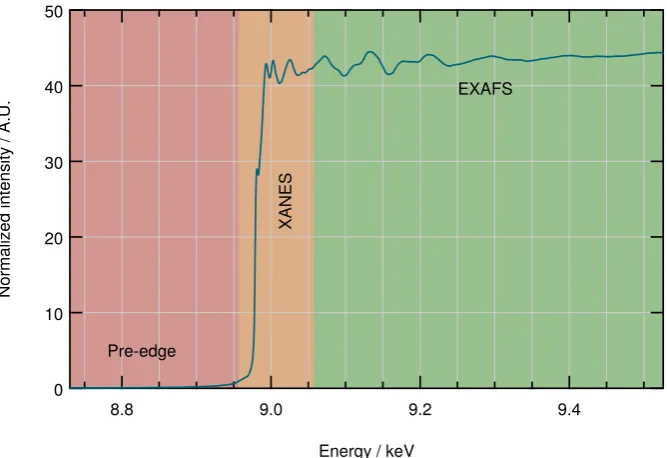
Figure 2.6: X-ray absorption spectrum of Cu obtained via fluorescence measure-ment (see Section 2.2.4) indicating the key regions where different physical pro-cesses occur.
2.2.2
Extended X-ray Absorption Fine Structure
Before discussing the near-edge region just beyond the edge, we treat the EXAFS region beginning at 30–50 eV above the rising edge and extending up to several hundred electronvolts. In this energy range the liberated photoelectrons are sufficiently energetic that single scattering is dominant i.e. the photoelectron scatters from a single neighbouring atom before returning to the origin. The departing photoelectron can be viewed as a spherically propagating wave with
wavevector k = 2π/λ, where λ is the de Broglie wavelength of the electron.
The EXAFS oscillations result from the interference between the outgoing wave and the backscattered wave from neighbouring atoms (Figure 2.7).
The general definition for the oscillatory portion of the absorption coef-ficientχ(k) is the difference between the observed absorption coefficientµ(k)
and absorption coefficient for an isolated atomµ0(k), normalized by the isolated atom contribution, that is
χ(k) = µ(k)−µ0(k)
Figure 2.7: Absorption of an X-ray photon by an atom leads to the promotion of a core-level electron to an unoccupied continuum state. As the photoelectron wave propagates out of the excited atom (solid circles), it can be scattered by neighbouring atoms. Interference between the scattered waves (dashed lines) and the outgoing waves leads to modulation of the X-ray absorption cross-section as a function of X-ray photon energy.
A heuristic argument can be used to derive a more quantitative, though still relatively simple, description of the post-edge structure in whichχ(k)can be expressed as follows:
χ(k) =X
j
Nj
kR2j|fj(k,r)|sin(2kRj+δj(k,r)), (2.2.2)
whereNjis the number of equivalent backscattering atoms jat a distance
Rfrom the absorbing atom, fj(k,r)is the backscattering amplitude which is also a function of the atomic number of the backscattering element j, and δj(k,r)
accounts for the phase shifts introduced as the photoelectron traverses the po-tential of the absorbing atom, the popo-tential of the backscattering atom, and back through the absorbing atom potential. The effects of disorder are approximated by a Debye-Waller factore−σ2jk
2
, whereσj is the root-mean-squared deviation of the surrounding atom from their nominal positions. Disorder in real systems is due to the distribution of distancesRj(static) and thermal vibrations (dynamic). Equation 2.2.2 then becomes
χ(k) =X
j
Nj kR2
j
|fj(k,r)|e−σ2jk
2
Loss of photoelectrons due to inelastic scattering is accounted for by in-troducing a terme−2Rj/λj(k), where λ
j(k)is the electron mean free path. So far,
the assumption has been made that the scattered photoelectron will find the ab-sorbing atom in its initial state, but due to the lifetime of the core hole there is a certain probability that it will have been filled; this effect is also wrapped up in the mean free path term. An amplitude reduction factorS02 is also introduced to account for shake-up/shake-off processes[10] at the originating atom. This leads to the standard form of the EXAFS equation,
χ(k) =S02X
j
Nj
kR2j|fj(k,r)|e
−2k2σ2j
e−2Rj/λj(k)sin(2kR
j+δj(k,r)). (2.2.4)
The goal is to determine the radii of the neighbouring shellsRj, and their coordination numberNj, but obtaining values for S02, and σcan also be infor-mative. This is usually achieved by extractingχ(E)from the rawµ(E)and con-verting this tok-space, i.e. χ(k), using E=ħh2k2/2m. The data, now expressed in terms of frequencies proportional tok, are then Fourier-transformed to give a plot which reveals characteristic lengths1 associated with interatomic distances
Rj. In the full data treatment, the atomic structure of the material under analy-sis is modelled allowing a theoretical calculation of the EXAFS to be produced. This is fitted to the measured EXAFS spectrum allowing the other parameters of interest to be extracted. Probably the most popular software package for pro-cessing and analysis of EXAFS data is theHoraesuite developed by Bruce Ravel
[11]. Horaeconsists of the following:
ATHENA
Graphical processing of EXAFS data, including aligning, de-glitching, merging, background removal, Fourier transforms, and more.
ARTEMIS
Fitting of EXAFS data to theoretical standards calculated using IFEFFIT (a library of EXAFS algorithms)[12]and data modelling allowing extraction of physical parameters based on statistical analysis.
HEPHAESTUS
An advanced periodic table targeted towards X-ray absorption spectro-scopists providing lookups and calculators for absorption coefficients, de-tector gas ratios, absorption lengths and other chemical data.
ATOMS
Generation of input files for FEFF from crystallographic data [13].
Recently,Horaehas undergone a significant overhaul and the processing capabilities have been pulled out of the main programs to form a new software library, Demeter. Artemis and Athena are now built on the Demeter libraries, separating the data processing code from the user interface. This allows users to more easily write their own scripts for batch processing large quantities of XAS spectra, and has enabled the development of a new graphical shell for the
Horaesuite.
2.2.3
X-ray Absorption Near-Edge Structure
1.2
1.0
0.8
0.6
0.4
0.2
0.0
Normalized
µ
(E)
9.04 9.02
9.00 8.98
8.96 8.94
X-ray energy / keV
[image:42.595.147.485.114.342.2]Cu Cu2O CuO
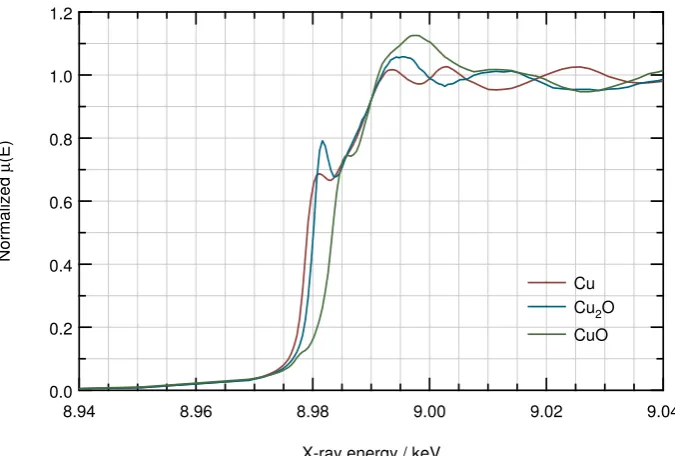
Figure 2.8: XANES spectra of copper and its oxides2, cuprite (Cu2O) and tenorite (CuO), demonstrating the positive shift in edge position with increasing oxidation state and the unique nature of the oscillatory structure just past the absorption edge for each compound.
XANES is very sensitive to the bonding environment of the absorbing atom. The edge position and shape is strongly dependent on formal oxidation state, ligand type and coordination environment so XANES spectra can be used qualitatively as ‘fingerprints’ for the local bonding environment. For example, in Figure 2.8 it is clear to see that there are distinct differences in the overall shape of the XANES spectra for pure elemental copper and its oxides, in addition to a clear shift in the absorption edge position. This shift is due to the screening of core electrons by valence electrons[15]. In this case, the formation of the bond between the copper and oxygen creates an effective positive (formal) charge on the copper atom (ion). Therefore, the screening is reduced and the core level becomes more tightly bound, increasing the energy required to eject it from its bound state.
2p shell. Therefore, transitions to 2p level are unavailable unless there is a strong hybridization (mixing) of the unoccupiedO 2p states with the metal 3d
levels; XANES spectra are extremely sensitive to such hybridization. Differences in coordination for different oxides result in dramatic alterations in the level of hybridization so pre-edge peaks in the XANES spectra give clear a indication of the local coordination environment of the metal ion.
The polarization state of the X-ray beam can also be utilized to control how the system under investigation is probed. The radiation emitted by bend-ing magnets and wigglers is strongly linear polarized in the plane of the storage ring. Some materials, which are either intrinsically oriented or can be oriented by external forces, exhibit anisotropic absorption of linearly polarized light, a phenomenon known as linear dichroism (LD) [16]. This is particularly useful for probing the molecular orientation of organic materials where sharp core level excitations in carbon, nitrogen, oxygen, and fluorine are often observed. Fea-tures in these spectra are typically described in terms of one-electron transitions from core levels to unoccupiedπ∗and σ∗ orbitals. The intensity of these reso-nances depends on the angleθ between the electric field vector of the X-rays E
and the direction of the transition dipole momentµaccording to
I ∝ |Eµ|2∝cos2θ . (2.2.5)
For example, in a 1s → π∗ transition µ is perpendicular to the plane of theπ-bond. As such, the angle dependence of particular spectroscopic features can be used to measure the orientation of specific chemical moieties[17, 18].
Similarly, the properties of circularly polarized X-rays, which may be gen-erated using an undulator such as an APPLE-II type[19], also affects how they are absorbed in certain materials due to the additional selection rules imposed on left- (∆m=−1) and right-hand (∆m= +1) polarized light, where mis the magnetic quantum number. This is most commonly used to investigate the mag-netic properties of materials via X-ray magmag-netic circular dichroism (XMCD)[2]. Differences in the absorption spectra obtained using opposite light of opposite helicity can be used to determine the residual magnetic moments via the XMCD sum rules[20].
Finally, while the dipole approximation for X-ray absorption is generally good, higher order-transitions, e.g. electric quadrupole (∆l =±2; 0), are not always negligible. They can be readily observed in some situations, such as in the pre-edge region of transition metal complexes[21]. Also, the quadrupole/dipole ratio grows quadratically withZ, so it can also be expected to be substantial for heavier elements[3].
2.2.4
Detection Modes
X-ray absorption spectra are most commonly measured via detection of X-rays, either the transmitted primary beam or fluorescent secondary X-rays. In the former case a typical setup would consist of gas ionization chamber detectors placed before and after the sample. These measure the intensity of the incom-ingI0and transmittedItbeams respectively. The thickness of the sample must be accounted for so absorption is calculated usingµ ∝ln(It/I0). In fluorescence geometry, the second detector measuring If is ideally placed at 90° w.r.t. the sample surface to minimize detection of backscattered X-rays. This also serves to increase the fraction of detected X-rays which originated from near the surface, reducing self-absorption effects which dampen the EXAFS and XANES modula-tion. An energy-dispersive detector is often used to isolate the signal from a single fluorescence line, say Kα. As fluorescence is simply proportional to ab-sorption, the relationshipµ∝It/I0 is used.
study of thin films and surface adsorbate structures. Thus, it is usually referred to as surface extended X-ray absorption fine structure (SEXAFS)[22].
The photon emission resulting from X-ray absorption is not only limited to X-rays resulting from core level electron transitions. Subsequent processes lead to radiative transitions between energy levels in the ultra-violet, visible and infra-red regimes. Photon-in, photon-out processes are usually termed pho-toluminescence, but since X-ray photons are the primary excitation source here it is normal to the phenomenon as X-ray excited optical luminescence (XEOL). As the title of this thesis suggests, XEOL is key to the work presented here, and will be discussed in more detail shortly. As described in the next section, XEOL emission has some useful characteristics and, importantly, allows for detection modes which are simply not possible using other XAS variants.
2.3
X-ray Excited Optical Luminescence
The X-ray stimulated emission of trans-visible photons results from complex elec-tron cascade processes initiated by core-hole decay. The specific nature of these processes is highly dependent on the material properties: composition, struc-ture, morphology, size, crystallinity, and defects. Owing to the multiple parame-ters controlling these numerous processes, a detailed theory of XEOL has not yet been established. In the following section, an overview of the primary physical processes which occur as part of a XEOL emission event is given.
2.3.1
XEOL Processes
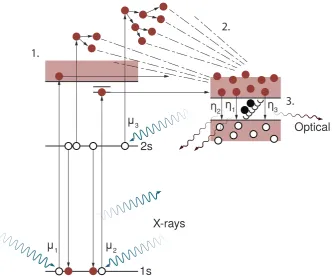
The general process may be split into three subsequent, essentially independent steps[23]:
1. X-ray absorption and conversion of the primary excitation into thermalized secondary electronic excitations (e.g. electron hole pairs).
2. Energy transfer via these secondary electronic excitations toward the lu-minescent centres promoted into excited states.
η1 η3 η2
µ3
µ2 µ1
X-rays
Optical 2s
1s
1.
2.
[image:46.595.158.492.115.392.2]3.
Figure 2.9: Schematic energy level diagram of excitation-luminescence processes. Illustrated here are an excitation from a1s state (absorption coefficient µ1) to a continuum state, a 1s (µ2) to a bound state, and a 2s µ3 to a continuum state. These give rise to a single luminescence with the respective yieldsη1, η2, andη3. Additionally, the events of an X-ray fluorescence, a K L L Auger process, electron multiple scattering, a non-radiative decay due to electron-phonon scattering, and radiative transitions are shown.
These steps are illustrated in the schematic energy level diagram given in Figure 2.9. As such, the XEOL quantum yield ηX EO L can be written as the product of three factors
ηX EO L=NeeSQ, (2.3.1)
where Nee is the number of secondary excitations (this characterises the efficiency of the conversion process),S is the efficiency of the transfer process,
and Q denotes the quantum efficiency of the luminescent centres. The total
number of secondary excitations is dependent on the absorbed X-ray energy E
Nee= E
Eee , (2.3.2)
where Eee is the average energy required to create a single secondary
excitation. Each of the three steps is now examined in more detail.
Secondary Electronic Excitations
Secondary electronic excitations in a crystal can be of many types: electron-hole pairs i.e. one electron in the conduction band and one hole in the valence bond or core band, excitons produced by Coloumb interactions between electrons and holes, and even more complicated excitations like biexcitons, or excitations re-lated to lattice or radiation-induced defects[24].
It is important to note that there is a spatial range associated with the de-excitation step. An effective mean radiusRee can be calculated from
Ree≈leepNee , (2.3.3)
where lee is the electron-electron scattering mean free path. It is impor-tant to note that this is dependent on the absorbed X-ray energy from Equation
2.3.2. Take, for example, an ionic crystal with a band gap energy Eg ≈ 5eV:
excitation by soft X-ray photons (E ≈1000 eV; lee≈10 Å) would giveNee≈100 and Ree ≈ 100 Å. In contrast, excitation by harder X-rays (E ≈ 10 keV; lee ≤ 50 Å) yields Nee ≈1000 andRee ≈1500 Å. These results are verified by Monte Carlo simulations which have been performed to estimateReein various samples
[25, 26].
There is also a time scale for the de-excitation step; electron-electron relaxation occurs within 10−14–10−12s[27], while thermalization via electron-phonon interactions takes 10−12–10−10s[28]. There is a possibility of monitor-ing XEOL emission to gain site-specific information either via very fast
time-resolved measurements using short X-ray pulses [29–31], or by examination
of specific emission bands in the luminescence spectrum [32–34]. However,
Energy Transfer
Following relaxation of the numerous electronic excitations their energy is trans-ferred to luminescence centres, the efficiency of which is accounted for by the parameter S in Equation 2.3.1. The specific nature of the electrons and holes created in the previous step affects the distance over which energy can be trans-ferred. Secondary electrons or holes may maintain their mobility, but they can also become trapped, either separately or in pairs. They can also migrate to-wards the surface where they may re-combine radiatively, or non-radiatively at surface defects.
In photoconductivity, the charge carriers become trapped by anactivator, a luminescence centre with significant excess charge with respect to the lattice. For example, in Y2O2S:Tb (a scintillator material) the emission of optical photons occurs via the following sequence
Tb3++h++e−→Tb4++e−→Tb3+,∗→Tb3++ħhν (2.3.4)
where h+ + e− are a hole in the valence band and an electron in the
conduction band[35].
Semiconductors are also good candidates for such mechanisms. In this case it is expected that the luminescent photon energy will be close to that of the band gap with short (nanosecond) lifetimes, but defect states can result in emis-sion at energies significantly less than the band gap energy with longer lifetime (hundreds of nanoseconds to microseconds)[29].In this sense, XEOL provides an attractive alternative to photoluminescence (PL) as a means for investigating luminescent centres in that it does not depend on resonant absorption, and can excite states not accessible by UV or visible excitation[36].
If there is an overlap between the optical absorption spectrum of the ab-sorption sites in the crystal and the emission spectrum of luminescent centres then there is radiative transfer of energy from the latter to the former. This re-absorption of XEOL luminescence distorts the observed XEOL excitation spec-trum; this effect has been observed in measurements of powdered EuCl2 [37] and GeO2 (Tb) nanowires [38]. However, no systematic investigation into the angular dependence of XEOL emission has yet been reported.
where the radiative re-combination of electron-hole pairs may result in the for-mation of lattice defects, so-calledF-centres (or colour centres) [39]; these are strongly absorbing in the visible range. The efficiency of formation of such de-fects was shown to depend on the absorption coefficient of the sample [40]. Whenever the emission spectrum of the luminescence centres overlaps with the absorption spectrum of the colour centres the XEOL emission spectrum is dis-torted by the energy dependence of the formation of the defects. In the case where the lifetime of the radiation defects is long, the efficiency of the XEOL will also depend on the irradiation time.
An additional energy transfer mechanism is via excitons, coupled electron-hole pairs, which can migrate through the lattice. Depending on the strength of the coupling, a distinction is made between two different types of exciton:
WannierorMott(weakly-coupled) where the wavefunction is spread over many lattice sites, and Frenkel (strongly-coupled) where the wavefunction is tightly localised on a single lattice site[41]. It has been shown that in molecular crys-tals the diffusion length of a large radius exciton can be up to 100µm, whereas a small radius exction may only migrate over 50 nm[42]. Excitons may recom-bine during their lifetime yielding optical emission, or they may be capture by the local Coulomb potential of an activator resulting in direct excitation of the luminescent centre.
Luminescence Quantum Yield
The quantum efficiency,Qin Equation 2.3.1, of luminescence can often be mea-sured independently, e.g. by visible, UV, or VUV excitation. Two subclasses of luminescence centre exist:
Activators
Dopants deliberately introduced in a host lattice, e.g. rare earths or transi-tion metals, at very low concentratransi-tions. The luminescence in such centres is due to radiative transition between well-defined levels in the impurity ion. The theory for calculating the quantum efficiencyQfor these centres is well-established[43]and predictions can be made with good accuracy.
Intrinsic
exci-tons [44]or cross-luminescence[45], or with consituents such as molec-ular ions.
The luminescence yield is usually proportional to the excitation density. However, there are situations where the yield is non-linear such as in the lumi-nescence of biexcitons often observed in semiconductors[46].
2.3.2
XEOL-XAS
The first reported observation of an X-ray absorption spectrum detected via op-tical luminescence was by Bianconi et al.[47]. The UV emission from a single
crystal of CaF2 was measured under X-irradiation over a 300 eV range about
the CaK-edge. The resulting spectrum clearly showed the absorption edge step with post-edge oscillations. Moreover, they also immediately demonstrated a phenomenon unique to XEOL-XAS spectra: an inverted edge. This occurs when the total photoluminescence yield actually drops at the absorption edge and the post-edge features appear as a ‘mirror’ image of the absorption spectrum i.e. maxima in absorption appear as minima in the XEOL structure, and vice-versa. The optical emission from CaF2is attributed to the recombination of self-trapped excitons (STEs) so the emission intensity increases with the integrated energy of excited photoelectrons and Auger electrons generated by X-ray absorption by higher shells. It is important to note that the thickness of the crystal under bom-bardment was sufficient for total absorption of the incoming photons. Therefore, it was argued that the reduction in yield at theK-edge can be explained by the onset of radiative recombination (X-ray fluorescence) of the 1shole reducing the integrated electron energy. In addition, by plotting the inverse of the oscillatory portion of the XEOL spectrum with the corresponding region in the transmission absorption spectrum the potential for EXAFS data to be acquired in this manner was also recognized. Investigations by Goulon et al.[32, 48]found that a thin powder sample of the same material exhibited a positive edge with EXAFS oscil-lations comparable to a conventional X-ray absorption spectrum, and discussed a criterion for the appearance of positive and negative steps.
Emura et al.[49] expanded on these findings to develop a
phenomeno-logical model for predicting the sign of the edge step in XEOL spectra. Ifµ(E)