warwick.ac.uk/lib-publications
Original citation:
Archer, Nathan, Walsh, Mark, Shahrezaie, Vahid and Hebenstreit, Daniel. (2016) Modeling
enzyme processivity reveals that RNA-Seq libraries are biased in characteristic and
correctable ways. Cell Systems.
http://dx.doi.org/10.1016/j.cels.2016.10.012
Permanent WRAP URL:
http://wrap.warwick.ac.uk/81435
Copyright and reuse:
The Warwick Research Archive Portal (WRAP) makes this work of researchers of the
University of Warwick available open access under the following conditions.
This article is made available under the Creative Commons Attribution 4.0 International
license (CC BY 4.0) and may be reused according to the conditions of the license. For more
details see:
http://creativecommons.org/licenses/by/4.0/
A note on versions:
The version presented in WRAP is the published version, or, version of record, and may be
cited as it appears here.
Seq Libraries Are Biased in Characteristic and
Correctable Ways
Graphical Abstract
Highlights
d
Characterization of global RNA-seq biases specific to library
preparation protocols
d
Mathematical framework to reverse engineer enzyme
reactions that cause bias
d
Insights from reverse engineering allow optimization of
RNA-seq protocols
d
Lowered incubation temperatures during library preparation
improve sensitivity
Authors
Nathan Archer, Mark D. Walsh,
Vahid Shahrezaei, Daniel Hebenstreit
Correspondence
[email protected] (V.S.),
[email protected] (D.H.)
In Brief
Experimental procedures for preparing
RNA-seq and single-cell RNA-seq
libraries are based on assumptions
regarding their underlying enzymatic
reactions. However, the fairness of these
assumptions varies between libraries,
and most protocols have characteristic
biases. Here, we investigate the
mechanistic basis of these biases,
provide correction factors, and increase
the accuracy of transcript quantitation in
RNA-seq and scRNA-seq.
Data Resources
GSE84785
Archer et al., 2016, Cell Systems3, 1–13
November 23, 2016ª2016 The Author(s). Published by Elsevier Inc.
Cell Systems
Article
Modeling Enzyme Processivity Reveals
that RNA-Seq Libraries Are Biased
in Characteristic and Correctable Ways
Nathan Archer,1Mark D. Walsh,1Vahid Shahrezaei,2,*and Daniel Hebenstreit1,3,* 1School of Life Sciences, University of Warwick, Coventry CV4 7AL, UK
2Department of Mathematics, Imperial College, London SW7 2AZ, UK 3Lead Contact
*Correspondence:[email protected](V.S.),[email protected](D.H.) http://dx.doi.org/10.1016/j.cels.2016.10.012
SUMMARY
Experimental procedures for preparing RNA-seq and
single-cell (sc) RNA-seq libraries are based on
as-sumptions regarding their underlying enzymatic
re-actions. Here, we show that the fairness of these
assumptions varies within libraries: coverage by
sequencing reads along and between transcripts
ex-hibits characteristic, protocol-dependent biases. To
understand the mechanistic basis of this bias, we
present an integrated modeling framework that infers
the relationship between enzyme reactions during
li-brary preparation and the characteristic coverage
patterns observed for different protocols. Analysis
of new and existing (sc)RNA-seq data from six
different library preparation protocols reveals that
polymerase processivity is the mechanistic origin
of coverage biases. We apply our framework to
demonstrate that lowering incubation temperature
increases processivity, yield, and (sc)RNA-seq
sensi-tivity in all protocols. We also provide correction
fac-tors based on our model for increasing accuracy of
transcript quantification in existing samples
pre-pared at standard temperatures. In total, our findings
improve our ability to accurately reflect in vivo
tran-script abundances in (sc)RNA-seq libraries.
INTRODUCTION
RNA sequencing (RNA-seq) has quickly become the standard method for transcriptomics (Wang et al., 2009) and has been further developed into a number of modified protocols that allow detection from single cells (single-cell RNA-seq [scRNA-seq]) (Tang et al., 2011). The power of scRNA-seq to reveal cell pop-ulation heterogeneity in transcriptome-wide fashion has made it the focus of intense recent research activity aimed at its further development and on analysis techniques (e.g.,Grun et al., 2014;€ Kim and Marioni, 2013; Nakamura et al., 2015).
The typical workflow of an RNA-seq assay involves the extrac-tion (and often further purificaextrac-tion) of mRNA from cells, the prep-aration of a sequencing library including fragmentation, linear
(Hashimshony et al., 2012) or PCR amplification, next-generation sequencing, and computational processing and analysis of the resulting data. Although a great variety of different RNA-seq pro-tocols have been developed, virtually all (except for direct RNA sequencing [Ozsolak and Milos, 2011]) include the basic cDNA production steps of reverse transcription (often referred to as first-strand synthesis) and second-strand synthesis, which often corresponds to an extended first cycle of the subsequent PCR amplification (Figure 1A). The cDNA replaces the less robust RNA with DNA and is required for the introduction of adapters to enable next-generation sequencing, unless special adaptions are used (Gansauge and Meyer, 2013). The enzymes used in cDNA production are processive (Von Hippel et al., 1994) and thus incorporate many nucleotides before the reaction stops. The exact syntheses starting and stopping points are unclear and introduce complex positional dependencies, which are crucial for the resulting RNA-seq coverage (Figure 1B).
Several steps in the library preparation procedures lead to over- and/or under-representation of sequences with regards to the starting material, introducing biases in the RNA-seq quan-tification. This can be partially experimentally corrected by em-ploying molecular barcodes (Islam et al., 2014), although these have other disadvantages, such as PCR and sequencing errors that bias results (Macosko et al., 2015). Some types of bias, such as non-uniform primer binding (Hansen et al., 2010) or frag-mentation efficiency (Griebel et al., 2012; Quail et al., 2008), affect the local coverage within transcripts and can be computa-tionally corrected to a degree. However, the vast majority of (sc) RNA-seq datasets show peculiarglobalshapes, that is an overall pattern concerning transcript coverages that depends on the transcripts’ lengths (see below,Results, and glossary for terms we use inBox 1). It was noted before that this is probably due to cDNA production (see below) (Mortazavi et al., 2008). How-ever, the effect remains uncorrected by analysis tools (Stegle et al., 2015) and is not understood, and the systematic bias it in-troduces is potentially much stronger than local variation.
Since the major goal of RNA-seq is to accurately infer (relative) expression levels or sequence structure of the original mRNAs, these biases are problematic and need to be taken into account. This issue is particularly relevant for scRNA-seq, where absolute transcript quantification is desired and where the bias in coverage by sequencing reads can affect sensitivity. While los-ses at each step of a standard RNA-seq protocol are uncritical due to a sufficient supply of starting material, they limit chances
Cell Systems3, 1–13, November 23, 2016ª2016 The Author(s). Published by Elsevier Inc. 1
This is an open access article under the CC BY license (http://creativecommons.org/licenses/by/4.0/).
of transcript detection and absolute quantification in scRNA-seq. Ideally, the mass of every single original mRNA should be harnessed as completely as possible for the next-generation sequencing step at the end of an scRNA-seq protocol. To do that, one must understand systematic non-uniformities in scRNA-seq coverage.
[image:4.603.59.381.94.640.2]In the present work, we introduce an analytical and computa-tional framework that allows ‘‘reverse engineering’’ of reactions
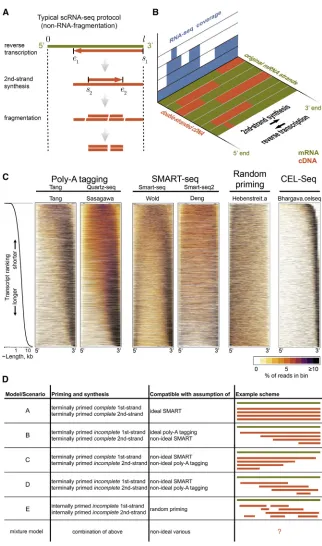
Figure 1. cDNA Conversion Yields Biases of RNA-Seq Coverage
(A) Library preparation for next-generation se-quencing involves reverse transcription and sec-ond-strand synthesis, followed by fragmentation. Depending on the protocol, reverse-transcription starts and ends at certain points for first-strand synthesis (s1ande1, respectively) and second-strand synthesis (s2ande2).
(B) The original mRNA (olive) is thus often non-uniformly represented by double-stranded cDNA (orange), which biases detection by RNA-seq (blue).
(C) RNA-seq coverage along transcripts for different datasets. Sequencing reads were map-ped to murine, non-overlapping RefSeq tran-scripts without isoforms. All detected trantran-scripts (10,000) were ordered from shortest (top) to longest (bottom), were adjusted to have identical length, and were divided into 20 bins each. The percentage of reads in each bin is color coded for each transcript (see legend). The distribution of transcript lengths is shown on log scale on the left. This distribution corresponds to the Wold dataset but is representative of the others, subject to minor variations due to different numbers of detected transcripts. Details of the datasets shown are listed inTable 1. Unbiased coverage within transcripts would result in uniformly orange rectangles. More datasets are shown inFigure S1.
(D) Simplified models/scenarios of RNA-seq library preparation outcomes based on priming strategy and synthesis success.
and enzyme kinetics during RNA-seq li-brary preparation. Applying this frame-work, we are able to identify polymerase processivities as the main determinants for the global coverage shapes. Our models also yield correction factors for quantification, which demonstrate that currently used measures are inadequate. The insights into molecular reactions that our framework allows can be further exploited to improve RNA-seq protocols, as we demonstrate experimentally.
RESULTS
Below, we will analyze a selection of RNA-seq strategies, mostly for scRNA-RNA-seq, but covering virtually all widely used proto-cols, and focus on the coverage by sequencing reads along transcripts. The main variation between these protocols concerns the first- and second-strand priming strategies.
transcription stops. An improved version of this protocol was published as ‘‘Quartz-seq’’ (Sasagawa et al., 2013). By contrast, complete (‘‘full-length’’) sequencing coverage along the whole mRNA has been a selling point of different library preparation protocols, as it is believed to correspond to more reads per tran-script and/or better resolution of splice variants (Picelli et al., 2013; Ramsko¨ld et al., 2012). Particularly successful in this respect is the second scRNA-seq approach we are studying, termed ‘‘Switching Mechanism At the 50 terminus of the RNA Transcript’’ (SMART) (Zhu et al., 2001). Here, the second-strand primer binds to the overhang generated by the addition of several non-templated cytosines by the reverse transcriptase upon completion of full-length of the first-strand, which is primed from the poly-A tail. SMART-based scRNA-seq, and its variants (e.g., ‘‘Smart-seq2’’), has become a de facto standard (Deng et al., 2014; Islam et al., 2012; Picelli et al., 2013; Ramsko¨ld et al., 2012; Shalek et al., 2013). Both poly-A-tagging and SMART protocols are usually subjected to variable numbers of PCR cycles. An extended first PCR cycle is used to synthesize the second-strand, while later cycles also enrichcomplete sec-ond strands by using primers flanking the 30ends of first-strands. While the bulk of our analysis will be devoted to methods derived from poly-A tagging and SMART, we will also briefly discuss the linear-amplification-based scRNA-seq strategy
CEL-seq (Hashimshony et al., 2012, 2016). CEL-seq compares unfavorably to the above scRNA-seq protocols in some studies in terms of its technical variation (Bhargava et al., 2014) and is based on a complex sequence of enzymatic conversions; the mRNAs are reverse transcribed based on poly-A priming using molecular barcode containing primers, followed by random-primed second-strand synthesis, in vitro transcription, RNA frag-mentation, and another round of first- and second-strand syntheses. Finally, only fragments containing the 30end with re-gards to the original mRNA are selected by PCR. Inference of expression levels is based on counting these fragments and/or unique barcodes, while coverage along transcripts is ignored. CEL-seq thus follows a different principle than the other protocols.
In addition to these single-cell techniques, we include two bulk methods for comparison. First, we analyze the classical RT-PCR/RNA-seq protocol based on random-oligonucleotide primed first-strand synthesis, followed by randomly primed sec-ond-strand synthesis based on RNaseH-nicking (CSHL, 2005) (with fragmentation after cDNA production). This priming strat-egy is not common in scRNA-seq, as the usage of 30 poly-A tail binding primers reduces priming of rRNA, thus making puri-fication of mRNA unnecessary and potentially reducing losses of the limiting starting material. However, it provides a useful
Box 1. Glossary
cDNA Single- or double-stranded DNA obtained from reverse transcription of mRNA, followed by second-strand synthesis (if double stranded).
Conditional probability P(xjy) is the probability of event ‘‘x’’ under the condition that ‘‘y’’ has occurred.
Coverage The density of sequencing reads aligning to known bases, usually along exons within gene bodies. First-strand synthesis Same as reverse transcription. Polymerization of a complementary DNA (cDNA) strand along an mRNA by
reverse transcriptase.
FPKM Fragments per kilobase of transcript per million mapped reads. Widely used measure for expression levels determined by RNA-seq.
Likelihood A measure for how well a model agrees with the data.
Likelihood ratios Compares the goodness of fit of two models by calculating the ratio between their likelihoods. Markov Chain Monte Carlo Class of methods that allow efficient sampling from a probability distribution and are commonly used to
produce estimates of posterior distributions in Bayesian statistics. MCMC See Markov Chain Monte Carlo.
Overhang Unpaired nucleotides resulting in a single-stranded stretch at the 50or 30end of double-stranded DNA. Parameters Values that our models depend on. They determine the exact shapes of the coverage functions and are
learned from a specific dataset through the fitting process (see MCMC). The parameters of our models have intuitive interpretations:
d+ 1 ratio of fragmentation efficiencies inside strands versus close to ends.
hdistance (bases) from ends over which fragmentation efficiency is reduced. 1/q1average synthesis length of reverse transcription (processivity).
1/q2average synthesis length of second-strand synthesis (processivity).
afraction of PCR-selected full-length strands.
Priming strategy The method by which reverse transcription or second-strand synthesis is primed to initiate the reaction— including sequence-specific primers, Oligo(dT) primers, random primers, or others.
Processivity The ability of an enzyme to catalyze consecutive reactions between association and dissociation from its substrate. In our context, we use the term as the average number of nucleotides incorporated (i.e., the synthesized length) in one uninterrupted process (on an infinitely long template).
Reverse transcription See First-strand synthesis.
Second-strand synthesis Polymerization of a second DNA strand complementary to the first cDNA strand by a DNA polymerase.
comparison because it gives rise to very different coverages as the above protocols and is still commonly employed for qPCR. Second, we include an RNA-fragmentation-based dataset ( Va-hedi et al., 2012), which fragments mRNA instead of cDNA and thus strongly reduces the coverage bias due to cDNA-produc-tion. While this is routinely applied in standard RNA-seq, it is not used for scRNA-seq, presumably for fear of degrading and losing mRNA and because it precludes direct poly-A priming. This allows us to compare above protocols to a popular and potentially bias-free one.
The principles of the above mentioned RNA-seq protocols are mostly based on assumptions, and it is unclear how closely these reflect the experimental reality. It has been pointed out before, for instance, that SMART protocols may increase the portion of full-length products in the final reaction mixture by excluding incomplete first-strand synthesis products (due to reduced efficiency of the SMART mechanism inside the mRNA compared to its end), rather than by improving or completing their synthesis (Hebenstreit, 2012; Shapiro et al., 2013). We wanted to explore from a general and quantitative perspective how reliable the above assumptions are and what trade-offs be-tween complete coverage, loss of starting material, and position bias are to be expected for the various protocols.
Thus, we visualized the sequencing read distributions in actual datasets generated by a variety of RNA-seq and scRNA-seq li-brary preparation protocols. We group protocols into poly-A tagging-like, SMART-like, random priming, CEL-seq, and RNA fragmentation (Table 1). To limit the influence of confounding factors in our analyses, we selected datasets for a single species only (mouse) and mapped reads to non-overlapping RefSeq transcripts without splice variants as it was done before (Li et al., 2010b); overlapping genes and genes with multiple isoform annotations would potentially give rise to more complex coverage shapes that are independent from the protocol-spe-cific effects we want to study.
In order to effectively visualize coverage and define global shapes present within each dataset, we ordered transcripts ac-cording to their lengths and color-coded read densities in 20 bins along the transcripts after length normalization (Figure 1C). This highlights the ‘‘noisiness’’ of the data due to the various bias sources but also confirms some previous observations: poly-A primed libraries tend to exhibit a 30 bias (Mortazavi et al., 2008), SMART protocols produce reasonable coverage even for longer transcripts (Ramsko¨ld et al., 2012), and the profiles depend on transcript length (Bohnert and Ratsch, 2010€ ) ( Fig-ure 1C). Random priming yields more uniform, yet 50-biased coverage, as previously reported (Mortazavi et al., 2008) ( Fig-ure 1C). Virtually all datasets feature underrepresented regions close to transcript ends, presumably due to inefficient fragmen-tation as discussed above. We include a plot for CEL-seq data, which confirms selection of 30fragments (Figure 1C).
Several features of the data have been noted before (Adiconis et al., 2013; Ramsko¨ld et al., 2012) but warrant more discussion and analysis: the 30bias in the SMART and poly-A-tagging data-sets tends to worsen with increasing transcript lengths, whereas the coverage of shorter transcripts is more uniform and even 50biased in some cases. In addition, bimodality in the coverage (high read densities at 50and 30ends, low density in the centers of transcripts) appears for transcripts of intermediate and/or long
lengths (>3 kb) in most SMART-seq datasets (Figure 1C; more datasets are shown in Figure S1). It is also noteworthy how similar these aspects are among poly-A-tagging and SMART protocols, given the differences between these. Although the graininess of the data is affected by the amount of starting mate-rial/PCR cycles, the bias shapes appear independent of this (Bhargava datasets,Figure S1). The only protocol without strong systematic bias (aside from underrepresented ends) is RNA frag-mentation (Figure S1).
As a first step toward understanding these phenomena, we asked whether they could be recapitulated by simplified models (Figure 1D). To this end, we defined the expected and assumed differences among the protocols, including their possible limita-tions, in a set of five abstracted and simplified models (these are summarized graphically inFigure 1D). We label these from ‘‘A’’ to ‘‘E,’’ which roughly increase in complexity, starting with the idealistic scenario of full-length syntheses for both first- and sec-ond-strand ‘‘A.’’ This would be compatible with an optimally functioning SMART protocol, free from any coverage bias, similar also to earlier assumptions of uniform coverage of RNA-seq data (using the measure of fragments per kilobase per million total fragments [FPKM]; see below). Models B and C correspond to successful full-length selection for fragments containing either the 30 or 50 transcript end, respectively (i.e., by PCR with 30 flanking primers or full-length SMART on 50 end, respectively). We consider models that abstract non-full-length poly-A tagging (model D) and random priming (model E) and also the possibility of a combination of these simpler models (Figure 1D). The models are discussed in greater conceptual detail below.
RNA-seq library preparation can be understood as a stochas-tic process, where steps in the protocol depend on preceding ones and are associated with varying degrees of randomness. A convenient and very intuitive way to model this is by using conditional probabilities (Box 1). For instance, given that first-strand synthesis starts at positions1along the transcript, it might end at positione1with probabilityP(e1js1). The starting position of the second-strand synthesis,s2, would then depend on this, givingP(s2je1), and so forth (Figure 1A, seeMethod Detailsfor details). We use this approach to capture the various aspects of the protocols with the aim of quantitatively and formally under-standing their expected influence on shaping the distributions of sequencing read starting positions (mathematical models can be found in the Models section ofMethod Details). While our frame-work is very flexible and allows us to easily include several different factors, we focused on the effects of enzyme reactions during cDNA conversion as captured by our minimal models A to E (Figure 1D). We thus do not consider sequence-specific biases and the lengths of primers. We also exclude factors that are ex-pected to cause overall loss with regards to the starting material but do not introduce bias. Failed poly-A tail priming, for instance, will probably affect different transcripts with roughly equal probability, so we do not consider it in our analysis. In contrast, usage of random first-strand primers plausibly will favor cDNA conversion of longer transcripts, as the chances of binding are higher.
Table 1. Previously Published Datasets Used in This Study
Group Name/Reference Accession Number Sample Library Protocol Read Type
Read Number
Reads Mapped (%) poly-A tagging Tang et al. (2009) GSM365014 single cell, oocyte Tang 50 bases SE, SOLiD 25M 36
Sasagawa et al. (2013) GSM1036495 50 cells, embryonic stem cells Quartz-seq 102 bases PE, Illumina 85M 96 Wei et al. (2011) GSM523211 >mg, resting Th2 cells Tang 36 bases SE, Illumina 11M 57 SMART Deng.smartseq (Deng et al., 2014) GSM1112540 single cell, 4-cell stage embryo Smart-seq 53 bases SE, Illumina 27M 42 Bhargava.AA.ng GSM1231200 1 ng Smart-seq 99 bases SE, Illumina 25M 50
Bhargava.SFM.ng GSM1231198 1 ng 24M 41
Bhargava.AA.pg GSM1231212 25 pg 23M 51
Bhargava.SFM.pg (Bhargava et al., 2014)
GSM1231210 25 pg mRNA, embryoid bodies 24M 41
Wold (ENCODE project) ENCSR814JMM 50 cells, cerebellar granule layer Smart-seq 100 bases SE, Illumina 48M 26 Deng.smartseq2 (Deng et al., 2014) GSM1278036 single cell, fibroblast Smart-seq2 43 bases SE, Illumina 28M 42 Mahata et al. (2014) ERR489030 single cell, activated Th2 cells Smart-seq 75 bases PE, Illumina 23M 23 Random priming Hebenstreit.a GSM710184 >mg, resting Th2 cells Random priming,
RNaseH
36 bases 16M 46
Hebenstreit.b (Hebenstreit et al., 2011) GSM710183 41 bases SE, Illumina 26M 37 CEL-seq Bhargava.celseq (Bhargava et al.,
2014)
GSM1231230 1 ng mRNA, embryoid bodies CEL-seq 100 bases PE, Illumina (30read used only)
30M 16
Celseq2 (Hashimshony et al., 2016) GSM2076520 single cell, fibroblast CEL-seq2 35 bases (trimmed) PE, Illumina (30read used only)
0.65M 40
RNA fragmentation Vahedi et al. (2012) GSM994539 >mg, resting Th2 cells TruSeq 100 bases SE, Illumina 40M 46 SE, single end; PE, paired end.
Cell
Systems
3
,
1–13,
November
23,
2016
5
Please
cite
this
article
in
press
as:
Archer
et
al.,
Modeling
Enzyme
Processivity
Rev
eals
that
RNA-Seq
Librarie
s
Are
Biased
in
Characte
ristic
and
Correctable
Ways,
Ce
ll
Systems
(2016),
http://dx.d
oi.org/10.1016/j.cels.2016
synthesis lengths, their ‘‘processivities.’’ The enzymes’ proces-sivities are in general likely to depend on several parameters, such as temperature or nucleotide concentration, and could reflect eventual stops in the synthesis process or physical detachments of the enzyme from its template or both. The proc-essivity of the reverse transcription is influenced by mRNA sec-ondary structure as well, which again depends on other factors, including sequence and temperature (Joseph and David, 2001). In total, cDNA strand synthesis length is most commonly assumed to roughly follow geometric/exponential distributions (Bibillo and Eickbush, 2002; Von Hippel et al., 1994). We adapt this for our model and assumeP(e1j s1) andP(e2 js2) follow exponential distributions, taking also account of possible full-length synthesis (seeFigure S2andSTAR Methods). The distri-butions are subject to parametersq1andq2, which are inversely proportional to the processivities of the first- and second-strand synthesis. Finally, we include terms in our model to account for reduced fragmentation efficiency at the ends of the double-stranded cDNAs in the library. This has the form of a step change of sequencing probability as given by parameterdover distance
hfrom either end.
Based on these considerations, we derived expressions for the expected coverage of our models A to E as functions of tran-script lengthl. These have the forms of various combinations of exponential terms and are of moderate complexity (Table 2, shown withoutd,hterms for clarity). It is of note that the expres-sion for model A and its notion of ‘‘ideal’’ SMART can be inter-preted in two ways; either full-length syntheses are achieved by very high processivities (giving essentially q1=q2= 0), or full-length cDNA is enriched over incomplete products (e.g., by PCR and/or the SMART mechanism), allowing for higher q1 andq2, but implying exponentially decreasing sequencing effi-ciency with increasing mRNA length.
Models A, B, and C restrict the global coverage shapes that can be expected to a straight line or simple exponential de-creases from either side, respectively, for all lengths (Figure 2A).
However, the coverage obtained with model ‘‘D’’ under realistic parameter settings resembles the experimental SMART data-sets, capturing the transition from 50to bimodal to 30bias ( Fig-ure 2A). Model D also predicts lower densities for the 50edges compared to the 30edges throughout, in the regions where frag-mentation efficiency is reduced (Figure 2A). This too appears to mirror the experimental data for all relevant protocols. Using the same parameter settings, we obtain equally promising shapes for model E, which resembles the 50-biased random-priming data it is designed to explain (Figure 1C). The overall character-istics of the bias shapes are conserved if the skewed distribution of natural transcript lengths is replaced with a linear function (Figure S3a).
We proceeded to test fits of our models to the actual datasets and infer parameters using a Markov Chain Monte Carlo (MCMC) approach (STAR Methods). As the coverage in models A and C does not depend on all the parameters, in these cases a subset of parameters are inferred. We compare the quality of the fits we obtain for all models based on their likelihoods (STAR Methods), which reveals that models B and D provide best fits for poly-A-tagging and SMART datasets (Figure S3b). Model D, in particular, captures well the changing coverage shapes with increasing transcript lengths (Figure 2B). Given these findings, we presumed that second-strand priming and partial PCR selection of both, poly-A-tagging and SMART proto-cols is captured best by a combination of models B and D, which indeed yields the best fits (Figures S3b and 2B). The parameter values we obtained for the combined model suggest that the average synthesis lengths for the first- and second-strands are about 5–10 and 1–3 kb, respectively (Figures 2C andS4), which agrees with estimates from the literature (Joseph and David, 2001). The parameterized models capture behavior observed in in vivo datasets, suggesting that the assumptions made during modeling are reasonably conservative. For example, increasing the number of PCR cycles used in the SMART protocol should result in an increase in the proportion of the (full-length second-strand) model B over D, as param-eterized by parameter a (Method Details). The Bhargava dataset allows testing this as it includes samples subjected to different numbers of PCR cycles. a indeed increases signifi-cantly (p < 109, one-sided Mann-Whitney U test) with higher numbers of PCR cycles for two different biological samples (Activin A treated [AA]; serum-free media [SFM];Figure 2D).
Our parameterized models allow us to test the common as-sumptions about how scRNA-seq and RNA-seq protocols work. Model A and model C clearly perform worse as these restrict the coverages to patterns that are not observed in the data, which is reflected in the goodness-of-fit statistics ( Fig-ure S3b). This suggests that the common assumptions regarding SMART protocols are too optimistic. For example, second-strand synthesis appears to frequently start within tran-scripts, not at ends only, and selection for complete second-strands is imperfect, which explains the similarities between poly-A-tagging and SMART protocols. A similar observation termed ‘‘strand invasion’’ was made for the nanoCAGE tech-nique recently, where it was found that the second-strand primer (‘‘template switching oligo’’) can bind the first-strand internally at complementary sequences (Tang et al., 2013). As expected, model E fits well the random-priming datasets, but
Table 2. Theoretical Expectations, Corresponding to Likelihoods, of Transcript Coverage with Different Models
Model/
Scenario Coverage Functionf(x,l,.) = A elðq1+q2Þ
B 1
ðq1+q2Þ½q
1e2lðq1+q2Þ+ðq1+q2Þðl+xÞ+q2elðq1+q2Þ
C eq1lq2x
D 1
ðq1+q2Þ½q
1eq1ðlxÞ+q2eq1lq2x
E a1a2
q01ðq01+q02Þ
" l 1
q01+q02
1
q01
q01elðq 0 1+q02Þ
q02ðq01+q02Þ +ðq
0 1+q02Þelq
0 1
q01q02
#
Theoretical expectations (likelihood) of transcript coverage with different models (Figure 1D).xis the absolute position within the transcript (x= 0 at the 50end),lis the absolute transcript length (Figure 1A), andq1andq2are
the inverse processivities of first- and second-strand syntheses, respec-tively.q01andq02are modified processivities for model E (seeMethod
Details).a1anda2are the probabilities of first- and second-strand
(legend on next page)
not the poly-A-tagging and SMART datasets (Figures 2B and S3b; seeFigure S5for parameter estimates of the remaining models).
Altered Incubation Temperature and Model-Driven Improvement to RNA-Seq Protocols
While the goodness of our fits and the underlying logic suggest our modeling approach is valid, we sought further experimental confirmation. To this end, we prepared RNA-seq samples de-signed to specifically perturb single parameter values only and sequenced them on an Illumina MiSeq sequencing machine. We focused on incubation temperature for enzyme reactions because it is both experimentally accessible and interpretable: we reckoned that it should affect polymerase processivity. We prepared libraries using lowered temperatures during reverse transcription (25C instead of the standard 42C) and/or second-strand synthesis (42C instead of the standard 72C); protocols were based on and generated by SMART-seq or Quartz-seq and began with different starting RNAs (poly-A+, total RNA, single cell; seeTable S1for a list of all samples).
If the notions underlying our modeling approach are correct, the changed temperatures should change the corresponding parameter estimates while the remaining parameter estimates should remain the same. The parameter estimates we obtained confirm this reasoning; lowering first-strand temperature changes q1 estimates without affecting q2 significantly, and vice versa if second-strand temperature is changed (Figures 3A and 3B; examples for coverage plotsFigure S6). An exception is the significantly differentq1estimate upon changing second-strand temperature with first-second-strand synthesis at 25C; however, in this case, the median is very close.
We note that estimation ofq2for SMART-seq is less precise, as the PCR step with flanking primers means that the original second-strand contributes substantially less to the shape of the coverage (compare this to model A, ‘‘ideal SMART-seq,’’ which would not even allow estimation of q1, as discussed above), thus obscuring the temperature-related differences. For this reason, we excluded SMART-seq samples from the plot forq2 inFigure 3B (they are shown as Figure S7a) and instead add SMART-seq samples where we omitted the PCR step (Figures 3A and 3B), which yields similar results as the other protocols.
This analysis also revealed an unexpected feature of cDNA synthesis: lowering temperatures appears toincrease processiv-ities of the enzymes (Figures 3A and 3B). This observation sug-gests that lowering incubation temperatures should improve the yield of RNA-seq protocols. We therefore measured by Qubit the absolute amount of cDNA produced from the same starting
amounts of mRNA and synthesis reactions carried out at the temperatures described above. We observed significantly (p%0.001, one-sided t test) increased cDNA synthesis at lower temperatures, with an optimum yield upon lowering both tem-peratures (Figure 3C). To further investigate the increase in proc-essivity, we turned to RNA-seq again. We prepared RNA-seq samples from the same RNA, aliquoted the samples for each temperature, and sequenced these on the same lane using in-dexed primers. Increased processivities should increase the proportion of longer mRNAs within the samples. We thus compared the relative representation by sequencing reads of transcripts of different lengths normalized to corresponding read numbers at the standard incubation temperatures. Indeed, we observe significantly increased representation of longer tran-scripts (Figure 3D); this is in accordance with the Qubit measure-ment and suggests that polymerase processivity increases at low temperatures. We further compared the numbers of genes detected and the overall numbers of sequencing reads we ob-tained for transcripts and for spike-in probes, which we had added to a subset of starting RNAs for our RNA-seq samples. This confirms increased yields upon reduced temperatures (Figures 3E–3G). Accordingly, RNA-seq also became more sensitive: we were able to detect lower concentrations of the spike-in probes (Figure 3H). Notably, reducing the incubation temperatures does not appear to increase local bias. The coverage heatmaps do not exhibit obvious visual differences regarding their ‘‘noisiness’’ (Figure S6), and quantifying this rather suggests improved coverage uniformity upon reduced in-cubation temperatures (Figure S7b). These findings show an improved RNA-seq performance at lower temperatures and illustrate how insights generated by our framework can be ex-ploited to optimize protocols.
Our framework can also improve analysis of existing data. For example, accurate quantitation of mRNA expression necessi-tates a thorough understanding of the expected numbers of sequencing reads for different types of transcripts. The simplest notion of linear scaling with transcript length is embodied in the classical RNA-seq FPKM measure, which is now generally un-derstood to be an oversimplification but still widely used. Several approaches to take account of non-uniform read distributions along transcripts have been published and are included in com-mon RNA-seq analysis software, such as CuffLinks (Roberts et al., 2011; Trapnell et al., 2012) or RNA-Seq by Expectation Maximization (RSEM;Li and Dewey, 2011). These approaches focus mostly on the correction of biases withintranscripts to yield corrected FPKM. Thus, while approaches like these improve isoform quantitation, they do not account for the non-linear scaling of expected read numbers acrosstranscripts of
Figure 2. Analysis and Fitting of Models
(A) Coverage heatmaps as inFigure 1C for theoretical models A–E (Table 2), using parameter settings as indicated on the right side. The transcript length distribution of the Wold dataset was used.
(B) Overlays of best fitting models (dashed lines) after Markov Chain Monte Carlo (MCMC) parameter estimation for three different models (D, B&D, and E; left, middle, and right, respectively) for two datasets (Wold, left and middle; Hebenstreit.a, right). Solid lines are kernel density estimates for sequencing read starting positions for different length categories (color code, inset), each containing data for all mRNAs with lengths within 10% of the length category.
(C) MCMC parameter estimates for a selection of SMART and poly-A-tagging datasets. The bar heights correspond to the medians; the error bars correspond to the median absolute deviations.
different lengths (see Note - previous approaches to correct coverage bias inMethod Details).
Using our probabilistic framework, we can predict the ex-pected sequencing read numbers for any transcript length, tailored to the library preparation protocol that was used and with parameters inferred from the fit to the corresponding RNA-seq dataset. The expected read numbers are proportional to the areas under the coverage curves that our models predict. Normalizing read numbers of transcripts by the area under the coverage curves for their corresponding length will thus remove the bias and provide a more precise abundance estimate (Method Details). Plotting transcript lengths versus these abun-dance estimates reveals that model E approaches a linear mea-sure equivalent to FPKM (and model A withq1=q2= 0) for longer
transcripts, while the other models reach plateaus at roughly 4 kb using a single parameter set close to inferred ones ( Fig-ure 4A). This highlights protocol-specific gene length dependent sensitivity, since the areas our models predict estimate the rela-tive mass of an mRNA that is converted to double-stranded cDNA, if non-enzyme-induced losses, such as incomplete primer binding, are ignored. Increasing transcript length beyond
4 kb does not increase sensitivity for non-random priming protocols.
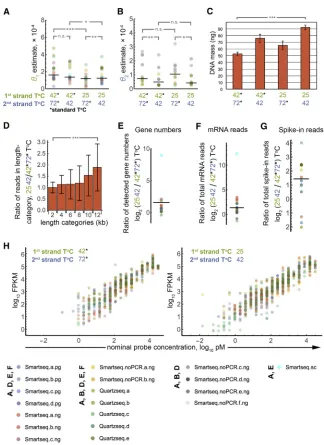
[image:11.603.51.375.95.540.2]The length scaling of models B–D also means that FPKM-based measures strongly underestimate long transcripts pre-pared with SMART or poly-A-tagging datasets due to enzyme drop-offs. Benchmarking this prediction based on correlation with standard qPCR or microarray data is not useful per se as Figure 3. Model Correctly Infers Increased Enzyme Processivities upon Lowered Reac-tion Temperatures
(A) MCMC parameter estimates forq1for diverse RNA-seq samples (Table S1, color code on bottom of figure) prepared with altered reaction tempera-tures during first- and second-strand syntheses. ‘‘Standard’’ temperatures were 42C and 72C for first- and second-strand, respectively, which were lowered to 25C and 42C, respectively, in the designated samples (black horizontal lines indicate the median; *p%0.051, **p%0.01, ***p%0.001, one-sided Wilcoxon signed-rank test).
(B) As (A) forq2.
(C) cDNA yield increases upon altered reaction temperatures. Starting amounts were 100 ng mRNA in all samples. DNA mass was measured by Qubit (which does not detect RNA). ***p%0.001, one-sided t test.
(D) Fraction of reads mapping to transcripts in different length categories (0–2 kb, 2–4 kb,., 10– 12 kb; >12 kb not included in figure) were deter-mined for sequencing samples with lowered in-cubation temperatures (first- and second-strand synthesis at 25C and 42C, respectively) as indi-cated by color code at the bottom of the figure. The fractions were then normalized to the corre-sponding length category for standard incubation temperatures. ***p%0.001, Mann-Whitney U test. (E) Increased numbers of genes are detected upon lowered incubation temperatures. The log2ratio of the numbers of detected genes for reduced tem-perature versus standard temtem-peratures is shown for different RNA-seq samples as indicated by color code at the bottom. The black horizontal line indicates the median.
(F) Increased total sequencing read numbers map to mRNAs upon lowered incubation temperatures. The log2 ratio of read numbers for reduced temperature versus standard temperatures for different RNA-seq samples as indicated by color code at the bottom is shown. The black horizontal line indicates the median.
(G) Same as (F) for ERCC-mix1 spike-in probes. (H) Detection of ERCC-mix1 spike-in probes versus nominal concentrations for diverse se-quencing samples (color code at bottom). Bar heights in bar charts corresponds to the mean of independent replicates (three in C). Error bars correspond to sample SD.
the latter are mostly subject to the same protocol-derived biases we are describing. However, the Wold (SMART) dataset contains a set of spike-in RNA probes of different lengths at known rela-tive concentrations (Jiang et al., 2011). The longest of these probes is still comparatively short, at 2,022 bases. Yet, plotting normalized (by nominal probe concentration) and standardized (subtraction of mean and division by SD) Cufflinks or RSEM abundance estimates versus probe length reveals negative trends, confirming our prediction of length-dependent underes-timation (Figure 4B). Applying our abundance estimates derived from the fits to the model B&D almost completely eliminates this trend (Figure 4B).
To extend this analysis to greater transcript lengths, we randomly selected 12 genes (Table S2) covering mRNA lengths from 2 to 22 kb with intermediate read counts from our RNA-seq samples (Table S1; we included samples correspond-ing to different incubation temperatures and pooled these after quantifying them separately to maximize the data we were using; the different temperatures are thus not relevant in this analysis). Quantifying their expression levels based on Cufflinks, RSEM, or our Model D fits yields similar results as above; Cufflinks and RSEM estimates exhibit anti-correlation with mRNA length, which is much less pronounced with our model (Figure 4C).
Next, we experimentally test the actual expression levels of the selected transcripts and how they related to their lengths. To this end, we performed qPCR on the same RNA samples, but using primers pairs close (<200 bases) to the 30ends of the mRNAs in order to strongly limit the effects of enzyme con-version. Indeed, the results demonstrate better agreement with our models than established methods regarding the measured mRNA abundances versus their lengths (Figure 4C). Further-more, correlation between the qPCR results and RNA-seq expression estimates is higher for our model than for Cufflinks or RSEM (Figure S8a). Notably, transcript expression levels, in particular at the low range, still appeared moderately anti-corre-lated with length after correction, even with the RNA fragmenta-tion (Figure S8b) and qPCR data (Figure 4C), which support the notion that, biologically, longer genes are on average expressed at a lower level.
Finally, we wanted to test whether the improved, protocol-specific mRNA quantification of our method can reduce li-brary-preparation-induced differences among biological data-sets. We have included in our study four datasets for the same cell type (Th2 cells) but using different library preparation proto-cols. If our method provides more reliable estimates for expres-sion levels, its application should increase correlations among the datasets. We performed individual model fits tailored to the
library preparation protocols used in each case and calculated correlations among the datasets with regards to expression levels of all genes. Our models indeed yield higher correlations in most cases compared to Cufflinks- and RSEM-based expres-sion quantification, even though our models do not even take ac-count of sequence-specific, local bias (Figure 4D).
DISCUSSION
We present here a mathematical framework to model library preparation protocols, which addresses several important issues with regards to RNA-seq and, specifically, scRNA-seq. Our approach offers a unified treatment of coverage bias, inference of reaction mechanisms, quantification, sensitivity, and design guidance for library preparation protocols. It can be easily adapt-ed to protocols not coveradapt-ed here and to future developments.
Protocols with limited bias, such as those using RNA fragmen-tation, will profit from our approach as well; sample preparation of these can potentially be improved based on general insights generated with our framework, such as the cDNA-yield increasing effects of altered incubation temperatures. Further-more, our models can be easily extended to take account of RNA degradation (see Note - previous approaches to correct coverage bias in Method Details); although this is not imple-mented yet, our approach of modeling the logics of sample prep-aration permits inclusion of RNA degradation mechanisms in our models and thus potentially allows analysis and/or correction of their effects. It is also straightforward to integrate and combine our bias correction with previous methods focused on other is-sues such as the sequence-specific bias; our abundance esti-mates can be simply included as correction factors, e.g., in the likelihood functions for read numbers of individual isoforms, while the model fitting and thus learning of parameters can be performed on a reduced gene set without overlapping genes.
A first application of our modeling framework suggests an incomplete understanding of the mechanisms underlying SMART protocols and yields processivities of enzymes during library preparation. Notably, our approach presents a novel alter-native to processivity measurements by radioactive footprint as-says (Bambara et al., 1995). An interesting extension of this aspect of our work would be to explore alternatives to the expo-nential enzyme drop-offs we assumed. Usage of enzymes under saturating conditions might feasibly result in strands that corre-spond to concatenates of several individual polymerization pro-cesses, requiring more complex models (Method Details).
Another prediction from our study is the substantial underesti-mation of expression levels of long transcripts with poly-A
Figure 4. Quantification Based on Our Novel Modeling Approach
(A) Length dependency of abundance estimates for our models. The estimates are normalized to unity at length 2 kb. Parameter settings are shown in the table on the right.
(B) Abundance estimates for RNA spike-ins (ERCC-mix1) of the Wold dataset are plotted versus their lengths for three different bias-correction approaches (Cufflinks, blue; RSEM, green; our model B&D fit, orange). Each dot corresponds to one probe. Fitted trend lines and their formulas are shown. Standardized measures (Zscores) are used to make the approaches comparable.
(C) Abundance estimates for twelve randomly selected mRNAs (Table S2) covering a wide range of lengths. RNA-seq samples deriving from two different RNA samples (Table S1) were quantified by RSEM, Cufflinks, or our model D as indicated. In parallel, the corresponding two RNA samples (dots and triangle symbols, respectively) were subjected to qPCR for the same twelve genes. Presentation and analysis as in (B).
(D) Correlation matrices for abundance estimates of four datasets for the same cell type (resting Th2 cells) prepared with different library preparation protocols (Hebenstreit.a/b, random priming; Wei, poly-A tagging; Vahedi, RNA fragmentation). Different quantification approaches were used: Cufflinks (left panel), RSEM (middle panel), and our model fittings (Hebenstreit.a/b, model E; Wei, model B&D; Vahedi, model A). SeeTable 1for details of the datasets.
priming and SMART protocols if read numbers are assumed to scale linearly versus length. This is due to the small fraction of a long mRNA that becomes double-stranded cDNA and also im-plies under-exploitation of the starting material, thus forgoing a potentially higher sensitivity with current scRNA-seq protocols. Inclusion of spike-in probes that are longer than the current stan-dard (< 2 kb) might be valuable for RNA-seq experiments in gen-eral to allow for better monitoring of this effect. This might require a different probe production technique from the commonly em-ployed in vitro transcription, which becomes ineffective for long templates.
STAR+METHODS
Detailed methods are provided in the online version of this paper and include the following:
d KEY RESOURCES TABLE
d CONTACT FOR REAGENT AND RESOURCE SHARING d EXPERIMENTAL MODEL AND SUBJECT DETAILS
B Mice
d METHOD DETAILS
B RNA isolation and preparation B SMART-seq, SMART-seq2 B Quartz-seq
B qPCR & RNA-seq length correlation analysis B Data processing
B Parameter estimation
B Note - previous approaches to correct coverage bias B Models
d QUANTIFICATION AND STATISTICAL ANALYSIS
d DATA AND SOFTWARE AVAILABILITY B Data Resources
SUPPLEMENTAL INFORMATION
Supplemental Information includes eight figures and two tables and can be found with this article online athttp://dx.doi.org/10.1016/j.cels.2016.10.012.
AUTHOR CONTRIBUTIONS
Conceptualization, D.H.; Methodology, D.H. and V.S.; Software V.S. and D.H.; Formal analysis, D.H. and V.S.; Investigation, N.A. and M.W.; Writing – Original Draft, D.H.; Writing – Review & Editing, D.H., V.S., N.A., and M.W.; Funding Acquisition, D.H.; Supervision, D.H. and V.S.
ACKNOWLEDGMENTS
We would like to thank Mistianne Feeney, Malika Saint, Francois Bertaux, and Sam Marguerat for critically reading the manuscript. The work was supported by Royal Society research grant RG130085, BBSRC research grant BB/ L006340/1, and BBSRC research grant BB/M017982/1.
Received: April 11, 2016 Revised: July 28, 2016 Accepted: October 13, 2016 Published: November 10, 2016
REFERENCES
Adiconis, X., Borges-Rivera, D., Satija, R., DeLuca, D.S., Busby, M.A., Berlin, A.M., Sivachenko, A., Thompson, D.A., Wysoker, A., Fennell, T., et al. (2013).
Comparative analysis of RNA sequencing methods for degraded or low-input samples. Nat. Methods10, 623–629.
Bambara, R.A., Fay, P.J., and Mallaber, L.M. (1995). Methods of analyzing processivity. Methods Enzymol.262, 270–280.
Bhargava, V., Head, S.R., Ordoukhanian, P., Mercola, M., and Subramaniam, S. (2014). Technical variations in low-input RNA-seq methodologies. Sci. Rep.
4, 3678.
Bibillo, A., and Eickbush, T.H. (2002). High processivity of the reverse tran-scriptase from a non-long terminal repeat retrotransposon. J. Biol. Chem.
277, 34836–34845.
Bohnert, R., and R€atsch, G. (2010). rQuant.web: A tool for RNA-Seq-based transcript quantitation. Nucleic Acids Res.38, W348–W351.
CSHL (2005). Synthesis of complementary DNA. Nat. Methods2, 151–152.
Deng, Q., Ramsko¨ld, D., Reinius, B., and Sandberg, R. (2014). Single-cell RNA-seq reveals dynamic, random monoallelic gene expression in mammalian cells. Science343, 193–196.
Gansauge, M.T., and Meyer, M. (2013). Single-stranded DNA library prepara-tion for the sequencing of ancient or damaged DNA. Nat. Protoc.8, 737–748.
Griebel, T., Zacher, B., Ribeca, P., Raineri, E., Lacroix, V., Guigo´, R., and Sammeth, M. (2012). Modelling and simulating generic RNA-Seq experiments with the flux simulator. Nucleic Acids Res.40, 10073–10083.
Gr€un, D., Kester, L., and van Oudenaarden, A. (2014). Validation of noise models for single-cell transcriptomics. Nat. Methods11, 637–640.
Haario, H., Saksman, E., and Tamminen, J. (2001). An adaptive metropolis algorithm. Bernoulli7, 223–242.
Hansen, K.D., Brenner, S.E., and Dudoit, S. (2010). Biases in Illumina transcrip-tome sequencing caused by random hexamer priming. Nucleic Acids Res.38, e131.
Hashimshony, T., Wagner, F., Sher, N., and Yanai, I. (2012). CEL-Seq: Single-cell RNA-Seq by multiplexed linear amplification. Cell Rep.2, 666–673.
Hashimshony, T., Senderovich, N., Avital, G., Klochendler, A., de Leeuw, Y., Anavy, L., Gennert, D., Li, S., Livak, K.J., Rozenblatt-Rosen, O., et al. (2016). CEL-Seq2: Sensitive highly-multiplexed single-cell RNA-Seq. Genome Biol.
17, 77.
Hebenstreit, D. (2012). Methods, challenges and potentials of single cell RNA-seq. Biology (Basel)1, 658–667.
Hebenstreit, D., Fang, M., Gu, M., Charoensawan, V., van Oudenaarden, A., and Teichmann, S.A. (2011). RNA sequencing reveals two major classes of gene expression levels in metazoan cells. Mol. Syst. Biol.7, 497.
Houseley, J., and Tollervey, D. (2009). The many pathways of RNA degrada-tion. Cell136, 763–776.
Howard, B.E., and Heber, S. (2010). Towards reliable isoform quantification using RNA-SEQ data. BMC Bioinformatics11(Suppl 3), S6.
Hu, Y., Liu, Y., Mao, X., Jia, C., Ferguson, J.F., Xue, C., Reilly, M.P., Li, H., and Li, M. (2014). PennSeq: Accurate isoform-specific gene expression quantifica-tion in RNA-Seq by modeling non-uniform read distribuquantifica-tion. Nucleic Acids Res.
42, e20.
Huang, Y., Hu, Y., Jones, C.D., MacLeod, J.N., Chiang, D.Y., Liu, Y., Prins, J.F., and Liu, J. (2013). A robust method for transcript quantification with RNA-seq data. J. Comput. Biol.20, 167–187.
Islam, S., Kjallquist, U., Moliner, A., Zajac, P., Fan, J.B., Lo¨nnerberg, P., and€ Linnarsson, S. (2012). Highly multiplexed and strand-specific single-cell RNA 50end sequencing. Nat. Protoc.7, 813–828.
Islam, S., Zeisel, A., Joost, S., La Manno, G., Zajac, P., Kasper, M., Lo¨nnerberg, P., and Linnarsson, S. (2014). Quantitative single-cell RNA-seq with unique molecular identifiers. Nat. Methods11, 163–166.
Jiang, L., Schlesinger, F., Davis, C.A., Zhang, Y., Li, R., Salit, M., Gingeras, T.R., and Oliver, B. (2011). Synthetic spike-in standards for RNA-seq experi-ments. Genome Res.21, 1543–1551.
Joseph, S., and David, W.R. (2001). Molecular Cloning: A Laboratory Manual (Cold Spring Harbor Laboratory Press).
Langmead, B., Trapnell, C., Pop, M., and Salzberg, S.L. (2009). Ultrafast and memory-efficient alignment of short DNA sequences to the human genome. Genome Biol.10, R25.
Li, B., and Dewey, C.N. (2011). RSEM: Accurate transcript quantification from RNA-Seq data with or without a reference genome. BMC Bioinformatics
12, 323.
Li, W., and Jiang, T. (2012). Transcriptome assembly and isoform expression level estimation from biased RNA-Seq reads. Bioinformatics28, 2914–2921.
Li, B., Ruotti, V., Stewart, R.M., Thomson, J.A., and Dewey, C.N. (2010a). RNA-seq gene expression estimation with read mapping uncertainty. Bioinformatics
26, 493–500.
Li, J., Jiang, H., and Wong, W.H. (2010b). Modeling non-uniformity in short-read rates in RNA-Seq data. Genome Biol.11, R50.
Macosko, E.Z., Basu, A., Satija, R., Nemesh, J., Shekhar, K., Goldman, M., Tirosh, I., Bialas, A.R., Kamitaki, N., Martersteck, E.M., et al. (2015). Highly par-allel genome-wide expression profiling of individual cells using nanoliter drop-lets. Cell161, 1202–1214.
Mahata, B., Zhang, X., Kolodziejczyk, A.A., Proserpio, V., Haim-Vilmovsky, L., Taylor, A.E., Hebenstreit, D., Dingler, F.A., Moignard, V., Go¨ttgens, B., et al. (2014). Single-cell RNA sequencing reveals T helper cells synthesizing steroids de novo to contribute to immune homeostasis. Cell Rep.7, 1130–1142.
Mortazavi, A., Williams, B.A., McCue, K., Schaeffer, L., and Wold, B. (2008). Mapping and quantifying mammalian transcriptomes by RNA-Seq. Nat. Methods5, 621–628.
Nakamura, T., Yabuta, Y., Okamoto, I., Aramaki, S., Yokobayashi, S., Kurimoto, K., Sekiguchi, K., Nakagawa, M., Yamamoto, T., and Saitou, M. (2015). SC3-seq: A method for highly parallel and quantitative measurement of single-cell gene expression. Nucleic Acids Res.43, e60.
Ozsolak, F., and Milos, P.M. (2011). Single-molecule direct RNA sequencing without cDNA synthesis. Wiley Interdiscip. Rev. RNA2, 565–570.
Picelli, S., Bjo¨rklund, A.K., Faridani, O.R., Sagasser, S., Winberg, G., and Sandberg, R. (2013). Smart-seq2 for sensitive full-length transcriptome profiling in single cells. Nat. Methods10, 1096–1098.
Quail, M.A., Kozarewa, I., Smith, F., Scally, A., Stephens, P.J., Durbin, R., Swerdlow, H., and Turner, D.J. (2008). A large genome center’s improvements to the Illumina sequencing system. Nat. Methods5, 1005–1010.
Ramsko¨ld, D., Luo, S., Wang, Y.C., Li, R., Deng, Q., Faridani, O.R., Daniels, G.A., Khrebtukova, I., Loring, J.F., Laurent, L.C., et al. (2012). Full-length mRNA-Seq from single-cell levels of RNA and individual circulating tumor cells. Nat. Biotechnol.30, 777–782.
Ritz, C., and Spiess, A.-N. (2008). qpcR: An R package for sigmoidal model se-lection in quantitative real-time polymerase chain reaction analysis. Bioinformatics24, 1549–1551.
Roberts, A., Trapnell, C., Donaghey, J., Rinn, J.L., and Pachter, L. (2011). Improving RNA-Seq expression estimates by correcting for fragment bias. Genome Biol.12, R22.
Sasagawa, Y., Nikaido, I., Hayashi, T., Danno, H., Uno, K.D., Imai, T., and Ueda, H.R. (2013). Quartz-Seq: A highly reproducible and sensitive single-cell RNA sequencing method, reveals non-genetic gene-expression heteroge-neity. Genome Biol.14, R31.
Shalek, A.K., Satija, R., Adiconis, X., Gertner, R.S., Gaublomme, J.T., Raychowdhury, R., Schwartz, S., Yosef, N., Malboeuf, C., Lu, D., et al. (2013). Single-cell transcriptomics reveals bimodality in expression and splicing in immune cells. Nature498, 236–240.
Shapiro, E., Biezuner, T., and Linnarsson, S. (2013). Single-cell sequencing-based technologies will revolutionize whole-organism science. Nat. Rev. Genet.14, 618–630.
Stegle, O., Teichmann, S.A., and Marioni, J.C. (2015). Computational and analytical challenges in single-cell transcriptomics. Nat. Rev. Genet. 16, 133–145.
Tang, F., Barbacioru, C., Wang, Y., Nordman, E., Lee, C., Xu, N., Wang, X., Bodeau, J., Tuch, B.B., Siddiqui, A., et al. (2009). mRNA-Seq whole-transcrip-tome analysis of a single cell. Nat. Methods6, 377–382.
Tang, F., Lao, K., and Surani, M.A. (2011). Development and applications of single-cell transcriptome analysis. Nat. Methods8(4, Suppl), S6–S11.
Tang, D.T., Plessy, C., Salimullah, M., Suzuki, A.M., Calligaris, R., Gustincich, S., and Carninci, P. (2013). Suppression of artifacts and barcode bias in high-throughput transcriptome analyses utilizing template switching. Nucleic Acids Res.41, e44.
Trapnell, C., Roberts, A., Goff, L., Pertea, G., Kim, D., Kelley, D.R., Pimentel, H., Salzberg, S.L., Rinn, J.L., and Pachter, L. (2012). Differential gene and tran-script expression analysis of RNA-seq experiments with TopHat and Cufflinks. Nat. Protoc.7, 562–578.
Tuerk, A., Wiktorin, G., and G€uler, S. (2014). Mixture models reveal multiple po-sitional bias types in RNA-Seq data and lead to accurate transcript concentra-tion estimates. bioRxiv. Published online November 24, 2014.http://dx.doi. org/10.1101/011767.
Vahedi, G., Takahashi, H., Nakayamada, S., Sun, H.W., Sartorelli, V., Kanno, Y., and O’Shea, J.J. (2012). STATs shape the active enhancer landscape of T cell populations. Cell151, 981–993.
Von Hippel, P.H., Fairfield, F.R., and Dolejsi, M.K. (1994). On the processivity of polymerases. Ann. N Y Acad. Sci.726, 118–131.
Wan, L., Yan, X., Chen, T., and Sun, F. (2012). Modeling RNA degradation for RNA-Seq with applications. Biostatistics13, 734–747.
Wang, Z., Gerstein, M., and Snyder, M. (2009). RNA-Seq: A revolutionary tool for transcriptomics. Nat. Rev. Genet.10, 57–63.
Wei, G., Abraham, B.J., Yagi, R., Jothi, R., Cui, K., Sharma, S., Narlikar, L., Northrup, D.L., Tang, Q., Paul, W.E., et al. (2011). Genome-wide analyses of transcription factor GATA3-mediated gene regulation in distinct T cell types. Immunity35, 299–311.
Wu, Z., Wang, X., and Zhang, X. (2011). Using non-uniform read distribution models to improve isoform expression inference in RNA-Seq. Bioinformatics
27, 502–508.
Zheng, W., Chung, L.M., and Zhao, H. (2011). Bias detection and correction in RNA-Sequencing data. BMC Bioinformatics12, 290.
Zhu, Y.Y., Machleder, E.M., Chenchik, A., Li, R., and Siebert, P.D. (2001). Reverse transcriptase template switching: A SMART approach for full-length cDNA library construction. Biotechniques30, 892–897.
STAR
+
METHODS
KEY RESOURCES TABLE
REAGENT or RESOURCE SOURCE IDENTIFIER Antibodies
Mouse FITC CD5+ eBioscience 11-0051-81; RRID: AB_464907 Chemicals, Peptides, and Recombinant Proteins
Smart MMLV Reverse Transcriptase Clontech Cat#639524 Kappa Taq KappaBiosystems Cat#07958447001 SMARTer cDNA Synthesis Kit Clontech Cat#634925 RNase Inhibitor, Murine New England Biolabs Cat#M0314 Control Mouse Liver Total RNA Clontech Cat#636603 Sensimix SYBR No-Rox BioLine Cat#QT650-05 RNase H ThermoFisher Cat#EN0201 SuperScript II ThermoFisher Cat#18064014 dNTPs (Individual) New England Biolabs Part#N0446S Lympholyte-M Cell Separation Media Cedarlane labs Code#CL5030 Exonuclease I New England Biolabs Part#M0293 Deoxynucleotide (dNTP) Solution Set New England Biolabs Part#N0446S Terminal deoxynucleotidyl transferase (TdT) Promega Cat#M1871 NP-40 ThermoFisher Cat#28324 Agencourt Ampure XP Beads Beckman Coulter Part#A63881 polyA Spin mRNA Isolation Kit New England Biolabs Cat#S1560S TRIzol Reagent Thermofisher Cat#15596018 NEB next qPCR quantification kit New England Biolabs Cat#E7630L Critical Commercial Assays
Nextera XT DNA Library Preparation kit Illumina Cat#FC-131-1024 Nextera XT index kit Illumina Cat#FC-131-1001 Miseq Reagent kit v3 (150 cycle) Illumina Cat#MS-102-3001 Qubit Fluorometric Quantitation Thermofisher Cat#Q32866 Agilent 2100 high sensitivity kit Agilent Technologies G2939AA Deposited Data
Data Files for RNA sequencing This Paper GEO: GSE84785 For previously published datasets used in
this study seeTable 1
Various N/A
Experimental Models: Organisms/Strains
Mouse B6CBF1 wildtype Rodent Facility, University of Warwick N/A Sequence-Based Reagents
For qPCR primers seeTable S2 This Paper N/A Smart-seq 2 Template Switching
Oligonucleotide AAGCAGTGGTATCAA CGCAGAGTACrGrG+G
Picelli et al., 2013 N/A
Quartz-seq RT primer (WTA) TATAGAATT CGCGGCCGCTCGCGATAATACGACTC ACTATAGGGCGTTTTTTTTTTTTTTTTTT TTTTTT
Sasagawa et al., 2013 N/A
Quartz-seq Tagging primer TATAGAATTC GCGGCCGCTCGCGATTTTTTTTTTTTTTT TTTTTTTTT
Sasagawa et al., 2013 N/A
CONTACT FOR REAGENT AND RESOURCE SHARING
Further information and requests for reagents may be directed to Lead Contact Daniel Hebenstreit ([email protected]).
EXPERIMENTAL MODEL AND SUBJECT DETAILS
Mice
All projects involving animals, including studies not subject to home office licensing are scrutinised and approved by AWERB, estab-lished with Home Office guidance and RSPCA/LASA guiding principles on good practice for local ethical review processes. The AWERB ensures that in all cases staff and students are trained and appropriately experienced and that the potential benefits of the research outweigh the effects on the animals concerned while being committed to the promotion of 3Rs (reduction, refinement and replacement). Wild-type B6CBF1 mice were used for splenocyte isolation from spleen. Total mouse RNA used in some exper-iments was purchased from Clontech.
METHOD DETAILS
RNA isolation and preparation
Starting RNA was either ‘‘mouse liver control RNA’’ (Clontech), or was prepared from murine lymphocytes that were isolated from a B6CBF1 mouse spleen by homogenization through a cell strainer in DMEM-10 media, followed by centrifugation through Lympholyte Ficoll (Cedarlane). For single cell preparations, lymphocytes were additionally stained with anti-CD5 FITC antibody and sorted using a FACS aria fusion (BD Bioscience) into lysis buffer immediately before first-strand synthesis (see below). Otherwise, total RNA was extracted from the lymphocyte suspension using 1 mL Trizol (Ambion) and isolated with 500mL chlo-roform before being ethanol precipitated. This was followed by poly-A purification for a selection of samples (Table S1) using the polyA Spin mRNA isolation kit (NEB) following the manufacturer’s instructions. ERCC spike-in probes were added to a subset of samples in the following way. 0.2mL of a 1:10 dilution of ERCC spike-ins (Ambion) were added to 1mL of 1mg/mL total RNA, before dilution to 100 pg/mL for low input samples, while 1 ml of a 1:10 dilution were included with the samples containing 100 ng of poly-A+ RNA (Table S1). The RNA was then divided into two equal samples for the different first-strand incubation temperatures.
SMART-seq, SMART-seq2
First-strand synthesis was performed in two separate reactions using the SMART cDNA synthesis kit (Takara Clontech), with different temperatures either 25C or 42C but otherwise following the manufacturers’ instructions. In brief, 1mg total RNA or 100 ng poly-A+ RNA from murine lymphocytes or liver in 3.5mL was mixed with 1mL of anchored 12mM Oligo(dT) (30SMART CDS Primer II A) and Continued
REAGENT or RESOURCE SOURCE IDENTIFIER Quartz-seq suppression PCR
primer /5AmMC6/GTATAGAATTCGC GGCCGCTCGCGAT
Sasagawa et al., 2013 N/A
ERCC Spike-in mix Ambion (Thermofisher) Cat#4456740 Software and Algorithms
Mathematica (v10.4) Wolfram Research, Inc. http://www.wolfram.com/education/ Bowtie (v1.0.0) Langmead et al., 2009 http://bowtie-bio.sourceforge.net/index.
shtml
MATLAB MCMC toolbox Haario et al., 2001 http://helios.fmi.fi/lainema/mcmc MATLAB and Statistics Toolbox The MathWorks, Inc. http://www.mathworks.com/includes_
content/domainRedirect/domainRedirect. html?uri=http%3A%2F%2Fuk.mathworks. com%2F
Cufflinks (v2.2.1) Trapnell et al., 2012 http://cole-trapnell-lab.github.io/cufflinks/ SRA Toolkit NCBI http://trace.ncbi.nlm.nih.gov/Traces/sra/
sra.cgi
RSEM Li and Dewey, 2011 http://deweylab.biostat.wisc.edu/rsem/
qpcR Rlibrary Ritz and Spiess, 2008 https://cran.r-project.org/web/packages/ qpcR/index.html
denatured at 72C for 3 min in a thermocycler with a heated lid, before the temperature was dropped to the desired first-strand syn-thesis temperature. The following were then added for a 60 min incubation: 1mL 10 mM dNTP mix, 1mL MMLV SMARTscribe reverse transcriptase (Takara Clontech), 0.25mL RNase inhibitor, 2mL 5X smart scribe first-strand buffer, 0.25mL 100 mM DTT, and 1mL of 12mM template switching oligo (SMARTer II A Oligonucleotide).
SMART-seq2 was carried out as described in Picelli et al. (Picelli et al., 2013), with either isolated, lysed cells or 10 pg of total input RNA. In brief, a single lysed CD5+ cell or 10 pg of total RNA (0.1mL of 100 pg/mL RNA) was mixed with 0.3mL of anchored 12mM Oligo(dT) (30SMART CDS Primer II A) and 0.3mL of 10 mM dNTPs before being denatured at 72C as in SMART-seq ‘‘1’’ as above. Upon reaching the desired first-strand synthesis temperature, 0.5 ul 5X first-strand buffer, 0.5mL betaine, 0.003ml MgCl2, 0.06ml DTT (100 mM stock), 0.25ml LNA template switching 50Oligo, 0.06ml RNase inhibitor, and 0.25ml reverse transcriptase (100 u/mL) were added. First-strand synthesis was then carried out at either 25C or 42C including the SMART-seq2 temperature cycling as in the below table where xx is the first-strand synthesis temperature.
After first-strand synthesis, each sample was again divided into two equal samples for the different second-strand incubation tem-peratures. Second-strand synthesis was performed with TAQ polymerase (KAPPA) in ‘‘Buffer A’’ tris-ammonium sulfate based buffer with 1.5 mM MgCl2and in the presence of 200mM dNTPs with 1mL of 12mM 50PCR primer (‘5-AAGCAGTGGTATCAACGCAGAGT-30) to prime the second-strand synthesis. Samples were incubated for 20 min at either 72C or 42C, followed by PCR for a subset of the SMART-seq samples. PCR was included for all SMART-seq2 samples as follows where xx is the second-strand synthesis temperature:
Qubit analysis ensured that 1 ng of dual stranded input cDNA for the ‘‘tagmentation’’ reaction using Nextera XT (Illumina) carried out following the manufacturer’s instructions including a 12 cycle PCR, at which point molecular barcodes were added iden-tifying the reverse transcription conditions. Ampure XP beads were used to purify the reaction products before quantitation and pooling.
Agilent 2100 high sensitivity kit was used to determine the average fragment size, while quantification was done with a Qubit high sensitivity kit, allowing the libraries to be diluted to a final concentration of 4 nM and pooled, this was then confirmed using the NEB next qPCR quantification kit (NEB). The reactions were then denatured with 0.1 N NaOH and 20 pmol sequenced on Illumina MiSeq using reagents kits v3 in a 75 bp paired-end run. The data were deposited at GEO (http://www.ncbi.nlm.nih.gov/geo/, accession number GEO: GSE84785).
Quartz-seq
Quartz-seq was carried out on 100 ng poly-A purified RNA as previously described (Sasagawa et al., 2013) with minor modifications. In brief, 100 ng of poly-A purified RNA in 3.5mL was mixed with 1mL of 10mM RT Primer (TATAGAATTCGCGGCCGCTCGCGATAA TACGACTCACTATAGGGCG[T]24) and denatured at 70C for 90 s in a thermocycler with a heated lid. The following was then added
Single cell Smart-seq2 first strand where xx is the chosen first-strand synthesis temperature of 25 or 42
Cycle Temperature (C) Time
1 xx 90 min
2 to 11 50 2 min 2 to 11 xx 2 min 12 xx 15 min 13 4 Infinite hold
SMART-seq (with PCR) and Smart-seq2 PCR conditions where xx is the chosen second-strand synthesis temperature of 42 or 72
Cycle Temperature (C) Time
1 98 3 min
2 to 19 98 20 s 2 to 19 68 15 s 2 to 19 xx 6 min
20 xx 5 min
to each sample at 4C: 1mL10 mM dNTP mix, 1mL MMLV SMARTscribe reverse transcriptase (Takara Clontech), 0.25mL RNase inhibitor, 2mL 5X smart scribe first-strand buffer, 0.25mL 100 mM DTT and 1mL nuclease free water. First-strand synthesis was then carried out in a thermocycler at either 25C or 42C (xx) as below:
Following first-strand synthesis, the primers were removed using Exonuclease I digestion in Kappa PCR ‘‘Buffer A’’ tris-ammonium sulfate based buffer with 1.5 mM MgCl2. Poly(A) tailing of the single stranded cDNA was then carried out using TdT in the presence of 0.15 mM dATP and Rnase H for 50 s. Second-strand synthesis was carried out for 20 min at either 72C or 42C using Kappa Taq as previously. PCR enrichment was carried out using TAQ polymerase (KAPPA) in ‘‘Buffer A’’ tris-ammonium sulfate based buffer with 1.5 mM MgCl2 and in the presence of 200mM dNTPs with 1mL of 10mM PCR primer (NH2)-GTATAGAATTCGCGGCCGCTCGCGAT, with the following PCR program:
qPCR & RNA-seq length correlation analysis
Two poly-A+ RNA samples corresponding to Smartseq.noPCR.a.ng and Smartseq.noPCR.d.ng (Table S1) were subjected to first-strand synthesis as outlined previously, with the exception that the template switching oligo (TSO) was not included. SensiMix SYBR No-ROX kit (Bioline) was used for qPCR following the manufacturer’s protocol, with the exception of a reduced volume to 10ml. PCR primers were designed to be located close to the 30ends of twelve transcripts covering a range of lengths from2 to22 kb (Table S2). We designed multiple alternative reverse primers for some genes to test precision of the qPCR (Table S2). These gave very similar results which were averaged for analysis. The reactions were carried out on a QIAGEN Rotorgene-Q 5-plex model, running software v2.1.0, using conditions as shown below:
The transcripts’ expression levels were calculated as 2-Ct, whereCtwas calculated with theqpcR Rlibrary, and were z-trans-formed separately for the two RNA samples. The pooled expression levels were plotted against the corresponding transcript lengths and a linear model was fitted with theRfunctionlm().
Quartz-seq strand where xx is the chosen first-strand synthesis temperature of 25 or 42
Cycle Temperature (C) Time 1 4 To begin
2 35 5 min
3 xx 20 min
4 70 10 min
5 4 Infinite hold
Quartz-seq enrichment PCR where xx is the chosen second-strand synthesis temperature of 42 or 72
Cycle Temperature (C) Time 1 68 To begin 2-18 98 10 s 2-18 65 15 s 2-18 xx 5 min
19 xx 5 min
20 4 Infinite hold
qPCR conditions
Cycle Temperature (C) Time
1 95 10 min
2-45 95 15 s 2-45 60 15 s 2-45 72 15 s