Original citation:
Trimmer, Mark, Shelley, Felicity C., Purdy, Kevin J., Maanoja, Susanna T.,
Chronopoulou, Panagiota-Myrsini and Jonathan, Grey. (2015) Riverbed methanotrophy
sustained by high carbon conversion efficiency. The ISME Journal
Permanent WRAP url:
http://wrap.warwick.ac.uk/70103
Copyright and reuse:
The Warwick Research Archive Portal (WRAP) makes this work of researchers of the
University of Warwick available open access under the following conditions.
This article is made available under the Attribution-NonCommercial-NoDerivatives 4.0
(CC BY-NC-ND 4.0) license and may be reused according to the conditions of the
license. For more details see:
http://creativecommons.org/licenses/by-nc-nd/4.0
/
A note on versions:
The version presented in WRAP is the published version, or, version of record, and may
be cited as it appears here.
ORIGINAL ARTICLE
Riverbed methanotrophy sustained by high carbon
conversion efficiency
Mark Trimmer
1, Felicity C Shelley
1, Kevin J Purdy
2, Susanna T Maanoja
1,
Panagiota-Myrsini Chronopoulou
1and Grey Jonathan
11School of Biological and Chemical Sciences, Queen Mary University of London, London, UK and2School of Life Sciences, University of Warwick, Coventry, UK
Our understanding of the role of freshwaters in the global carbon cycle is being revised, but there is still a lack of data, especially for the cycling of methane, in rivers and streams. Unravelling the role of methanotrophy is key to determining the fate of methane in rivers. Here we focus on the carbon conversion efficiency (CCE) of methanotrophy, that is, how much organic carbon is produced per mole of CH4oxidised, and how this is influenced by variation in methanotroph communities. First, we
show that the CCE of riverbed methanotrophs is consistently high (~50%) across a wide range of methane concentrations (~10–7000 nM) and despite a 10-fold span in the rate of methane oxidation. Then, we show that this high conversion efficiency is largely conserved (50%± confidence interval 44–56%) across pronounced variation in the key functional gene (70 operational taxonomic units (OTUs)), particulate methane monooxygenase (pmoA), and marked shifts in the abundance of Type I and Type II methanotrophs in eight replicate chalk streams. These data may suggest a degree of functional redundancy within the variable methanotroph community inhabiting these streams and that some of the variation inpmoAmay reflect a suite of enzymes of different methane affinities which enables such a large range of methane concentrations to be oxidised. The latter, coupled to their high CCE, enables the methanotrophs to sustain net production throughout the year, regardless of the marked temporal and spatial changes that occur in methane.
The ISME Journaladvance online publication, 9 June 2015; doi:10.1038/ismej.2015.98
Introduction
Freshwaters are now recognised as important com-ponents of the global carbon cycle (Coleet al., 2007; Battinet al., 2009) but there is a scarcity of data for streams and rivers (Bastvikenet al., 2011). Although small in their surface area, accounting for just 3–5% of inland water cover, some 40% of the 2.7 Pg of carbon conveyed to them each year never reaches the ocean; instead, it is mineralised to CO2 and CH4
(Battinet al., 2009). Methane is the more potent of the two carbon greenhouse gases, and although efforts to quantify its outgassing from rivers are useful (Garnier et al., 2013; Crawford et al., 2014; Sawakuchiet al., 2014), we know very little about its cycling in rivers. Proper integration of rivers into the global carbon cycle will not only require an under-standing of the specific processes that determine their emissions of methane but also the microorgan-isms that mediate both its production and consump-tion (Heet al., 2012; Nazarieset al., 2013).
The vast majority of methane produced in fresh-water ecosystems, such as wetlands, lakes and peatbogs, does not escape to the atmosphere. Instead, it is oxidised to CO2 (King et al., 1990; Nedwell
and Watson, 1995; Bastviken et al., 2002) by predominantly aerobic methanotrophic bacteria, which use methane as their sole source of energy and carbon (Trotsenko et al., 2008; He et al., 2012). Methanotrophy, therefore, not only has the potential to markedly alter the balance of carbon gases (CO2+CH4) released from any aquatic ecosystem but
it is also a form of chemosynthetic production (Trotsenko et al., 2008). Such chemosynthetic pro-duction is now known to be important in many lakes across the globe (Jones and Grey, 2011) and recently we highlighted its widespread potential throughout many rivers across southern England, which are oversaturated in methane relative to the atmosphere (Shelleyet al., 2014).
Although the methane-oxidising bacteria respon-sible for such chemosynthetic production have been identified in peatlands (Chen et al., 2008), lakes (Surakasi et al., 2010; He et al., 2012; Saidi-Mehrabad et al., 2013) and wetlands (Yun et al., 2012), they remain largely unknown in streams and rivers (Dumestre et al., 2002; Chen and Murrell, 2010). To the best of our knowledge, there is no information on the respective efficiency of carbon
Correspondence: M Trimmer, School of Biological and Chemical Sciences, Queen Mary University of London, Mile End Road, London E1 4NS, UK.
E-mail [email protected]
Received 16 October 2014; revised 27 March 2015; accepted 8 May 2015
conversion by any of these aquatic methanotroph communities. The latter will not only help to sustain the methanotrophic potential of any aquatic ecosys-tem to modulate emissions of methane but it will also govern the contribution of methane as a chemosyn-thetic energy source to the wider food web.
To date, most freshwater ecologists would argue that riverine food webs are based firmly on a combination of allochthonous detrital resources and autochthonous photosynthetic production, with only the balance between the two being contentious. However, our findings show that, even at methane concentrations in the low nanomolar range (typically 30–200 nM), riverbed methanotrophy can also con-tribute significant organic production (Trimmer
et al., 2010; Shelley et al., 2014). Furthermore, substantial quantities (Gg C y−1) of methane are
known to be oxidised in large riverine systems, including the Amazon and the Hudson River (De Angelis and Scranton, 1993; Melacket al., 2004).
In order to better understand methanotrophy in streams and rivers, we aimed to quantify its carbon conversion efficiency (CCE), that is, what fraction of methane oxidised is assimilated into biomass and whether that efficiency is influenced by variation in the methanotroph communities. During methanotro-phy, the fraction of methane assimilated (x) can be represented as (Urmannet al., 2009):
CH4þð2xÞO2-ð1xÞCO2þxCH2Oþð2xÞH2O
ð1Þ Although it is comparatively easy to measure an amount of methane oxidised by a sample of soil, water or sediments, actually converting this to an amount of carbon assimilated or fixed (xin equation (1)) has proved to be a non-trivial task (King et al., 1990; Bastviken et al., 2003; Maxfield et al., 2012). Original work with14C-CH
4in high-methane, land-fill
cover soils (Whalen et al., 1990), reported that 69%
of methane oxidised was recovered in the bulk organic carbon fraction and, in low-methane, forest soils, a lesser fraction of 31–43% (Roslev et al., 1997), whereas in the oxic water column of some lakes, the range is even more extreme (6–77%; Bastviken et al., 2003). Such changes in the efficiency with which methanotrophs harness the energy in methane will govern their production and, ultimately, understanding the CCE of methanotrophy may help to explain changes seen in the ratio of CO2
to CH4 emitted from some wetlands and lakes
(Bastvikenet al., 2003; Yvon-Durocheret al., 2014). The recent development of a stable isotope switch-ing technique (13CH
4/12CH4), in combination with
sophisticated multi-compound-specific mass spec-trometry, has begun to probe the true dynamics of carbon cycling in soils, but it cannot give a genuine measure of the efficiency of organic carbon produc-tion via methanotrophy (Maxfieldet al., 2012). Here we propose a simple alternative approach to quanti-fying the CCE of methanotrophy by quantiquanti-fying the fraction of 13C-CH
4 recovered as 13C-DIC. We have
already characterised a gradient in the potential for methanotrophy across 32 chalk streams in southern England (Shelleyet al., 2014); we now examine the CCE of methanotrophy across a subset of these streams and seek to determine whether that effi-ciency is conserved across any natural variation in the methanotroph community.
Materials and methods
Study sites and gravel collection
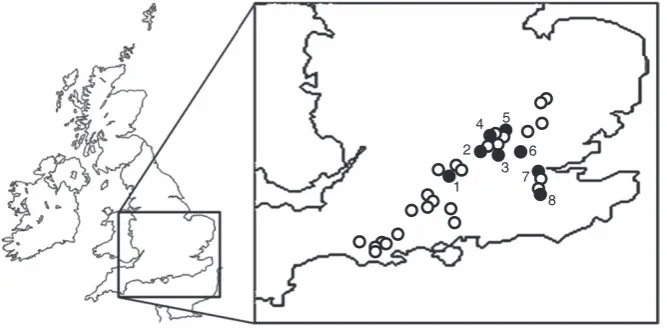
[image:3.595.142.476.519.686.2]Eight typical English chalk streams were selected from a larger suite of survey sites (Shelley et al., 2014) for which we already had the methane concentration, methane oxidation and water chemistry data (see Figure 1 main text and Supplementary Figure 1). We began by tracing 13C-CH
4 into 13C-organic and
1 2
3 4 5
6
7
8
Figure 1 Distribution of the 32 (open and closed circles) chalk streams in southern England that have all proved positive for methane oxidation (see Shelleyet al. (2014) for full details). Closed circles indicate the location of the eight streams used in this study, where the total distance east to west was approximately 110 km. 1. Lambourn, 2. Misbourne, 3. Chess, 4. Ver, 5. Gade, 6. Mimram, 7. Cray and 8. Darent.
13C-inorganic carbon in repeat batch incubations
using gravels from the River Mimram (51.80524 N–0.151212 W, Hertfordshire). Then, due to site access restrictions, for the follow-up set of 13C-DIC
yield experiments, we used gravels from the River Lambourn (51.438585 N–1.384889 W, Berkshire) where we had also worked previously (Trimmeret al., 2009, 2010). Once the method for determining the CCE was optimised and validated, we broadened our work out to the full eight streams. Surface layer riverbed gravels (n= 5) were sampled using a kick net and stored in a portable refrigerator for return to the laboratory where they were pooled and mixed, and then rinsed and sieved (1.4 mm⩽xo5.66 mm) to remove any inver-tebrates (Trimmeret al., 2009).
Tracing13C-CH
4into13C-organic and13C-inorganic
carbon in repeat batch incubations
Subsamples (~8 g) of gravel were weighed into serum bottles (20 ml) along with air-equilibrated river water (10 ml) and then sealed, leaving an air headspace. The vials were enriched with13C-CH
4(99 atom%) to
give 445 p.p.m. in the headspace and 613 nM(±50 nM, s.e., n= 8) in the water phase. Higher concentrations for methane than ambient enable shorter incubations and have no effect on the measure of efficiency (see below). Additional control vials were set up with just river water. All vials were incubated on a tipper in the dark at 8°C (to mimic average river water temperature). The headspace was then measured repeatedly (every 8–12 h) for methane by GC/FID (Sanders et al., 2007) and the change in methane over the first one or two time points was used to calculate the rate of methane oxidation normalised to the dry mass of gravel. Once490% of the methane had been oxidised in each batch, the headspace was analysed for 13C-CO
2 by continuous flow isotope
ratio mass spectrometry (CF/IRMS), and then the water was removed, acidified (50μl HCl 12.2 M), and measured for13C as DIC (SCO
2, HCO3−and CO32−) by
CF/IRMS (Miyajima et al., 1995; Trimmer et al., 2009). Summation of13CO
2plus13C-DIC equalled the
total amount of 13C-CH
4 metabolised to inorganic
carbon. After each incubation, a subsample of the gravel (2 g) was harvested, freeze dried and stored at −18 °C for analysis of13C in either the lipid or bulk
organic carbon (TOC) fraction (see below). New water was added to the remaining gravel and the vials enriched again with CH4. This was repeated six
more times to give eight batches in total. Thus, the labelling of TOC on the gravel was a cumulative measure and, as both headspace and water were replaced, the DIC was discrete for each incubation.
Quantifying the yield of bulk13C-organic carbon by wet
oxidation to CO2
An adaptation of a standard wet oxidation method (no. 505C; (APHA, 1995)) was used to recover and quantify the yield of bulk 13C-organic carbon from
the harvested gravels (see Supplementary Methods and Supplementary Figure 2 for recovery and sensitivity of the wet oxidation assay). After oxidation, the head-space was analysed for CO2, first by GC/FID (as above
but after catalytic reduction to CH4over hot nickel), to
quantify the TOC and then by CF/IRMS for13C-CO 2to
quantify the labelled fraction (as above).
Quantifying the yield of13C-lipids
A crude lipid extract was performed on the freeze-dried gravels (see Supplementary Methods for details) that would have included other hydrophobic compounds, such as lipopolysaccharides (Gurr and Harwood, 1991; Parrish et al., 2000). After recovery of the organic layers, the extracts were pooled, concentrated (to 250μl) under N2 and stored at
−18 °C until later combustion and elemental analysis coupled to CF/IRMS (Trimmer et al., 2009). Analy-tical controls of just UHP water were added to every batch.
Quantifying the CCE by the yield of13C-DIC
(SCO2, HCO3−and CO32−)
After establishing that we could recover 100% of the
13C-CH
4as either13C-DIC or13C-organic carbon (bulk
plus crude lipid), we could use the13C-DIC fraction
to more simply quantify the efficiency of organic carbon production, without the need to quantita-tively extract and purify the organic fractions (see Supplementary Table 1 and Results). If the produc-tion of 13C-DIC is linear over time, with an origin
through zero, then all of that13C-DIC must be solely
due to methanotrophic metabolism. Consequently, the proportion of13C-CH
4recovered as13C-DIC yields
a direct measure of the CCE, for example, 1–(Δ13
C-DIC/Δ13C-CH
4) =x in equation (1) and Δ is the
production or consumption of 13C-DIC or 13C-CH 4,
respectively. Here we take the total amount of
13C-CH
4 oxidised to represent gross methanotrophy,
whereas our measure of CCE is equivalent to net methanotrophy, that is, the amount of fixed carbon that would potentially be available to higher trophic levels and so is synonymous with net photosynthetic production (Shelley et al., 2014).
Accordingly, we followed the oxidation of13C-CH 4
and parallel evolution of13C-DIC during short (60 h)
incubations. Fifty-five aliquots of prepared gravels were enriched with 99 atom% 13C-CH
4 to give
1900 p.p.m. in the headspace and 2400 nM in the water (±65, s.e.,n= 55), incubated as above and then sacrificed (five vials ~ every 6 h) for the quantifica-tion of CH4and13C-DIC (as above). Next, we tested
the effect of methane concentration on the oxidation kinetics and conversion efficiency at 37 different concentrations (~10–7000 nM CH4 in the water),
spanning the seasonal range in the river water, gravel porewater (~30–150 nM) and far beyond (Trimmer et al., 2009; Shelley et al., 2014). The headspace was sampled repeatedly over time
(as above) and analysed for CH4and13C-CO2(SDIC)
to calculate the CCE (as above).
Finally, although the use of 99 atom% 13C-CH 4
assures the detectable labelling of products during short incubations (o5 h), fractionation can occur during methanotrophy (Whiticar, 1999). In order to test for any effect of fractionation, prepared gravels were incubated under 11 different mixtures of
13CH
4/12CH4: from natural abundance (here simply 12CH
4) to 99 atom%13CH4in ~ 10% increments, and
at a final concentration in the water phase of 635 nM (±32 nM, s.e., n= 10).
Streambed gravels as a natural source of copper
Copper has a well-characterised (Semrauet al., 2010) and strong overall influence on methanotrophs (physiology, gene expression, proteome) and, in particular, expression and activity of particulate methane monooxygenase (pMMO). We, therefore, tested whether the riverbed was a natural source of copper by incubating gravels with river water (as above), gravel with UHP water, river water only and UHP only, at 8 °C, as above, for 4 days. The water phase was then filtered (prerinsed 0.2μm Mini-Sart) and analysed for copper by furnace atomic absorption spectrometry (Varian GTA 110 & 220FS, Victoria, Australia) calibrated between 0 and 21μg Cu l−1.
CCE across a natural gradient of variation in methanotroph communities
Having established a simple routine assay for estimating the CCE of methanotrophy, we now wanted to estimate that efficiency using a larger set of replicated samples drawn from eight independent streams (Figure 1) and examine whether the effi-ciency was consistent across any natural variation in the methanotroph community. The CCE of methane oxidation for each sample was quantified as above. DNA was extracted from one sample from each stream using the physical lysis based method of McKew et al. (2007). Here the functional gene encoding particulate methane monooxygenase (pmoA) was amplified using PCR and variation in that pmoAwas used as a proxy for variation in the methanotroph communities across our eight streams. It is important to appreciate that we were not trying to compare diversity or determine whether the active methanotroph community varied between the streams; instead, we were testing whether or not the CCE of methane oxidation was conserved across streams with naturally varying oxidation activity and methanotroph communities. In addition, we examined intrastream variation in the methanotroph communities, by extracting DNA from six separate gravel samples collected at 50 m intervals along a 250-m reach of the River Lambourn. Details of the DNA extraction method and amplification of pmoA gene fragments are provided as Supplementary Information.
Molecular analysis of the pmoA gene to assess the natural variation in methanotroph communities
454 sequencing of the pmoA gene was performed at the Research and Testing Laboratory (http://www. researchandtesting.com/index.php). Sequences were processed in the QIIME pipeline and its associated modules (Caporasoet al., 2010). Details of sequence processing are given in Supplementary Information.
Accession numbers
The DNA sequences reported in this study were deposited in the EMBL database under the accession numbers LK052686-LK052755.
Results
Recovery of13C-CH
4in13C-organic and13C-inorganic
carbon fractions
[image:5.595.357.516.361.673.2]Methane was oxidised rapidly over the first 20–30 h in each of the eight-batch incubations (Figure 2a) and, although there was some variation in the rates of oxidation, there was no significant change over the entire 409 h of incubation, with an average rate of 1.8 nmol CH4 g−1gravel h−1(±0.2, s.e. n= 8). Note,
Figure 2 Oxidation and incorporation of13C-CH
4during repeat
batch incubations with riverbed gravel. (a) Rapid initial rates of methane oxidation following each sequential enrichment of the headspace with 13C-CH
4. (b) Resulting enrichment of the lipid
(crude extract) and bulk organic components of the gravels over the entire 409 h incubation. Mean ± s.e.,n= 4 for all.
although high at 99 atom% 13C, the degree of 13C
labelling used in the experiments had no measurable effect on the rates of methane oxidation (see Supplementary Figure 3). We subdivided the 13C
assimilated into a crude lipid extract and bulk organic carbon fraction. The crude lipid extract approached an isotopic steady state (that is, an approximately constant δ13C) after about 9 days
(206 h; Figure 2b), whereas the bulk organic carbon fraction took a little longer. The difference in time to reach isotopic steady state reflected the respective size of each pool, with lipids making up 17% (±1.2 s.e.,
n= 8) of the organic carbon and the bulk fraction 83% (±1.2 s.e., n= 8). Although a steady state was only achieved around midway through the eight-batch incubation, there was no significant difference in the split between13C recovered as lipid or as the
bulk organic fraction between each batch (analysis of variance, F6,7= 0.96,P40.05). Overall, we were able
to recover all of the 13C-CH
4 introduced to the
vials (105% ± 6 s.e.,n= 8; one-samplet-test,t= 0.83,
P40.05, see Supplementary Table 1), with it being split (analysis of variance, F7,7= 1.49, P40.05), on
average, between 53% (±3) inorganic (13C-DIC) and
52% (±6) organic carbon (13C-bulk organic plus lipid
fractions). Approximately, therefore, for the repeat batch incubations, 50% of methane metabolised was fixed into organic biomass.
Quantifying the CCE by the yield of13C-DIC
In a follow-up, short (o60 h) incubation, the evolu-tion of 13C-DIC was linear over the first 28 h, after
which the low concentration of 13C-CH
4 limited
production of 13C-DIC (Figure 3a). We then used
the ratio of 13C-DIC produced per 13C-CH
4 oxidised
(0.48 ± 0.02 s.e., n= 20; Figure 3b) during the first 15 h (when linearity was greatest) to estimate CCE through methanotrophy to be 0.52 (that is, 1−0.48– 100 = 52% efficient ± 2%). Owing to the accumula-tion of CO2 from biofilm respiration during these
batch incubations (typically 1.6μMh−1in the water phase), the pH declines in parallel at around 0.1 units h−1, which is similar to the diel pattern
recorded in these rivers (Shelley et al., 2014); yet, our measure of CCE remains invariant of pH over ~ 20 h. Note that this short incubation estimates of 52% was indistinguishable from that measured directly as fixed13C-organic carbon over the previous
409 h of repeat batch incubations (52 ± 6 s.e.,n= 8, as above).
The effect of methane concentration on the oxidation kinetics and conversion efficiency
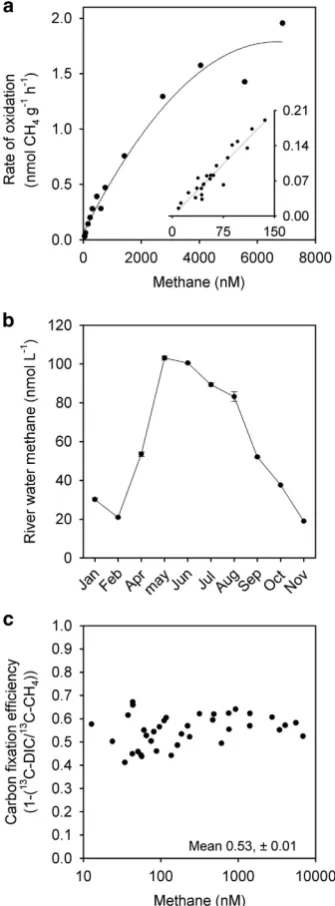
We measured a clear kinetic effect of methane concentration. The rates of oxidation increased some 10-fold over the local seasonal range in river water methane concentration (for example, ~ 20–150 nM, inset Figures 4a and b) and only began to saturate at ~ 7000 nM CH4 (Figure 4a, main), indicating a high
capacity for methane oxidation in the gravels. In contrast to the marked kinetic effect, there was no statistically significant relationship between the fraction of 13C-CH
4recovered as DIC and the initial
concentration of methane (Figure 4c). Over this range of methane concentrations, the average CCE was 53% (±1 s.e.,n= 40) and in good agreement with the previous experiments (52%).
Streambed gravels as a natural source of copper
The highest concentrations of copper were measured in the gravel plus UHP water (7.5μg Cu l−1); probably
as a consequence of the dissolution of chalk in the mildly acidic UHP water (~ pH 5.5). Gravels plus stream water yielded a final concentration of 5.1μg Cu l−1, which was greater than that for river water
only (4.0μg Cu l−1). Although long-term Cu data (see
[image:6.595.328.499.62.374.2]Supplementary Information) are only available for Figure 3 Using of the production of 13C-DIC as a measure
of CCE by riverbed methanotrophs during short-term incubations. (a) Production of13C-DIC from the oxidation of13C-CH
4over ~ 60 h
to the point of CH4limitation. Mean ± s.e.,n= 5 (b) as (a) but with the 13C-DIC as a function of the amount of13C-CH
4oxidised during the
first 15 h, that is, the period when the linearity of DIC production was strongest (r2= 0.93,Po0.001) and each datum is the result of a
single incubation. Here as the intercept is not different to 0, the slope (0.48) is equivalent to the ratio of DIC to CH4and 1–0.48 is a
measure of carbon fixation efficiency, that is, 0.52 × 100 = 52% fixed. Note this estimate of 52% was indistinguishable from the estimate based on the recovery of organic carbon during the previous repeat batch incubations of 52%.
two of the streams visited in the wider survey, the Chess and the Gade, their overall range of 1–5.3μg Cu l−1agrees with our own measurements
in the Lambourn. We would conclude, therefore, that the gravels, and underlying chalk, are a natural source of copper to the chalk streams.
CCE across a natural gradient of variation in methanotroph communities
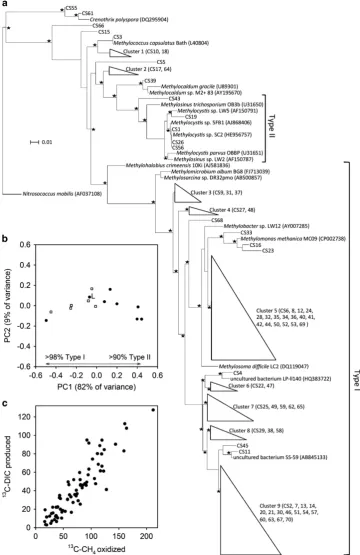
The gene for particulate methane monooxygenase (pmoA) from eight riverbed samples was success-fully amplified and then sequenced. A total of 23 212 sequences were clustered into 70 operational taxo-nomic units (OTUs). Representative sequences of all the OTUs and their closest relatives were aligned and analysed phylogenetically to reveal a diverse methanotroph community, drawn from the eight independent streams (Figure 5a; Supplementary Table 3). A principal coordinates analysis of all the
pmoA sequences was performed using the Unifrac weighted metric (Figure 5b). This plot indicated that the majority of variation in the methanotroph community (82%) was represented by the first principal coordinate (PC1 in Figure 5b) which was driven by a shift from a predominately Type I community (498%) at one end of the axis (sample 6, Mimram, Figure 1), to a Type II-dominated community (490%) at the other (samples 3 and 7, Chess and Cray, Figure 1). Diversity within the eight samples was assessed using the Simpson Diversity Index (Supplementary Table 3), which shows increased diversity in samples between the two extremes, from 0.3 in the Type I-dominated Mimram sample and Type II-dominated Chess and Cray samples, to 0.8 in the more even communities in the Lambourn, Gade and Ver samples (Supplementary Table 3).
Overall though, the distribution of Type I and Type II sequences was almost equal, with a median fraction of total sequence abundance of 42% and 51%, respectively. The majority of the Type II sequences belonged to the Methylocytis-related OTU, CS1 (median 48% of all sequences). Although the Type I were best represented (present in all replicates) by the OTU CS2 (median 10% of all sequences), most closely related to clone OK-55 (AB84086). In the Lambourn, we could also assess intrastream variation in community structure using the six samples collected from along the 250 m reach. Here we found greater similarity between the methanotrophs, with a narrower range in PC1 (−0.45 to −0.01, Figure 5b), compared with the samples drawn from across the eight streams (−0.50 to 0.44, PC1, Figure 5b). Although the variation captured by PC2 was not as pronounced as that for PC1, it was similarly greater across the streams, compared with that within the Lambourn.
As expected, gravels from the eight streams all oxidised methane with varying degrees of activity (analysis of covariance, Po0.001, n= 8) and there was also marginal variation (analysis of covariance,
Po0.047, n= 8) in the fraction of 13C-CH
4recovered
as13C-DIC (see Supplementary Table 2). In order to
derive an overall estimate for the ratio of 13C-DIC
produced per 13C-CH
4 oxidised, while taking into
[image:7.595.94.262.67.521.2]account the moderate difference between the streams, we treated‘stream’ as a random effect in a mixed-effects model (Zuur et al., 2009). We found Figure 4 Kinetic effects of methane on its rate of oxidation and
the efficiency of carbon fixation. (a) Rate of methane oxidation as a function of methane concentration from above and below ambient river concentrations (insert, first-order linear regressionr2= 0.90)
to the point of near saturation (main panel, second-order polynomial,r2= 0.97). (b) Annual pattern of river water methane
in the Lambourn (see Shelleyet al. (2014) for details and Sanders
et al.(2007) for similar patterns). (c) CCE exhibiting no relation-ship with methane concentration from ~ 10 nM CH4 to 7000 nM
CH4. Here the mean CCE value of 53% (±1) was indistinguishable
to that determined either in the repeat batch incubations (52%, ± 6) or that from13DIC over 15 h (52%, ± 2, see Figure 3). Each datum
point is the result of a single incubation.
Figure 5 A measure of the variation in the methanotroph community and overall CCE for a sample of eight chalk streams in southern England. (a) Maximum likelihood tree of representativepmoAsequences (about 200 bp). Collapsed branches are indicated by triangles. TheamoAgene ofNitrosococcus mobilis(AF037108) was used as the out group. Asterisks indicate local support values over 75%. The bar represents 0.01 average nucleotide substitutions per base. (b) Principal coordinates analysis of the methanotroph community based on
pmoAsequences. Filled circles are the eight independent stream samples and open squares the intrastream variation in the Lambourn. L is the pooled sample from the Lambourn also used to measure its CCE. (c) Standardized output from the mixed-effect model showing the best estimate of the overall ratio of DIC produced per CH4consumed (slope 0.50, s.e. 0.03,t16.4) and CCE via methanotrophy (1−0.50 × 100)
was 50% on average for the eight rivers (filled circles inb).
that a more complex random intercept and slope model (m1) provided no better a fit to the data than a simpler random intercept only model (m2; analysis of variance m1, m2, P= 0.1203). The more parsimo-nious m2, with a fixed slope, fits the data very well (slope 0.50, s.e. 0.03, t 16.4) and, accordingly, CCE (1−0.50 × 100) via methanotrophy was estimated to be 50% (95% confidence interval of 44% to 56%) for our sample of eight chalk streams, despite the pronounced variation in the methanotroph commu-nity (Figure 5c).
Discussion
Recently, we demonstrated that methanotrophy is widespread throughout the 32 major chalk streams of southern England (Shelley et al., 2014) and that it has the potential to match any increase in methane from methanogenesis that it can intercept before methane escapes the riverbed (Shelleyet al., 2015). Here we have clearly shown that the fraction of carbon fixed via that methanotrophy is consistently high which, coupled to the wide range of methane concentrations oxidised by the methanotrophs, will enable methanotrophy to track the seasonal range of methane in the river water as well as exploit the much higher concentrations found in the patches of deposited fine sediments (Sanders et al., 2007; Shelleyet al., 2015).
We have used the fraction of 13C recovered as 13C-DIC to more simply quantify the CCE of
metha-notrophy, without quantitatively extracting and purifying the organic fractions (Maxfield et al., 2012). One could argue that some intermediate metabolite of the methane oxidation pathway (for example,13C-methanol) could be released during the
initial ‘linear’ phase of 13C-DIC production. This
would then be metabolised by non-methanotrophs and, at the same time, the ‘loss’ could be counter-balanced by fixation of 13C-DIC by other
chemo-autotrophs, or via the possible carboxylation reactions of some heterotrophs (Alonso-Saez et al., 2010). If true, we would overestimate the CCE of methano-trophy, but we are confident that such an effect was negligible for the following reasons.
First, the 13C-DIC produced in our experiments
was strongly diluted by the 12C-DIC produced by
total community respiration, only constituting a maximum of 1.8% of the total DIC pool (12C+13C-DIC).
Therefore, any contribution of 13C-DIC being fixed
by any non-methanotrophic metabolism would have been negligible. Second, there was no increase in the rate of methane oxidation over the 409 h of repeat batch incubations, which indicated no net growth in the population of methanotrophs during this time. In a community at steady state, the potential loss of any
13C-methane would have been small—especially
during the short13C-DIC experiments (Figure 3a). If,
however, there was cell death alone, then, not only would the batch rates of methanotrophy have
declined with time, but they would not have reached an isotopic steady state, which was clearly not the case (Figure 2b). Eventually, though, some of the13C
assimilated by the methanotrophs will be reworked and shared among other members of the gravel community, but this process has been shown to de detectable only after some 2–3 weeks in soils (Maxfieldet al., 2012) which, again, will not affect our assay over 15 h or less.
We directly determined the CCE to be 50% on average for our sample of eight independent chalk streams. Carbon conversion efficiencies are known to be fundamentally different between Type I and Type II methanotrophs, as the RuMP (and its variants (Anthony, 1982; Trotsenkoet al., 2008; Kalyuzhnaya
et al., 2013)) pathway of C1 assimilation, largely characteristic of Type I methanotrophs, converts more C into biomass, compared with the serine, Type II, equivalent (Note that Type X methanotrophs contain genes for both assimilatory pathways (Trotsenkoet al., 2008)). Pure culture work has also shown CCE and growth rate to be greater when pMMO is expressed rather than sMMO, with that expression of pMMO being strongly regulated by Cu (Leak, Dalton, 1985; Joergensen and Degn, 1987; Semrau et al., 2010). Theoretically, the higher metabolic cost of growing on nitrate could also decrease the CCE compared with growth on NH4+
(Leak and Dalton, 1986). Clearly, in a natural mixed community, all of these factors could interact to influence the CCE but, at 50%, our CCE was consistantly towards the upper end of the commonly reported range (~30–60% CCE (Leak and Dalton, 1986; Rostkowskiet al., 2012; Feiet al., 2014)).
Nitrate provides an abundant (~6 mg l−1 on
aver-age) supply of N in both the overlying water and gravelbed of these chalk streams, as it does in many rivers throughout the developed world, (see Supplementary Figure 1 and Pretty et al., 2006; Sanderset al., 2007) whereas, although the riverbed is an area of intense mineralisation, the concentra-tion of NH4+ is orders of magnitude lower (Pretty et al., 2006). In addition, the temperature of chalk streams is comparatively stable due to groundwater buffering as per other permeable geologies (for example, sandstone and limestone (Wheater et al., 2007)). Together, the abundant supply of nitrate, along with the chalk acting as a natural source of copper and providing a stable temperature regime, appears to provide a favourable habitat for a variable community of methanotrophs (70 OTUs). Our com-munity represents a substantial proportion of the known diversity for methanotrophs in other aquatic ecosystems (Chenet al., 2008; Heet al., 2012; Reim
et al., 2012; Yunet al., 2012) and reasserts the view that wherever there is methane and oxygen there will also be methanotrophs (Trotsenko et al., 2008; Semrauet al., 2010).
Most freshwater systems studied to date (Chen and Murrell, 2010) have far higher methane concentrations than our streams (μM–mMrelative to nM) and tend to
be dominated by Type I methanotrophs. In contrast, in upland and forest soils, which are typically at equilibrium with the atomosphere (1.8 p.p.m. –80 nmol CH4l−1air),pmoAsequences are dominated
by the Type II Methylocystis. In chalk streams, the prevailing concentration of methane in the gravels is typically 40 to 100 nmol CH4 l−1
pore-water; although in summer it can reach 200 to 300 nmol CH4l−1in the overlying river water and even 2
to 4μmol CH4l−1in the anoxic patches of deposited
fine sediment (Sanders et al., 2007; Shelley et al., 2015). As expected for the gravelbed concentrations of methane, the Type II methanotroph OTU, CS1 (Methylocystisrelated (Figure 5a and Supplementary Table 3)) was a major component of the overall community (median 48% of all sequences). In contrast, however, to the prevailing perspective for freshwater systems and low-methane soils (Chen and Murrell, 2010), we found a more equitable distribu-tion of Type I (median 42% of all sequences) and Type II (median 51% of all sequences) methano-trophs, and there even appeared to be a wider variety of Type I compared with Type II methanotrophs in these low-methane streams. Some have argued that the occurence ofMethlyocystis sp. SC2, beyond its common habitat of low-methane soils, may in part be due to it encoding, and expressing, multiple methane monoxygenases with substantially different affinities for methane (Baani and Liesack, 2008; Chen and Murrell, 2010). Our observations suggest that such a trait may also be common to a wider group of methanotrophs.
Despite the variation in the methanotroph com-munities across the stream samples, a consistantly high CCE of 50% held for the methanotroph community as a whole. Our findings may suggest a degree of functional redundancy within the variable methanotroph communities inhabiting these streams, although these data do not show which methanotrophs are active in the streams, which would be required to test whether the methanotroph communities in these streams are actually function-ally redundant. In addition, some of the detected variation may reflect a suite of pmoA-encoded enzymes covering a wide range of affinities for methane (Baani and Liesack, 2008). The latter would certainly make sense given the large range of methane concentrations oxidised here (Figure 4), which would be hard to reconcile with a single enzyme of fixed affinity. Such variation would enable methanotrophs to exploit different niches along the full spectrum of methane concentrations found within rivers, from low concentrations in the clean-gravels, to high concentrations in the depos-ited patches of fine sediment (Reimet al., 2012).
The annual cycle of temperature in rivers on permeable geologies such as chalk, sandstone and limestone is buffered by the groundwater and might only vary between 8 °C in the winter to 16 °C in summer (Pretty et al., 2006). In addition, we have clearly shown that, at the methane concentrations
typical for the gravels, temperature has no effect on methane oxidation, which is similar to data on temperature effects on methane oxidation in lakes (Nguyen Thanh et al., 2010; Shelleyet al., 2015). In contrast, the concentration of methane in rivers can change by several orders of magnitude over the year, reflecting both greater methanogenesis within the river and its wider catchment, plus changes in lateral import and oxidation in the river itself (De Angelis and Lilley, 1987; De Angelis and Scranton, 1993; Kone et al., 2010; Bouillon et al., 2012). Despite the strong kinetic effect of methane concentration on oxidation rate found here, there was no significant effect on the fraction assimilated (that is, the CCE). In contrast to the consistently high CCE we found for streambed gravel communities, the range reported for methanotrophs in the oxic water column of some lakes is extreme (6–77%; Bastviken et al., 2003). In lakes, there appears to be a kinetic effect, with the highest efficiencies associated with low rates of oxidation at low concentrations of CH4 and vice
versa when methane is abundant (Bastviken et al., 2003). Such poor production and limited net growth, at high concentrations, may explain some of the increase in the efflux ratio of methane to carbon dioxide recorded in lakes and wetlands (Yvon-Durocher et al., 2014).
The role of inland freshwaters in the global methane cycle is attracting renewed interest (Bastviken et al., 2011) but whereas the potential for methane oxidation is both high and well characterised in wetlands and lakes (King et al., 1990; Tranvik et al., 2009), data from streams and rivers have been lacking. Here we have demon-strated that the variable riverbed methanotroph communities have both a high capacity to oxidise methane, as well as produce organic carbon with high efficiency. Not only will this help sustain the riverbeds potential to attenuate some of the efflux of methane but, based on the data of Shelley et al. (2014), and with a CCE of 50%, we estimate methanotrophy to produce between 2 to 4 g C m−2 y−1 down to 35 cm into the riverbed.
Production by methanotrophy is equivalent to 11% of net benthic photosynthetic primary production at the surface and provides a significant chemosyn-thetic source of carbon to the stream ecosystem as a whole.
Conflict of Interest
The authors declare no conflict of interest.
Acknowledgements
We thank Ian Sanders for technical assistance and Gabriel Yvon-Durocher for statistical guidance. FCS was supported by a studentship from the Natural Environment Research Council (NERC, UK) with CASE partner, the Freshwater Biological Association of the UK.
References
Alonso-Saez L, Galand PE, Casamayor EO, Pedros-Alio C, Bertilsson S. (2010). High bicarbonate assimilation in the dark by Arctic bacteria.ISME J4: 1581–1590. Anthony C. (1982). The Biochemistry of Methylotrophs.
Academic Press: London, UK.
APHA. (1995). Standard Methods for the Examination of Water and Wastewater, 20th edn. American Public Health Association: Washington, D.C., USA.
Baani M, Liesack W. (2008). Two isozymes of particulate methane monooxygenase with different methane oxidation kinetics are found in Methylocystis sp strain SCZ. Proc Natl Acad Sci USA 105: 10203–10208.
Bastviken D, Ejlertsson J, Sundh I, Tranvik L. (2003). Methane as a source of carbon and energy for lake pelagic food webs.Ecology84: 969–981.
Bastviken D, Ejlertsson J, Tranvik L. (2002). Measurement of methane oxidation in lakes: a comparison of methods.Environ Sci Technol36: 3354–3361. Bastviken D, Tranvik LJ, Downing JA, Crill PM,
Enrich-Prast A. (2011). Freshwater methane emissions offset the continental carbon sink.Science331: 50. Battin TJ, Luyssaert S, Kaplan LA, Aufdenkampe AK,
Richter A, Tranvik LJ. (2009). The boundless carbon cycle.Nat Geosci2: 598–600.
Bouillon S, Yambele A, Spencer RGM, Gillikin DP, Hernes PJ, Six J et al. (2012). Organic matter sources, fluxes and greenhouse gas exchange in the Oubangui River (Congo River basin).Biogeosciences9: 2045–2062. Caporaso JG, Kuczynski J, Stombaugh J, Bittinger K, Bushman FD, Costello EKet al.(2010). QIIME allows analysis of high-throughput community sequencing data.Nat Methods7: 335–336.
Chen Y, Dumont MG, McNamara NP, Chamberlain PM, Bodrossy L, Stralis-Pavese Net al.(2008). Diversity of the active methanotrophic community in acidic peat-lands as assessed by mRNA and SIP-PLFA analyses.
Environ Microbiol10: 446–459.
Chen Y, Murrell JC. (2010) Ecology of aerobic methano-trophs and their role in methane cycling. In Timmis KN (ed.) Handbook of hydrocarbon and lipid micro-biology. Springer-Verlag: Berlin, Germany, 3067–3076. Cole JJ, Prairie YT, Caraco NF, McDowell WH, Tranvik LJ,
Striegl RG et al. (2007). Plumbing the global carbon cycle: integrating inland waters into the terrestrial carbon budget.Ecosystems10: 171–184.
Crawford JT, Stanley EH, Spawn SA, Finlay JC, Loken LC, Striegl RG. (2014). Ebullitive methane emissions from oxygenated wetland streams. Glob Chang Biol 20: 3406–3422.
De Angelis MA, Lilley MD. (1987). Methane in surface waters of Oregon estuaries and rivers USA. Limnol Oceanogr32: 716–722.
De Angelis MA, Scranton MI. (1993). Fate of methane in the Hudson river and estuary.Glob Biogeochem Cycle
7: 509–523.
Dumestre JF, Casamayor EO, Massana R, Pedros-Alio C. (2002). Changes in bacterial and archaeal assemblages in an equatorial river induced by the water eutrophica-tion of Petit Saut dam reservoir (French Guiana).Aquat Microb Ecol26: 209–221.
Fei Q, Guarnieri MT, Tao L, Laurens LML, Dowe N, Pienkos PT. (2014). Bioconversion of natural gas to liquid fuel: opportunities and challenges. Biotechnol Adv32: 596–614.
Garnier J, Vilain G, Silvestre M, Billen G, Jehanno S, Poirier D et al. (2013). Budget of methane emissions from soils, livestock and the river network at the regional scale of the Seine basin (France).Biogeochemistry
116: 199–214.
Gurr MI, Harwood JL. (1991). Lipid Biochemistry: An Introduction, 4th edn. Chapman & Hall: New York, USA.
He R, Wooller MJ, Pohlman JW, Quensen J, Tiedje JM, Leigh MB. (2012). Diversity of active aerobic methano-trophs along depth profiles of arctic and subarctic lake water column and sediments.ISME J6: 1937–1948. Joergensen L, Degn H. (1987). Growth-rate and methane
affinity of a turbidostatic and oxystatic continuous culture of Methylococcus-capsulatus (Bath). Biotech-nol Lett9: 71–76.
Jones RI, Grey J. (2011). Biogenic methane in freshwater food webs.Freshwater Biol56: 213–229.
Kalyuzhnaya MG, Yang S, Rozova ON, Smalley NE, Clubb J, Lamb Aet al.(2013). Highly efficient methane biocatalysis revealed in a methanotrophic bacterium.
Nat Commun4.
King GM, Roslev P, Skovgaard H. (1990). Distribution and rate of methane oxidation in sediments of the Florida Everglades.Appl Environ Microbiol56: 2902–2911. Kone YJM, Abril G, Delille B, Borges AV. (2010). Seasonal
variability of methane in the rivers and lagoons of Ivory Coast (West Africa). Biogeochemistry 100: 21–37.
Leak DJ, Dalton H. (1986). Growth yields of methano-trophs.2. A theoretical-analysis. Appl Microbiol Biotechnol23: 477–481.
Leak DJ, Stanley SH, Dalton H. (1985) Implication of the nature of methane monooxygenase on carbon assimilation in methanotrophs In Poole RKDC (ed.)
Microbial Gas Metabolism, Mechanistic, Metabolic and Biotechnological aspects. Academic Press: London, UK, 201–208.
Maxfield PJ, Dildar N, Hornibrook ERC, Stott AW, Evershed RP. (2012). Stable isotope switching (SIS): a new stable isotope probing (SIP) approach to determine carbon flow in the soil food web and dynamics in organic matter pools. Rapid Commun Mass Spectrom26: 997–1004.
McKew BA, Coulon F, Osborn AM, Timmis KN, McGenity TJ. (2007). Determining the identity and roles of oil-metabolizing marine bacteria from the Thames estuary, UK. Environ Microbiol 9: 165–176.
Melack JM, Hess LL, Gastil M, Forsberg BR, Hamilton SK, Lima IBT et al. (2004). Regionalization of methane emissions in the Amazon Basin with microwave remote sensing.Glob Change Biol10: 530–544. Miyajima T, Yamada Y, Hanba YT, Yoshii K, Koitabashi T,
Wada E. (1995). Determining the stable-isotope ratio of total dissolved inorganic carbon in lake water by GC/C/IRMS.Limnol Oceanogr40: 994–1000.
Nazaries L, Murrell JC, Millard P, Baggs L, Singh BK. (2013). Methane, microbes and models: fundamental understanding of the soil methane cycle for future predictions.Environ Microbiol15: 2395–2417. Nedwell DB, Watson A. (1995). CH4production, oxidation
and emission in a UK ombrotrophic peat bog— influence of SO42-from acid-rain.Soil Biol Biochem27:
893–903.
methane formation and oxidation in lake sediments.
Biogeochemistry100: 185–196.
Parrish C, Abrajano T, Budge S, Helleur R, Hudson E, Pulchan K et al. Phenolic biomarkers in marine ecosystems: analysis and applications. Mar Chem 5: 193–223.
Pretty JL, Hildrew AG, Trimmer M. (2006). Nutrient dynamics in relation to surface-subsurface hydrologi-cal exchange in a groundwater fed chalk stream.
J Hydrol330: 84–100.
Reim A, Luke C, Krause S, Pratscher J, Frenzel P. (2012). One millimetre makes the difference: high-resolution analysis of methane-oxidizing bacteria and their specific activity at the oxic-anoxic interface in a flooded paddy soil.ISME J6: 2128–2139.
Roslev P, Iversen N, Henriksen K. (1997). Oxidation and assimilation of atmospheric methane by soil methane oxidizers.Appl Environ Microbiol63: 874–880. Rostkowski KH, Criddle CS, Lepech MD. (2012).
Cradle-to-gate life cycle assessment for a cradle-to-cradle cycle: biogas-to-bioplastic (and back). Environ Sci Technol
46: 9822–9829.
Saidi-Mehrabad A, He Z, Tamas I, Sharp CE, Brady AL, Rochman FFet al.(2013). Methanotrophic bacteria in oilsands tailings ponds of northern Alberta.ISME J7: 908–921.
Sanders IA, Heppell CM, Cotton JA, Wharton G, Hildrew AG, Flowers EJ et al. (2007). Emission of methane from chalk streams has potential implications for agricultural practices.Freshwater Biol52: 1176–1186. Sawakuchi HO, Bastviken D, Sawakuchi AO, Krusche AV, Ballester MVR, Richey JE. (2014). Methane emissions from Amazonian Rivers and their contribution to the global methane budget.Glob Change Biol.
Semrau JD, DiSpirito AA, Yoon S. (2010). Methanotrophs and copper.FEMS Microbiol Rev34: 496–531. Shelley F, Abdullahi F, Grey J, Trimmer M. (2015).
Microbial methane cycling in the bed of a chalk-river: oxidation has the potential to match warming enhanced methanogenesis.Freshwater Biol60: 10. Shelley F, Grey J, Trimmer M. (2014). Widespread
methanotrophic primary production in lowland chalk rivers.Proc Roy Soc B Biol Sci281: 2854–2861. Surakasi VP, Antony CP, Sharma S, Patole MS, Shouche YS. (2010). Temporal bacterial diversity and detection of putative methanotrophs in surface mats of Lonar crater lake.J Basic Microbiol50: 465–474.
Tranvik LJ, Downing JA, Cotner JB, Loiselle SA, Striegl RG, Ballatore TJ et al. (2009). Lakes and reservoirs as regulators of carbon cycling and climate. Limnol Oceanogr54: 2298–2314.
Trimmer M, Hildrew AG, Jackson MC, Pretty JL, Grey J. (2009). Evidence for the role of methane-derived carbon in a free-flowing, lowland river food web.
Limnol Oceanogr54: 1541–1547.
Trimmer M, Maanoja S, Hildrew AG, Pretty JL, Grey J. (2010). Potential carbon fixation via methane oxidation in well-oxygenated riverbed gravels.Limnol Oceanogr
55: 560–568.
Trotsenko YA, Murrell JC. (2008). Metabolic aspects of aerobic obligate methanotrophy. Adv Appl Microbiol
63: 183–229.
Urmann K, Lazzaro A, Gandolfi I, Schroth MH, Zeyer J. (2009). Response of methanotrophic activity and community structure to temperature changes in a diffusive CH4/O2counter gradient in an unsaturated
porous medium.FEMS Microbiol Ecol 69: 202–212. Whalen SC, Reeburgh WS, Sandbeck KA. (1990). Rapid
methane oxidation in a landfill cover soil. Appl Environ Microbiol56: 3405–3411.
Wheater HS, Peach D, Binley A. (2007). Characterising groundwater-dominated lowland catchments: the UK Lowland Catchment Research Programme (LOCAR).
Hydrol Earth Syst Sci11: 108–124.
Whiticar MJ. (1999). Carbon and hydrogen isotope systematics of bacterial formation and oxidation of methane.Chem Geol161: 291–314.
Yun J, Zhuang G, Ma A, Guo H, Wang Y, Zhang H. (2012). Community structure, abundance, and activity of methanotrophs in the Zoige Wetland of the Tibetan Plateau.Microb Ecol63: 835–843.
Yvon-Durocher G, Allen AP, Bastviken D, Conrad R, Gudasz C, St-Pierre A et al. (2014). Methane fluxes show consistent temperature dependence across microbial to ecosystem scales.Nature507: 488–48. Zuur A, Ieno EN, Walker N, Saveliev AA, Smith GM. (2009).
Mixed Effects Models and Extensions in Ecology with R. Springer. Springer-Verlag: New York, USA.
This work is licensed under a Creative Commons Attribution-NonCommercial-NoDerivs 4.0 International License. The images or other third party material in this article are included in the article’s Creative Commons license, unless indicated otherwise in the credit line; if the material is not included under the Creative Commons license, users will need to obtain permission from the license holder to reproduce the material. To view a copy of this license, visit http://creativecommons.org/ licenses/by-nc-nd/4.0/
Supplementary Information accompanies this paper on The ISME Journal website (http://www.nature.com/ismej)