http://wrap.warwick.ac.uk/
Original citation:
Lai, W. N., Chapman, S. C. and Dendy, R. O.. (2013) Self-consistent nonlinear kinetic
simulations of the anomalous Doppler instability of suprathermal electrons in plasmas.
Physics of Plasmas, Volume 20 (Number 10). Article number 102122.
Permanent WRAP url:
http://wrap.warwick.ac.uk/57413
Copyright and reuse:
The Warwick Research Archive Portal (WRAP) makes this work of researchers of the
University of Warwick available open access under the following conditions. Copyright ©
and all moral rights to the version of the paper presented here belong to the individual
author(s) and/or other copyright owners. To the extent reasonable and practicable the
material made available in WRAP has been checked for eligibility before being made
available.
Copies of full items can be used for personal research or study, educational, or
not-for-profit purposes without prior permission or charge. Provided that the authors, title and
full bibliographic details are credited, a hyperlink and/or URL is given for the original
metadata page and the content is not changed in any way.
Publisher’s statement:
Copyright (2013) American Institute of Physics. This article may be downloaded for
personal use only. Any other use requires prior permission of the author and the
American Institute of Physics.
The following article appeared in Physics of Plasmas, Volume 20 (Number 10). Article
number 102122 and may be found at
http://dx.doi.org/10.1063/1.4827207
A note on versions:
The version presented here may differ from the published version or, version of record, if
you wish to cite this item you are advised to consult the publisher’s version. Please see
the ‘permanent WRAP url’ above for details on accessing the published version and note
that access may require a subscription.
instability of suprathermal electrons in plasmas
W. N. Lai,1
S. C. Chapman,1, 2
and R. O. Dendy3, 1
1)Centre for Fusion, Space and Astrophysics, Department of Physics, University of Warwick, Coventry CV4 7AL,
United Kingdom
2)Department of Mathematics and Statistics, University of Tromsø, Norway
3)Euratom/ CCFE Fusion Association, Culham Science Centre, Abingdon, Oxfordshire OX14 3DB,
United Kingdom
(Dated: 01 October 2013)
Suprathermal tails in the distributions of electron velocities parallel to the magnetic field are found in many areas of plasma physics, from magnetic confinement fusion to solar system plasmas. Parallel electron kinetic energy can be transferred into plasma waves and perpendicular gyration energy of particles through the
anomalous Doppler instability (ADI), provided that energetic electrons with parallel velocities vk ≥ (ω +
Ωce)/kkare present; here Ωce denotes electron cyclotron frequency,ω the wave angular frequency andkkthe
component of wavenumber parallel to the magnetic field. This phenomenon is widely observed in tokamak plasmas. Here we present the first fully self-consistent relativistic particle-in-cell simulations of the ADI, spanning the linear and nonlinear regimes of the ADI. We test the robustness of the analytical theory in the linear regime and follow the ADI through to the steady state. By directly evaluating the parallel and
perpendicular dynamical contributions to j·E in the simulations, we follow the energy transfer between
the excited waves and the bulk and tail electron populations for the first time. We find that the ratio
Ωce/(ωpe+ Ωce) of energy transfer between parallel and perpendicular, obtained from linear analysis, does
not apply when damping is fully included, when we find it to be ωpe/(ωpe+ Ωce); here ωpe denotes the
electron plasma frequency. We also find that the ADI can arise beyond the previously expected range of
plasma parameters, in particular when Ωce> ωpe. The simulations also exhibit a spectral feature which may
correspond to observations of suprathermal narrowband emission atωpe detected from low density tokamak
plasmas.
I. INTRODUCTION
The anomalous Doppler instability (ADI)1–15 is a key
limiting mechanism for suprathermal tails in the proba-bility distribution of the component of electron velocity parallel to the magnetic field direction, vk, in a plasma.
It has been found in over four decades of experiments in
low density tokamak plasmas4–8,11,14 with both Ohmic
and lower hybrid current drive, and remains topical. For example, the ADI is believed to explain the recently ob-served relaxation oscillations in directional hard X-ray signals emitted by the energetic electron population in
the HT-7 tokamak14,15. These observations reflect the
underlying physics of the ADI, which involves a shift of energy from parallel to perpendicular particle motion, ac-companied by the excitation of waves at frequency and
wavenumber (ω,k) satisfying the anomalous Doppler
res-onance condition11,
ω−k·v=nΩ, (1)
where Ω is the cyclotron frequency andv is particle
ve-locity, specificallyn=−1 is the ADI. Analytical theory
of the linear ADI confirms that in plasmas, this applies at both the classical single-particle level12and the collec-tive level9,10 of mathematical description. Oscillations in the amplitude of the directional X-ray signal observed from tokamaks, reported most recently in Ref. 14, are believed to arise where the energetic electron tail
distri-bution undergoes repeated cycles of relaxations through the isotropising effect of the ADI in its fully nonlinear regime, followed by re-extension of the tail by the current drive processes. Importantly, the ADI can occur for tail
distributions that are monotonically decreasing in thevk
direction. In this respect the ADI differs fundamentally from inverse Landau damping as a limiting mechanism for tail distributions. Here we present, for the first time, a fully nonlinear kinetic treatment of the ADI for the electron population with parameters and topologies rel-evant to magnetically confinement fusion . By means of a well diagnosed large-scale particle-in-cell (PIC) code16, we explore how the full combined bulk and tail electron velocity distribution, together with the self-consistently excited electromagnetic fields, evolve in time and depend on plasma parameters. This is an essential step towards exploiting the potential of the anomalous Doppler effect as a spontaneous in situ diagnostic of tokamak plasma electron populations. It may also contribute to the di-agnostic and design capability for planned beam-plasma
experiments in this area17,18. The anomalous Doppler
in-stability is of interest in space plasmas, see for example Ref. 19, and is closely related20 to the instability occur-ring at the inner Lindblad resonance in spiral galaxies.
results at early and later times, for different percentagesξ
of energetic electrons and for different magnetic field ori-entations. We then track the energy transfer between ex-cited waves and the tail and bulk electron populations by
evaluation ofj·Ethrough and beyond the linear regime.
II. THE LINEAR ANOMALOUS DOPPLER INSTABILITY
We will first use linear theory to establish the regime in which the ADI will operate in our simulations. The theory of the ADI can be considered at different levels of description, quantum1,3, classical single particle12and
collective2,4–10. The conservation of energy between the
longitudinal kinetic energy and the oscillator energy in quantum wave emission by electrons in a magnetic field in the nonrelativistic limit is given by
∆ǫ=~ωk= ∆pkvk+n~Ωce, (2)
where Ωce = |qe|B/me is the electron cyclotron
fre-quency,qe andme are the electron charge and mass
re-spectively and~ is the reduced Planck’s constant. This
can be expressed as
ωk−kkvk=nΩce. (3)
The preceding equation defines the condition for
cy-clotron resonances, where n = 0 corresponds to the
Cerenkov-Landau resonance, and positive and negative
nrefer to normal and anomalous Doppler cyclotron
reso-nances respectively. Whenn=−1, the resonant parallel
velocityvk=vAD= (ωk+ Ωce)/kk. If the suprathermal
electron population is such that there is a finite number
of electrons having vk ≥ vAD, the ADI will occur
pro-vided that other counteracting effects, notably Landau damping, are overcome.
At the single particle level of description using linear analysis, the energy flows associated with an electron un-dergoing anomalous Doppler instability in a magnetised plasma are as follows: from the kinetic energy of motion parallel to the magnetic field direction, into the kinetic energy of motion perpendicular to the external magnetic
fieldBand into wave energy of the resonant excited
elec-trostatic wave, in the ratio Ωce : ωpe. The driving
con-tribution to the total linear growth rate scales with the magnitude of the tail distribution, integrated over per-pendicular velocity, at the anomalous Doppler resonant parallel velocity. For net linear growth to exist, the cor-responding Landau resonant velocity of the excited wave must lie beyond the bulk thermal population, otherwise linear Landau damping is usually sufficient to overcome the drive, thereby preventing the instability. These fea-tures carry over into the linear analysis of collective en-ergy flows calculated fromj·E. The rates at which work is done by the electrostatic field on the components of elec-tron motion parallel and perpendicular to the magnetic
k || vB / ωpe k⊥
vB
/
ωpe
0.1 0.2 0.3 0.4 0.05
0.1 0.15 0.2 0.25 0.3 0.35 0.4
−4 −3.8 −3.6 −3.4 −3.2 −3 −2.8 −2.6 −2.4
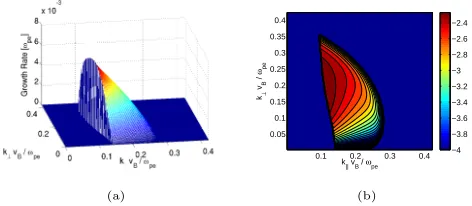
[image:3.595.324.560.51.154.2](a) (b)
Figure 1. Analytical linear growth rate of the ADI calculated from Eqns. (A.3) -(A.7) for an electron distribution with a 10% flat tail, shown in: (a) 3D plot; (b) contour plot, in (kk, k⊥) space. The growth rates are shown in units of ωpe.
See main text for model parameters.
field,Rk andR⊥, are given by the following expressions
in the linear regime10:
R⊥ =j⊥·E⊥= | E|2 4π
!
2γAD
Ωce
ωpe
, (4)
Rk=jk·Ek=| E|2
4π (2γLB+ 2γLT−2(1 +
Ωce
ωpe
)γAD). (5)
In the case when the anomalous growth rate, γAD, is
greater than the Landau damping by the tail and bulk
populations, γLT and γLB, it follows that Rk is
nega-tive whileR⊥ is positive. This implies that parallel
elec-tron kinetic energy is transferred to waves propagating in the parallel direction, which also mediate the transfer of electron parallel kinetic energy into the perpendicular direction.
For the ADI to occur, it is essential that electron and ion Landau damping of the resonant wave is weaker than
the driving term. Figure 1 shows the analytical
lin-ear growth rate of electrostatic waves derived from Eqn. (A.3) to (A.7) for an electron distribution with a flat suprathermal tail, represented analytically by Eqn. (A.2) combined with
F(vk) =
1
vM
,0≤vk≤vM, (6)
withvM ≈17vB,vT⊥ =vB, and Ωce/ωpe= 1.31. There
is a well-defined region in (k⊥, kk) space where the ADI
occurs. The boundary at smallkk in Fig. 1 reflects the
maximum velocity at which electrons are present in the
tail, whereas growth at large k is prevented by Landau
damping.
In the case of a cold magnetised plasma, there are two normal modes of electrostatic oscillations, with charac-teristic upper and lower frequenciesω1andω2given by21
ω21,2=
ω2 UH
2 ±
1 2(ω
4
[image:3.595.321.563.284.361.2]Hereω1relates to the + root andωUH = (Ωce+ωpe)1/2is
the upper hybrid frequency,θdenotes the angle between
the magnetic fieldBand the wavevectork.
III. SIMULATION METHOD
Computational study of the nonlinear evolution of an electron population undergoing anomalous Doppler in-stability, and of the character of the excited fields, is car-ried out here using particle-in-cell (PIC) simulations with one spatial and three velocity coordinates (1D3V). We
use the EPOCH PIC code16, where full ion and electron
dynamics of macroparticles with velocityv(x, t), together withE(x,v, t) andB(x,v, t), evolve self-consistently un-der the Lorentz force law and relativistic Maxwell equa-tions on staggered grids with periodic boundary condi-tions. All electron characteristic lengthscales, including Debye length and gyro-radius, are resolved in the simu-lations. The suprathermal electron parallel velocity dis-tribution in Eqn. (A.2) is initially modelled to be either flat as in Eqn. (6), or monotonically decreasing, using superposition of drifted Maxwellians:
F(vk) =
1
π1/2v T
e−(vk−vD)2/vT2, (8)
where vD is the drift velocity of the energetic electron
population, andvT is its thermal spread.
In these simulations, we initialise with a
suprather-mal electron tail extending to velocities up to 15vB −
30vB, where vB represents the thermal velocity of the
Maxwellian bulk electrons. The tail contains a small
frac-tionξof the total electron population, in the range of 1%
- 10%. We adopt the method of particle splitting, such that same number of macroparticles are used in both the bulk and tail populations to ensure sufficient statistical sampling of the tail distribution. The direction of the background magnetic field, and hence of the electron tail distribution, is oriented at an angle,θ= 45oin our
simu-lations, to the 1-D spatial simulation domain. This allows
bothkkandk⊥components relative to the magnetic field
to be captured in the simulation; finitek⊥is an essential
condition for the ADI. The parameters including tem-perature, density and magnetic field strength are chosen such that the ADI conditions are satisfied. The highly asymmetric electron tail population has non-zero mean parallel velocity, so the thermal bulk is slightly shifted such that the rest frame of the simulations has no net ve-locity with respect to the mean veve-locity of the combined electron distribution.
One of main difficulties in reproducing the ADI us-ing self-consistent simulations with ξ << 1 is that the initial growth rates are relatively small compared to the characteristic oscillation frequency, usually of the order of γ = 10−2.5ω
pe−10−4ωpe. Thus computationally
ex-pensive long timescale simulations are required. In the
present simulations, the ratio Ωce/ωpe ranges between
0.5 to 2.0. This range of Ωce/ωpe is chosen to achieve
balance between speed and resolution of the simulations.
We note that Ωce/ωpe is equivalent toλD/λL which
de-termines the grid sizes of the simulations, where λD is
the electron Debye length andλL represents the electron
Larmor radius.
The physical parameters used in the simulations, un-less otherwise specified, are |B| = 1.35×10⁻⁷T, n
e =
1.0×10⁵m−3,T
B = 3.0×10⁵K, ωpe= 1.8×10⁴rads−1
and Ωce = 2.36×10⁴rads−1. Typically the spatial
sim-ulation domain encompasses 50,000 cells containing 10 million macroparticles. While our main aim in this pa-per is to understand the physics of the ADI, the sim-ulation parameters can be extended to tokamak-like or other plasma conditions, albeit at some computational
cost. The physical parameters correspond to Ωce∼ωpe,
which is also the case in typical realisations of ADI in tokamak experiments. However, analytical estimates of the growth rates (see Appendix and Ref. 10) are in the limit Ωce>> ωpe. Whilst this limit does not strictly hold
in our simulations, the analysis nonetheless provides an order of magnitude benchmark.
IV. TIME EVOLUTION OF PARTICLES AND FIELDS UNDER THE ANOMALOUS DOPPLER INSTABILITY
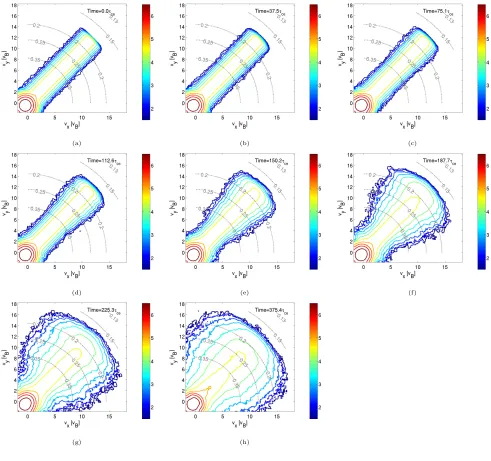
Figure 2 shows the time sequence of plots of an elec-tron distribution function evolving from pencil-like to
pancake-like under the action of the ADI. The constant-f
contours for the highest energy component of the electron population, initially extended in the direction of the par-allel velocity axis, spread rapidly in the perpendicular velocity direction. Owing to wave excitation, not all the parallel kinetic energy dissipated can be transferred to
the perpendicular component. Hence the spreading off
in (vk, v⊥) does not follow the kinetic energy conserving
path, that is indicated by contours shown in dashed lines in Fig. 2. Initially the electron tail population at higher
vkspreads out intov⊥at a higher rate than the tail
popu-lation at lowervk, which remains almost unchanged and
can be seen from panels (a)-(e) in Fig. 2. Modes for
whichvAD lies at smallervk do not arise at early linear
stages, due to Landau damping by the thermal bulk. Fig-ure 2 also shows local flattening and parallel extension of
the bulk distribution at a fewvB, which is a consequence
of Landau damping there of tail-excited waves. We note that this effect can only be captured quantitatively by self-consistent nonlinear simulations, and is beyond the reach of linear or quasilinear analysis.
(a) (b) (c)
(d) (e) (f)
[image:5.595.62.553.84.545.2](g) (h)
Figure 2. Self-consistent spreading of the high energy tail of an electron distribution undergoing ADI, orientated at 45o to
the magnetic field direction. Constant-f contour plots of the time evolution of an electron distribution withξ = 0.08 of the population in an initially flat tail in (vx, vy) phase space; velocities are in units of thermal velocity. Here Ωce/ωpe= 1.31, and
the tail model in Eqn. (6) is used, with vM/vB = 17. The colour density is in logarithmic scale with overlaying dash lines
that represent the constantv surfaces with normalised wavenumberkvB/ωpe inferred from Eqn. (3). Panels (a) to (h) show
snapshots from initial setup, through linear instability, to the nonlinear phase of the ADI: t= (a) 0.0 τce, (b) 37.5 τce, (c)
75.1 τce, (d) 112.6τce, (e) 150.2τce, (f) 187.7τce, (g) 225.3 τce and (h) 375.4τce, where τce is the electron cyclotron period,
τce = 2π/Ωce. Panels (a) to (g) are separated by equal time intervals, 37.5 τce, where the last two panels are separated by
a longer time interval, 150.1τce. This is to reflect the relatively slow evolution of the electron distribution in the later stage
of the simulation. Different phases of the ADI are identified from the electric field amplitude in Fig. 7, where the linear and nonlinear phases correspond to the exponential growth and saturation phases of the electric field amplitude respectively. The electron distributions are first binned at a resolution of ∆v ≈0.04vB and then smoothed using averaging over four nearest
kvB/ωpe
Frequency
ω
[
ωpe
] ω1
ω2
ωpe
Ωce
ωUH
−0.50 0 0.5 0.5
1 1.5 2
kvB/ωpe
Frequency
ω
[
ωpe
]
−0.50 0 0.5 0.5 1 1.5 2 −20 −15 −10 −5 A B
kvB/ωpe
Frequency
ω
[
ωpe
]
−0.50 0 0.5 0.5 1 1.5 2 −20 −15 −10 −5 A B
(a) (b) (c)
kv B/ωpe
Frequency
ω
[
ωpe
]
−0.50 0 0.5 0.5 1 1.5 2 −20 −15 −10 −5 A B C kv B/ωpe
Frequency
ω
[
ωpe
]
−0.50 0 0.5 0.5 1 1.5 2 −20 −15 −10 −5 C kv B/ωpe
Frequency
ω
[
ωpe
]
−0.50 0 0.5 0.5 1 1.5 2 −20 −15 −10 −5 C
(d) (e) (f)
kvB/ωpe
Frequency
ω
[
ωpe
]
−0.50 0 0.5 0.5 1 1.5 2 −20 −15 −10 −5 C
kvB/ωpe
Frequency
ω
[
ωpe
]
−0.50 0 0.5 0.5 1 1.5 2 −20 −15 −10 −5 (g) (h)
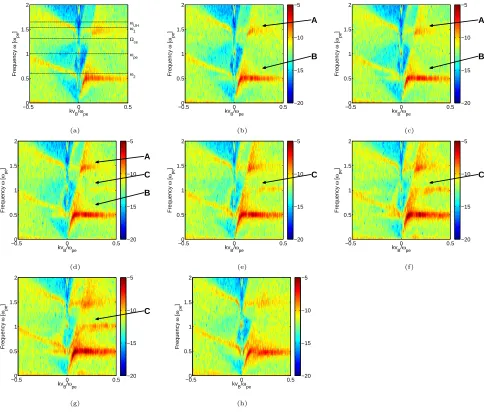
Figure 3. Time evolution of electrostatic field amplitude, plotted as a function of ω,k using a logarithmic scale, which is consistent with the electron distribution of Fig. 2. The frequency axis is normalised in units ofωpe and the wavenumber axis
is represented in units ofkvB/ωpe. Panel (a) is constructed by short-time Fourier transforming over the time interval between
panels (a) and (b) in Fig. 2, and so on successively for panels (b) to (g), while (h) corresponds to the time interval from 337.9 τce to 375.4τce. The duration of the Fourier transform time window is the same for all panels in this Figure. Panels (a) to (g)
correspond to the linear phase of the ADI, see Fig. 6, whereas (h) corresponds to the nonlinear regime. In the upper left panel, the horizontal lines show natural frequencies of the plasma: from top, upper hybrid frequency, higher frequency electrostatic normal mode, electron cyclotron frequency, electron plasma frequency, lower frequency electrostatic normal mode. A, B and C mark the dominant forward propagating modes in panels (b)-(g). The same colour scale has been adopted in each plot to assist comparison.
in time, as the ADI proceeds through its linear phase into its nonlinear phase. Panels (a) - (g) of Fig. 3 corre-spond to the linear phase of ADI, during which the inten-sity of the two forward propagating electrostatic modes, marked as A and B in panels (b)-(d), increases exponen-tially. The two backward propagating modes are
Lang-muir waves in uniform magnetised plasma, ω1 and ω2
from Eqn. (7). The characteristic frequencies of the two forward propagating modes, A and B in Fig. 3, roughly
correspond to the these Langmuir modes,ω1andω2, but
slightly adjusted by relatively large asymmetric electron tail,ξ= 0.08 in this case. An electrostatic mode appears
at approximatelyω ≈ωpe in the later stages of the
lin-ear phase, marked as C in panels (d)-(g), but vanishes in the nonlinear phase as shown in panel (h). The
physi-cal origin of the feature atω ≈ωpe in panels (d) to (g)
[image:6.595.64.551.53.468.2]velocity distribution is always montonically decreasing
with respect to vk and there is no evidence for particle
trapping. This spectral feature of our simulations may correspond to the observations of fluctuating narrowband
emission atωpe from low density tokamak plasmas with
extended suprathermal electron tails; see, for example, Refs. 22–26.
This feature may represent a generalisation, previously unobserved in simulations to our knowledge, of a wave-wave resonant form of the anomalous Doppler instability: we note that this class of instability has been suggested26
as an explanation for the observations22–25of fluctuating
narrowband emission at ωpe from tokamaks. Analytical
theory in this area rests on a simple cold beam plasma
model3,8,26, in which the beam travels relative to the
bulk plasma at velocityv0 parallel to the magnetic field.
This differs from the more realistic but less analytically tractable case, considered in the present simulations, of an extended monotonically decreasing suprathermal tail and a thermal bulk population. At present we can only offer a general plausibility argument for the wave-wave resonant hypothesis, in terms of the simple dispersion re-lation defined by Eqn. (5) of Ref. 8. Resonance between
the bulk-supported wave at ω ≈ ω2, in the notation of
our Eqn. (7), and a negative energy wave supported by the beam atω≈kkv0−Ωce, requires3,8
ω2=kkv0−Ωce. (9)
It is not known how this simple model carries over to the case of an extended monotonically decreasing suprathermal tail combined with a thermal bulk popu-lation. In particular, the spectrum of additional natural wave modes arising from the presence of the suprather-mal electrons is unknown. Figure 3 gives
characteris-tic parameter values for the spectral feature at ωpe of
kvB/ωpe ≈0.3 with kk/k = 1/
√
2 and Ωce/ωpe = 1.31.
Using these values in the resonance condition Eqn. (9) to infer an effective characteristic velocityv0,ef f for the
tail population yieldsv0,ef f ≃9.0vB. This value is close
to the mean parallel electron velocity of the tail popula-tion in the distribupopula-tions plotted in Fig. 2, from which we infer that wave-wave anomalous Doppler instability may be possible in our simulations.
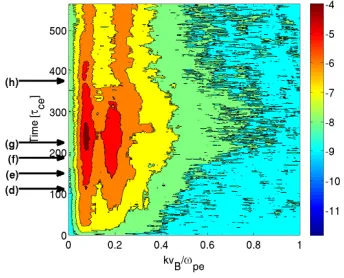
The temporal evolution of|E(k)|for different modes is
shown in Fig. 4 and Fig. 5. Figure 4 shows that, byt∼
200τce, there are two strong enhancements of field energy
in (k, t) space, atkvB/ωpe= 0.07±0.02 andkvB/ωpe=
0.18±0.04, marked in Fig. 5 as A and B respectively.
The first corresponds to the streaming instability with a parallel phase velocity equivalent to the mean velocity of the electron tail. Using the spatial domain orientation,
here tanθ = 1, and the respective wavenumber k and
wave angular frequency ωk = ω2 in Eqn. (3), we find
that the second enhancement corresponds to a parallel
phase velocityvADwhose magnitude is comparable to the
[image:7.595.353.525.55.194.2]maximum tail velocityvM = 17vB. The first two panels
Figure 4. Growth of dominant modes in k-space. Contour plot showing the temporal evolution of the dominant electro-static component of electric field amplitude in (k, t) space, identified from Fig. 3, in logarithmic scale. (d)-(h) label the corresponding times of panels (d)-(h) in Fig. 2. The signal |E(k, t)| is smoothed by averaging over four nearest neigh-bours.
kv
th/ωpe Time [τce]
0 0.2 0.4 0.6 0.8 1 440
460 480 500 520 540 560
kv
th/ωpe Time [τce]
0 0.2 0.4 0.6 0.8 1 20
40 60 80 100 120 140
(b) (c) (d)
kv
th/ωpe Time [τce]
0 0.2 0.4 0.6 0.8 1 300
320 340 360 380 400 420
(h)
A B
kv
th/ωpe Time [τce]
0 0.2 0.4 0.6 0.8 1 160
180 200 220 240 260 280
(e) (f) (g)
A
B
Figure 5. Four panels showing different time sections of the unsmoothed |E(k, t)|, from top right to top left (clockwise) showing time intervalst= 0−140τce,140−280τce,280−420τce
and 420−560τce. The two dominant modes are marked as A
and B. (b)-(h) label the corresponding times of panels (b)-(h) in Fig. 2.
in Fig. 5 show the linear phase of ADI, whereas the later two show the development of the nonlinear phase.
The early time evolution of the field amplitude,
com-puted from simulations using different percentage ξ of
energetic electrons, yields linear growth rates whose
de-pendence onkis shown in Fig. 6. To infer linear growth
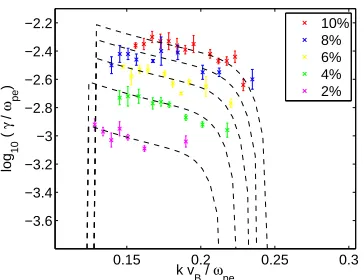
rates from these PIC simulations, we first identify the linear phase and then evaluate the growth rates via least squares fitting. The resulting empirical scaling of linear
growth rate withξis compared in the figure to the
[image:7.595.335.567.309.488.2]0.15 0.2 0.25 0.3 −3.6
−3.4 −3.2 −3 −2.8 −2.6 −2.4 −2.2
k vB / ωpe
log
10
(
γ
/
ωpe
)
[image:8.595.79.261.59.199.2]10% 8% 6% 4% 2%
Figure 6. Comparison between analytical expressions and the growth rates inferred from PIC simulations in their linear regime for flat tails with concentrationsξ of 2% (pink), 4% (green), 6% (yellow), 8% (blue) and 10% (red). The dashed lines represent the corresponding linear analytical growth rates computed using Eqns. (A.3)-(A.7). Parameters other thanξ are the same for all simulations: an initially flat tail withvM = 5.0×10⁷ms−1,Ωce/ωpe= 1.31.
0 200 400 600 800 1000
−14 −13.5 −13 −12.5 −12 −11.5 −11
Time [2π/ω
ce]
log(|E|) [a.u.]
[image:8.595.341.539.61.200.2]10% 8% 6% 4% 2%
Figure 7. Temporal evolution of electric field amplitude |Ek(t)|of a specific wave-number modekvB/ωpe = 0.20, for
different flat tail concentrationsξspanning 2% to 10%. The traces of|Ek(t)|are shifted in time such that|Ek(t)|for
dif-ferent tail concentrations starts at the same time zero.
Eqns. (A.3)-(A.7) to each initialf. As shown in Fig. 6,
the simulation linear growth rates agree with the
analyt-ical expressions, and follow a decreasing trend withkas
Landau damping becomes more significant askincreases.
Figure 7 shows the temporal development of a particular
kmode for different energetic electron concentrationsξin
the range 0.02 to 0.1 with other parameters unchanged. The electric field amplitude grows and relaxes at a faster
rate for higherξ. We have also calculated linear growth
rates from PIC simulations with different alignments of the spatial domain with respect to the magnetic field and hence differentkk/k⊥, tanθ= 0.5,1,3, as shown in Fig.
8. Varying the ratio of Ωce toωpehas a similar effect to
changing the (k⊥, kk) alignment, as the cosθ term
im-0.1 0.2 0.3 0.4
−3.6 −3.4 −3.2 −3 −2.8 −2.6 −2.4 −2.2
k vB / ωpe
log
10
(
γ
/
ω pe
)
tan θ = 0.5 tan θ = 1 tan θ = 3
Figure 8. Dependence of linear-stage growth rate on mode propagation angle with respect to the magnetic field. Coloured points denote linear growth rates of the most strongly growingk-modes inferred from PIC simulations for Ωce/ωpe = 1.31. A flat tail with ξ = 0.1 and vM ≈ 17vB
is used. Dashed lines show analytical linear growth rates for this model, calculated from Eqns. (A.3)-(A.7).
0 100 200 300 400 500 −1
0 1 2 3 4 5 6 7x 10
11
Time τ [τ ce]
ε
(
τ
) [eV]
[image:8.595.349.532.312.466.2] [image:8.595.79.274.315.466.2]ε
||,bulk
ε⊥,bulk
Figure 9. History ofǫk(blue) andǫ⊥(black) for bulk electron
population, computed by following the trajectories of all the bulk electrons throughout the simulation for a flat tail distri-bution withξ= 0.06, Ωce/ωpe= 1.31 andvM ≈17vB. Both
components ofj·Eare positive throughout the simulation.
plicit in Eqn. (3) effectively modifies the magnitude of
Ωcein the resonance condition which definesvAD. While
the condition Ωce>> ωpe may simplify the problem
an-alytically, the present numerical simulations reveal the existence of instability in cases where Ωce < ωpe. Thus
Ωce> ωpeis not a necessary condition for the ADI to
oc-cur, and the evolution of the electron distribution broadly resembles that of the ADI in Fig. 2.
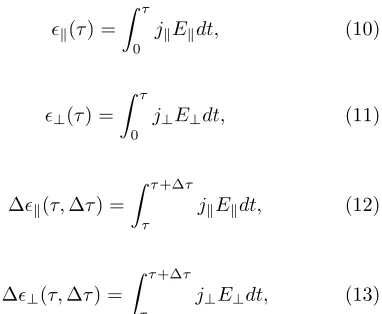
To quantify the energy transfer between the parallel
and perpendicular direction, we evaluateR
jk·Ekdtand R
j⊥·E⊥dtby following the trajectories of the bulk and
tail electrons fromt= 0 up to different timesτ as shown
0 100 200 300 400 500 −2
−1 0 1x 10
12
Time τ [τce]
ε
(
τ
) [eV]
ε||(τ)
ε⊥(τ)
0 100 200 300 400 500
0 0.1 0.2 0.3 0.4 0.5
ε⊥
(
τ
)/
ε||
(
τ
)
Time τ [τce]
ωpe / (Ωce+ωpe)
0 50 100 150 200 250 300
−6 −4 −2 0 2x 10
10
Time τ [τce]
∆ε
(
τ
)[eV]
∆ε||(τ)
∆ε⊥(τ)
0 50 100 150 200 250 300
0 0.5 1 1.5 2
∆
ε⊥
(
τ
) /
∆
ε||
(
τ
)
Time τ [τce]
ωpe / (Ωce+ωpe)
[image:9.595.83.540.63.268.2](a) (b)
Figure 10. Energy flow in the perpendicular and parallel directions, over time. (a) Top panel shows the history ofǫk(τ) (red)
and ǫ⊥(τ) (green) computed by following the trajectories of all the tail electrons throughout the simulation. Bottom panel
plots the ratio|ǫ⊥(τ)/ǫk(τ)|, the horizontal line marks the value ωpe/(Ωce+ωpe). (b) Top panel shows ∆ǫk(τ,∆τ) (red) and
∆ǫ⊥(τ,∆τ) (green) at different times, where ∆τ is the time interval between data dumps which in this case is 3.78τce. Bottom
panel shows the ratio|∆ǫ⊥/∆ǫk|at each data dump, the horizontal line marks the valueωpe/(Ωce+ωpe). An initially flat tail
distribution withξ= 0.06, Ωce/ωpe= 1.31 andvM ≈17vB is used.
ǫk(τ) = Z τ
0
jkEkdt, (10)
ǫ⊥(τ) = Z τ
0
j⊥E⊥dt, (11)
∆ǫk(τ,∆τ) =
Z τ+∆τ
τ
jkEkdt, (12)
∆ǫ⊥(τ,∆τ) = Z τ+∆τ
τ
j⊥E⊥dt, (13)
where ∆τ is the time interval between data dumps.
The current density j here refers to the first order
mo-ment of the electron distribution function. In particular the parallel and perpendicular components of the cur-rent density of the tail electron population are given by
jk,tail = R∞
0 vkF(vk)dvk and j⊥,tail = R∞
0 v⊥F(v⊥)dv⊥ which are evaluated using finite sampling in the velocity phase space of the PIC simulations. For the tail elec-trons,ǫk(τ) is negative in the rest frame of the simulation
throughout the simulation, with the most rapid change during the linear phase of the ADI as shown in Fig. 10(b), while ǫ⊥(τ) increases. Meanwhile bothǫk(τ) and ǫ⊥(τ)
are positive for the bulk electrons and increase through-out the simulation, as shown in Fig. 9. The ratio ofǫ⊥(τ)
toǫk(τ) for tail electrons is also calculated and shown in
the bottom panels of Figs. 10(a) and (b) for both the ag-gregate sums and snapshot values. The ratio approaches a steady value ofωpe/(ωpe+ Ωce) during the linear phase
of the ADI, hence a constant proportion of parallel energy is transferred to the perpendicular direction during the
linear phase. Previous analytical work10,12 suggests that
this ratio between the energy transfer is Ωce/(ωpe+ Ωce)
in the linear regime of the ADI if the damping terms are neglected. In the present simulations, additional fac-tors, notably damping and nonlinear evolution are fully included. As we have shown, these can become impor-tant as electrons evolve away from the magnetic field di-rection, and this results in values for|ǫ⊥(τ)/ǫk(τ)| that
differ significantly from the linear value. Figure 11 ad-dresses the dependence of ADI phenomenology on the
value of the ratio Ωce/ωpe. It shows the time evolution
ofǫk(τ) and ǫ⊥(τ) in four cases. The magnitude of
en-ergy transfer is found to be smaller for larger Ωce/ωpe,
because fewer electrons satisfy the resonance condition, Eqn. (3).
[image:9.595.109.300.396.553.2]spreading out in the high velocity region of(v⊥, vk) phase
space is no longer observed. The electron number
den-sity at high velocity parallel toB declines exponentially
in such configurations, leading to a much slower growth rate.
V. CONCLUSIONS
The anomalous Doppler instability has enduring experimental relevance to magnetically confined
fu-sion plasmas5,8,11,14, and to laboratory beam-plasma
studies17,18,27. Hitherto theoretical interpretation has
rested on linear instability analysis and quasilinear ap-proaches. Recent advances in computing resources have now placed the ADI within the scope of contemporary first principles fully self-consistent kinetic simulation. We have performed, for the first time, fully kinetic self-consistent PIC simulations of the ADI for both flat and monotonically decreasing electron tails which capture both linear and nonlinear phases of the ADI. We have performed a systematic comparison between new PIC results and prior analytical theory, and we have estab-lished quantitative agreements between the two, span-ning the kinetic evolution of the electron distribution and the properties of the self-consistently excited wave fields. We have captured physics beyond the linear phase of the ADI. Specifically, we have: observed the evolution of the thermal bulk population of electrons in response to waves excited by the ADI, which is beyond the reach of analytical theory; followed the ADI through the lin-ear phase to steady state; and obtained the directional
components of the j·E energy flow for both bulk and
tail electron populations, with damping and nonlinear
0 100 200 300 400 500 600
−5 −4 −3 −2 −1 0 1 2x 10
12
Time [τ
ce]
ε
(
τ
) [eV]
[image:10.595.87.266.475.623.2]0.83 0.97 1.31 1.93
Figure 11. Time evolution of perpendicular and parallel com-ponents of j·E of the tail electrons, for different values of Ωce/ωpe. The history ofǫk(τ) (solid lines) andǫ⊥(τ) (dotted
lines) is computed by following the trajectories of all the tail electrons throughout the simulation for a flat tail distribution withξ= 0.08, for four different Ωce/ωperatios: 0.83(yellow),
0.97(red), 1.31(blue) and 1.93(green).
effects included. The perpendicular and parallel
compo-nents of thej·E energy flow of tail electrons have been
computed for different Ωce/ωperatios and, interestingly,
we find that the ADI can arise beyond the previously ex-pected parameter range, in particular where Ωce< ωpe.
The simulations also exhibit a spectral feature which may correspond to observations of suprathermal narrowband
emission atωpedetected from low density tokamak
plas-mas. Our model results suggest that this may be compat-ible with an explanation in terms of wave-wave resonant anomalous Doppler instability.
It is clear from the present work that the ADI joins other key collective effects involving energetic electrons
in tokamak plasmas, such as alpha channelling16, in
ben-efitting from PIC simulations. There is a firm basis for integrating the ADI approach presented here into more comprehensive models of energetic electron phenomenol-ogy in magnetically confined fusion and laboratory plas-mas. Predicting the role of energetic electron populations in ITER has been a focus of experimental and theoretical work since the mid-1990s28,29, and remains topical30.
(a) (b)
[image:11.595.163.488.51.362.2](c) (d)
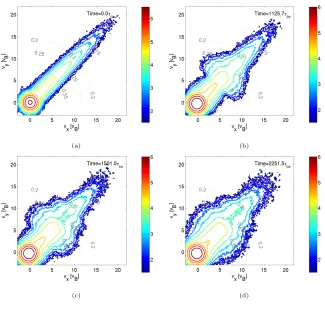
Figure 12. Snapshots of constant-f contours of an initially monotonically decreasing electron tail distribution, modelled by a shifted Maxwellian withξ= 0.08, vT ≈9vB, vD= 0.66vB and Ωce/ωpe= 1.31 at different times, (a) 0τce, (b) 1125.7τce, (c)
1501.0τce and (d) 2251.5τce, for a 8% monotonically decreasing tail. Dashed lines represent constant wavenumbervcontours
with normalised wavenumberkvB/ωpe inferred from Eqn. (3).
Appendix A: Appendix
The analytical linear growth rate of electrostatic waves
generated by the ADI is obtained10from the full
electro-static dielectric response function given by31
ǫ= 1−ωkpe2
∞ X
n=−∞
Z ∞
vk=−∞
Z ∞
v⊥=0
2πv⊥dv⊥dvk nΩce+kkvk−ω
nΩce
v⊥ ∂f ∂v⊥
+kk ∂f ∂vk
Jn2
k⊥v⊥
Ωce
−ω
2 pi
k
Z ∞
vi=−∞
dvi
kvi−ω
dfi
dvi
. (A.1)
Here (vk, v⊥) denote the velocities parallel and
perpen-dicular to the magnetic field B; f(vk, v⊥) is the
elec-tron distribution function and fi(vi) that of the ions;
Ωce and ωpe are the electron cyclotron and plasma
fre-quency respectively; and (kk, k⊥) denote the wavenumber
components parallel and perpendicular to the magnetic field. A spatially uniform equilibrium plasma is assumed.
Following10, we decompose the electron velocity
distribu-tion into a majority thermal Maxwellian bulk and a much smaller (fractionξ <<1) suprathermal tail distribution
f(v⊥, vk) =
1−ξ
π3/2v3 B
e−v⊥2/v2Be−v2k/vB2 + ξ
πv2 T⊥
e−v2⊥/v2T⊥F(v
k), (A.2)
where vB represents the thermal velocity of the
Maxwellian bulk electrons andvT⊥ is the perpendicular
thermal velocity which is the same as vB in our
simu-lation setup. To simplify, we consider Ωce >> ωpe, in
which case the lower electrostatic mode ω2 dominates
and can be approximated as ωpekk/k. The growth rate
of the mode at ω1 is less than that at ω2 by a factor
Ωce/ωpe32, hence we shall focus on the growth rate of the
lower mode with real frequencyω2 = ωpekk/k.
Substi-tuting the above expression into the electrostatic dielec-tric response function yields the contributions to linear growth and damping given by Eqns. (A.3) to (A.7) of Ref. 10, reproduced here for convenience:
γ ωpe =
γAD
ωpe −
γ
LB
ωpe +
γLT
ωpe +
γLI ωpe , (A.3) γAD ωpe
=ξπ1/2
ω
pe
kvB 2
Γ1(βT) "
Ωce
kvB
v
B
vT⊥ 2
π1/2vBF(vk) + kk
k π1/2v2
B
2
dF dvk
#
vk=vAD
, (A.4)
γLB
ωpe
= (1−ξ)π1/2
ω
pe
kvB 3
Γ0(βB)
kk ke
−(kvBωpe)2
, (A.5)
γLT
ωpe
=ξπ1/2
ω
pe
kvB 2
Γ0(βT)
kk k
−π
1/2v2 B
2
dF dvk
vk=ωpe/k
, (A.6)
γLI
ωpe
=π1/2
ω pe kvB 3 Z m i me
1/2k k k
2
e−(kvBωpe)2mime(
kk
k)2. (A.7)
Here Γn(x) = e−xIn(x), where In denotes the modified
Bessel function of order n, Z is the ion charge state,
βB = k2⊥vB2/2Ω2ce and βT = (vT2⊥/vB2)βB. Equation
(A.7) describes Landau damping on a thermal ion pop-ulation with characteristic temperature equal to that of the bulk electrons.
REFERENCES
1V. L. Ginzburg, Soviet Physics Uspekhi2, 874 (1960).
2V. L. Ginzburg, Soviet Physics JETP35, 92 (1972).
3M. V. Nezlin, Soviet Physics Uspekhi19, 946 (1976).
4V. V. Parail and O. P. Pogutse, Soviet Journal of Plasma Physics
2, 126 (1976).
5K. Molvig, M. S. Tekula, and A. Bers, Physical Review Letters
38, 1404 (1977).
6V. V. Parail and O. P. Pogutse, Nuclear Fusion18, 303 (1978).
7H. Knoepfel and D. A. Spong, Nuclear Fusion19, 785 (1979).
8S. C. Liu, V. S. Chan, D. K. Bhadra, and R. W. Harvey, Physical
Review Letters48, 1479 (1982).
9R. O. Dendy and C. N. Lashmore-Davies, Plasma Physics26,
1347 (1984).
10R. O. Dendy, C. N. LashmoreDavies, and A. Montes, Physics of
Fluids29, 4040 (1986).
11S. C. Luckhardt, K.-I. Chen, M. J. Mayberry, M. Porkolab,
Y. Terumichi, G. Bekefi, F. S. McDermott, and R. Rohatgi,
Physics of Fluids29, 1985 (1986).
12R. O. Dendy, Physics of Fluids30, 2438 (1987).
13T. Fulop, G. Pokol, P. Helander, and M. Lisak, Physics of
Plas-mas13, 062506 (2006).
14S. Sajjad, X. Gao, B. Ling, S. H. Bhatti, and T. Ang, Physics of
Plasmas17, 042504 (2010).
15Y. M. Wang, X. Gao, L. Ling, Y. Liu, S. B. Zhang, X. Han,
A. Ti, E. Z. Li, and HT-7 Team, Physics of Plasmas19, 032509
(2012).
16J. W. S. Cook, S. C. Chapman, and R. O. Dendy, Physical
Review Letters105, 255003 (2010).
17K. Ronald, S. L. McConville, D. C. Speirs, A. D. R. Phelps,
C. W. Robertson, C. G. Whyte, W. He, K. M. Gillespie, A. W.
Cross, and R. Bingham, Physics of Plasmas15, 056503 (2008).
18K. Ronald, S. L. McConville, D. C. Speirs, A. D. R. Phelps,
C. W. Robertson, C. G. Whyte, W. He, K. M. Gillespie, A. W. Cross, and R. Bingham, Plasma Sources Science and Technology
17, 035011 (2008).
19R. Bingham, R. A. Cairns, I. Vorgul, and V. D. Shapiro, Journal
of Plasma Physics76, 539 (2010).
20R. O. Dendy, Plasma Physics and Controlled Fusion33, 1069
21A. B. Mikhailovskii, Theory of Plasma Instabilities, Vol 1:
In-stabilities of a Homogeneous Plasma, Springer, 1974.
22A. E. Costley and T. Group, Physical Review Letters38, 1477
(1977).
23I. H. Hutchinson and S. E. Kissel, Physics of Fluids23, 1698
(1980).
24R. F. Gandy and D. H. Yates, Physics of Fluids28, 1877 (1985).
25R. F. Gandy, I. H. Hutchinson, and D. H. Yates, Physical Review
Letters54, 800 (1985).
26R. O. Dendy, C. N. Lashmore-Davies, and M. M. Shoucri,
Nu-clear Fusion25, 721 (1985).
27R. Bryson, I. Vorgul, R. A. Carins, D. C. Speirs,
M. King, K. Ronald, A. D. R. Phelps, R. Bingham,
S. L. McConville, K. M. Gillespie, and A. W. Cross,
Proc. 2012 EPS Conference on Plasma Physics P1.158,
http://ocs.ciemat.es/epsicpp2012pap/pdf/P1.158.pdf.
28R. Jaspers, N. J. Lopes Cardozo, F. C. Schuller, K. H. Finken,
T. Grewe, and G. Mank, Nuclear Fusion36, 367 (1996).
29S. Putvinski, P. Barabaschi, N. Fujisawa, N. Putvinskaya, M. N.
Rosenbluth, and J. Wesley, Plasma Physics and Controlled
Fu-sion39, B157 (1997).
30K. O. Aleynikova, P. B. Aleynikov, S. V.
Kono-valov, A. A. Teplukhina, and V. E. Zhogolev, Proc.
2013 EPS Conference on Plasma Physics O5.103,
http://ocs.ciemat.es/EPS2013PAP/pdf/O5.103.pdf.
31N. A. Krall and A. W. Trivelpiece,Principles of Plasma Physics,
San Francisco Press, 1986.
32A. I. Akhiezer, I. A. Akhiezer, R. V. Polovin, A. G. Sitenko, and
K. N. Stepanov, Plasma Electrodynamics, Vol. 2: Non-linear