AI-Enabled Automation
A Framework for Identifying a Company’s Automatable
Core Processes
Master Thesis Report for Obtaining the Degrees:
M.Sc. Business Administration – Entrepreneurship, Innovation and Strategy
University of Twente. – Faculty of Behavioural Management and Social Sciences
&
M.Sc. Innovation Management, Entrepreneurship & Sustainability
Technische Universität Berlin – Fakultät Wirtschaft und Management
Master Student: André Hubert
Student Numbers: S2123622 (UT) 392946 (TUB)
Examination Committee:
Dr. Robin Effing University of Twente
Dr. Ton Spil University of Twente
Prof. Dr. Dodo zu Knyphausen-Aufseß Technische Universität Berlin
Abstract
Driven by advances in artificial intelligence (AI), the potential for process automation is increasing. AI-enabled automation allows to substitute for human labor in a widening range of tasks and provides substantial opportunities for profit growth. The goal of this research is to develop an analytical framework for the identification of business pro-cesses that are most beneficial for AI-enabled automation. The framework’s underlying automatability-competence-matrix considers two variables to categorize business pro-cesses: (1) the extent to which a process is a core process and (2) its automatability. For each category, a distinct automation strategy is recommended. The proposed analytical framework is developed through an iterative design science research approach and is comprised of a core competence analysis and an automatability assessment. The core competence analysis builds on related literature, while the automatability assessment is a novel approach. To assess a process`s potential to be automated, the automatability assessment utilizes a dataset that provides information about the automatability of skills, knowledge, and abilities. Four simulations and three expert interviews were conducted to evaluate the design. While the core competence analysis was found to be capable of correctly evaluating processes, the automatability assessment revealed certain limita-tions. Such limitations were, e.g., subjective process ratings during the simulations or the inability to assess high-level processes. In the end, the core competence analysis and automatability assessment require different process levels to function correctly. It is suggested that future research consecutively examines a company’s core competences on a high level, and then assesses the automatability of underlying processes on a lower level. This thesis contributes to theory and practice through the development of the au-tomatability-competence-matrix, the design of a novel approach for estimating process automatability, and proposing an approach for identifying processes that are most bene-ficial for AI-enabled automation.
List of Contents
List of Figures ... V
List of Tables ... V
List of Abbreviations ... V
1 Introduction ... 1
1.1 Situation and Research Goal ... 1
1.2 UNITY AG ... 2
1.3 Thesis Report Structure ... 2
2 Theoretical Background ... 4
2.1 Literature Search Strategy ... 4
2.2 Resource-based Theory, Sustained Competitive Advantage, and Core Competences ... 6
2.3 Artificial Intelligence ... 8
2.4 AI-Enabled Automation ... 8
2.5 Limitations of AI-Enabled Automation ... 9
2.6 Business Processes ... 11
2.7 Automation Technology Initiatives Selection ... 12
2.8 Theoretical Framework ... 12
3 Method ... 16
3.1 Design Science Research ... 16
3.2 Research Model ... 17
4 Results ... 19
4.1 Theoretical Framework Evaluation ... 19
4.2 Analytical Framework Design ... 20
4.3 Analytical Framework Simulation ... 27
5 Analysis ... 30
5.1 Core Competence Analysis ... 30
5.2 Automatability Assessment ... 30
5.3 Overall Analytical Framework Evaluation ... 33
5.4 Analytical Framework Redesign Options ... 33
6 Discussion and Conclusion ... 35
6.1 Main Findings ... 35
6.2 Contribution to Literature and Theory ... 37
6.3 Contribution to Practice ... 37
6.4 Limitations of the Research ... 38
List of References ... iv
Appendix ... viii
List of Figures
Figure 1 Publication Histogram: "Job" AND "Automation" AND "Artificial
Intelligence" ... 5
Figure 2 Technology/Process Ranking ... 12
Figure 3 Automatability Competence Matrix (ACM) ... 14
Figure 4 ACM Example: Insurance Company ... 15
Figure 5 Design Science Research Cycles ... 16
Figure 6 Research Model Overview ... 17
Figure 7 Process Request Worksheet ... 21
Figure 8 Extract from Core Competence Analysis Worksheet ... 22
Figure 9 Extract from Automatability Assessment Worksheet ... 24
Figure 10 ACM Score Calculation ... 26
Figure 11 Simulation Results - ACM Matrices ... 28
Figure 12 Automatability Assessment Results ... 31
Figure 13 Updated Automatability Competence Matrix ... 36
List of Tables
Table 1 Key Articles Strategic Relevance ... 4Table 2 Key Word Literature Search Results ... 5
Table 3 ACM Strategic Implications Expert Opinion ... 19
Table 5 Validation ACM Scores ... 26
Table 6 Simulations Company Overview ... 27
Table 7 Process Type Examples ... xv
List of Abbreviations
AI Artificial Intelligence
ACM Automatability Competence Matrix
DAX Deutscher Aktien Index (German Stock Index) DSR Design Science Research
1
Introduction
1.1 Situation and Research Goal
Exponential growth in computing power (also known as Moore’s Law) and big data technologies have empowered the spread of “artificial intelligence” (AI) during the last years (Duan, Edwards, & Dwivedi, 2019). It has an ever-increasing impact on every-one’s daily life and the business landscape (Brynjolfsson & McAfee, 2012). Driverless cars, automated online assistants, and voice recognition are only examples where AI is beginning to substitute for human labor (Bruun & Duka, 2018). For a long time, auto-mation was only possible for manual and routine tasks, but AI enables the autoauto-mation of formerly non-computerizable tasks (Autor, 2015; Bruun et al., 2018; Frey & Osborne, 2017).
In academia and politics “technological unemployment” is widely discussed (Acemoglu & Restrepo, 2017; Autor, 2015; Frey et al., 2017; Jarrahi, 2018). Also, business manag-ers face market disruptions enabled by AI, for example, in the realm of AI-enabled deci-sion making or by utilizing data for market predictions (Duan et al., 2019).
A McKinsey Global Institute study revealed that in 2017, 95% of all companies did not embrace AI yet, even though it promises to be a profit uplift of up to 10% of revenue (Bughin, 2018). Therefore, Jacques Bughin concludes that “wait-and-see could be a costly AI strategy” (2018). In an annual survey, which was conducted by MIT Sloan Management Review, scholars found that many companies invest in AI or start AI pilot projects to develop new sources of business value (Ransbotham, Gerbert, Reeves et al., 2018). In fact, AI-enabled automation enhances performance, outcome, and quality, it helps overcome human limits and leads to faster innovation and business transformation (Manyika, 2017).
Even though managers are compelled to automate their business processes with intelli-gent machines and algorithms, it is difficult to decide where to start (Bughin, Chui, & McCarthy, 2017). Many factors from technological, strategic, social, and economic per-spectives influence the decision. As resources are limited, corporate strategists, consult-ants, and CEOs need to decide where an investment in business automation is the most promising. With AI enabling a high paced progress in all kinds of automation technolo-gies, there is a lack of a convenient and high-level framework for analyzing business processes.
required to combine insights from technical developments in the field of AI-enabled automation with the discipline of strategic management. Within the framework, busi-ness processes will be classified according to their suitability for automation, on the one hand, and their strategic relevance, on the other hand. Ultimately, an automation strate-gy will be defined for each process category. This results in the following research question with four sub-questions:
Q: How to design an analytical framework for identifying business processes that are most beneficial for AI-enabled automation?
• Q1: What is AI-enabled automation?
• Q2: What are the current capabilities and limitations of AI-enabled auto-mation?
• Q3: What theoretical framework might be used to classify business process-es and recommend an AI-enabled automation strategy?
• Q4: Which components define an analytical framework for the identifica-tion of business processes that are most beneficial for AI-enabled automa-tion?
1.2 UNITY AG
The master thesis research was conducted in cooperation with UNITY AG, a manage-ment consultancy for innovation and digital transformation. With its headquarter in Büren, Germany and over 250 employees worldwide, UNITY consults both SMEs, DAX-30 and EURO-STOXX-50 companies in topics such as future business, future production, future development, and new work.
As AI and business automation receive rising interest within all industries, UNITY en-larges its range of services within this field and actively promotes research. For that reason, UNITY supported the study by providing a company supervisor as well as ac-cess to its knowledge base, experts, and partner network.
1.3 Thesis Report Structure
2
Theoretical Background
The theoretical foundations are structured as follows: at first, the literature search strat-egy is explained, which is followed by essential aspects of strategic management, name-ly resource-based view, sustained competitive advantage, and core competences. After-ward, AI, AI-enabled automation, and its limitations will be portrayed. Additionally, business processes and an approach to automation technology initiatives selection are shortly summarized. In the end, each distinct theory results in the overall theoretical framework, which constitutes the fundamental framework for the following research.
2.1 Literature Search Strategy
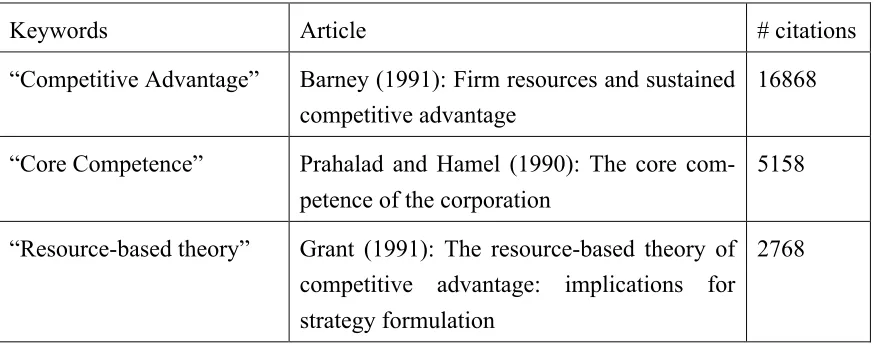
[image:9.595.95.534.414.586.2]The literature search was primarily conducted by utilizing Scopus and Google Scholar. The two major fields of interest, strategic relevance and AI-enabled automation, have been analyzed separately. The idea of the resource-based theory and its derivatives emerged already in the early 1990s, which is why a vast amount of literature is available (a Scopus search for “resource-based view” renders 36,360 results). Therefore, it was primarily focused on foundational and often cited literature.
Table 1 Key Articles Strategic Relevance
Keywords Article # citations
“Competitive Advantage” Barney (1991): Firm resources and sustained competitive advantage
16868
“Core Competence” Prahalad and Hamel (1990): The core com-petence of the corporation
5158
“Resource-based theory” Grant (1991): The resource-based theory of competitive advantage: implications for strategy formulation
2768
and abstracts. In the end, original and recurringly cited articles build the basis for the theory on AI-enabled automation.
Figure 1 Publication Histogram: "Job" AND "Automation" AND "Artificial Intelligence", source: Scopus
Table 2 Key Word Literature Search Results
Keywords # articles 2017-2019 Business or
Economics
“Job” AND “Automation” 32,461 9,219 1,611
"Job" AND "Automation" AND "Arti-ficial Intelligence"
183 92 23
“Business” AND “Automation” AND “Artificial Intelligence”
33,740 11,507 1,352
"Job" AND "Computerization" 2,864 1,109 463 For further specific aspects, the following search terms have been utilized:
• “Task” AND “Automatability”
• “Identification” AND “Core Competence”
• “Core Competence” AND “Firm Performance”
[image:10.595.92.532.428.609.2]2.2 Resource-based Theory, Sustained Competitive
Advantage, and Core Competences
For choosing the most valuable business processes for automation, it can be drawn on research in the field of strategic management, because it provides many frameworks and approaches for analyzing a firm. Especially the research on competitive advantage can be utilized for identifying a company’s value driver. According to Peteraf and Barney (2003), a company has a competitive advantage when it can create higher economic value. The decision, which business automation initiatives should be started, can be facilitated once it is understood where the value of a company originates.
Generally, there are two approaches to understanding a firm’s competitive advantage (Barney, 1991). The first one is the external analysis of opportunities and threats of a firm through environmental models of competitive advantage. During the 1980s, the strategy was mainly the result of an extensive review of the external environment of a firm, for example, through Porter’s five forces and competitive positioning (Barney, 1991; Grant, 1991; Porter, 2008). The second approach follows the resource-based view and is the internal analysis of a firm’s strengths and weaknesses. Since the 1990s, there was increasing interest in the link between firm resources, skills, and the firm’s strategy (Grant, 1991). Until today, resource-based view is a dominant theoretical approach in management research (Nason & Wiklund, 2018).
In the background of finding the firm’s most valuable business automation initiatives, the theory will be limited to the internal analysis of a firm, and the external analysis will be excluded. Therefore, the main focus will lie on foundational contributions by Grant’s resource-based theory of competitive advantage (1991), Prahalad and Hamel’s core competences (1990), and Barney’s sustained competitive advantage (1991).
2.2.1 Grant’s Resource-based Approach to Strategy Analysis
capabilities by Grant is closely linked to the core competence model by Prahalad and Hamel (1990).
2.2.2 Barney’s Firm Resources as a Source of a Sustained Competitive Advantage
As well as Grant, Jan Barney (1991) builds on the resource-based view for developing criteria for sustained competitive advantage. According to Barney (1995), “resources and capabilities include financial, physical, human and organizational assets that a com-pany uses to develop, manufacture and deliver products and services to its customers.” He argues that due to the heterogeneity of the firms and their resources within an indus-try, a firm can have a sustainable competitive advantage. In contrast to a competitive advantage derived from a value-creating strategy, a sustained competitive advantage is defined through the impossibility of other firms to duplicate the competitive advantage. Assuming the heterogeneity and immobility of resources, Barney developed four attrib-utes (VRIN) that resources need to have as a source for sustained competitive ad-vantage. In fact, during a meta-analysis, Crook, Ketchen Jr, Combs et al. (2008) found a significant correlation (r=.29) between VRIN resources and firm performance.
Firstly, resources need to be valuable (V). Valuable resources help to conceive or im-plement strategies that improve the firm’s efficiency and effectiveness. Secondly, to be a source for a sustained competitive advantage, a firm’s bundle of resources needs to be rare (R) among the competition. Otherwise, many competitors may find it easy to im-plement the same strategy. The third attribute is imperfect imitability (I) and reflects the unattainability of these specific valuable and rare resources by other firms. If other firms cannot reach these resources, they cannot imitate the strategy. The last attribute is non-substitutability (N), which refers to resources that cannot be replaced by other not rare or imitable resources. When a resource can be substituted by other resources, which themselves cannot be a source for a sustained competitive advantage, then the resource cannot be a source for a sustained competitive advantage as well (Barney, 1991).
2.2.3 Prahalad and Hamel’s Core Competences
Core competences especially find application in the process of strategic outsourcing, where firms increasingly concentrate on their core competence and pass on non-core competences to other firms (Boguslauskas & Kvedaraviciene, 2009; Quinn & Hilmer, 1994). Frameworks for the identification of core competences are, for example, devel-oped by Hafeez, Zhang, and Malak (2002) or Boguslauskas et al. (2009).
2.3 Artificial Intelligence
Kaplan and Haenlein define AI as “a system’s ability to correctly interpret external data, to learn from such data, and to use those learnings to achieve specific goals and tasks through flexible adaptation” (2019, p. 1). AI is a term that is considered to be found during the Dartmouth Summer Research Project on Artificial Intelligence in 1956 (Kline, 2010). Since then, scholars have been researching machines that demonstrate human-like intelligence (McCarthy, 1989), but initially, computers did not possess enough computing power to calculate complex tasks. After an initial hype for AI and the following “AI-winter” (McCorduck, 2004), it took until the ’80s for the develop-ment of the first expert systems, which were the first truly successful form of AI (Russell & Norvig, 2016). The expert systems solved complex problems through a vari-ety of if-then rules. Since the hardware then had enough storage capacity and was able to cope with complex calculations, data-supply became the limiting factor. A second AI-winter emerged, and the interest and funding for AI were low (McCorduck, 2004). It took until the late 1990s and early 21st century until AI found application in a variety
of domains (Russell et al., 2016), and since then, the success story of AI has not ended. Important milestones are, for example, the Jeopardy! match in 2011 (Markoff, 2011) or the win against the Go champion Lee Sedol in 2016 (Koch, 2016). By utilizing deep learning methods and neural networks, today, AI finds application in many parts of eve-ryone’s daily life and is the engine of further progress (Bruun et al., 2018; Brynjolfsson et al., 2012). Experts predict an immense transformational power of AI whose signifi-cant impact is yet to come. As a new type of general-purpose technology, it will drasti-cally change core processes and business models across industries (Brynjolfsson & Mcafee, 2017).
2.4 AI-Enabled Automation
limit the means of automation to a specific technology. Additionally, the labor-saving objective is essential. Arguably, most technologies developed for the workplace had the goal to save human labor, e.g., through stronger machines (tractors), more consistent machines (assembly lines), or less error-prone tools (digital spreadsheets) (Autor, 2015). Acemoglu and Restrepo (2018) observed that “robotics and current practice in AI are continuing what other automation technologies have done in the past: using machines and computers to substitute for human labor in a widening range of tasks and industrial processes” (p. 3). Here, Acemoglu and Restrepo differentiate between an “old” automa-tion, and a “new” automation through AI and robotics, which allows for replacing hu-mans in ever more activities. This new wave of AI-enabled automation is the origin of modern unrest about technological unemployment and the cause of a wide range of re-search related to job automation (Bruun et al., 2018; Duckworth, Graham, & Osborne, 2019; Manyika, 2017; Pfeiffer, 2018; Wright et al., 2018).
Therefore, within the context of this thesis report, the term automation refers to the new wave of AI-enabled automation and the widening possibilities of replacing human labor engaged with complex tasks. In that sense, AI-enabled automation is not limited to sole-ly physical robot automation or the automation of solesole-ly cognitive tasks. It instead con-tains all aspects of human labor substitution empowered by artificially intelligent sys-tems. This means they can interpret and learn from external data and have the capability to flexibly adapt to achieving a specific goal (see above: AI definition by Kaplan and Haenlein, 2019).
Looking at the business perspective of automation, companies achieve a positive impact of AI-enabled automation technology through efficiency increases, but automation also contributes to GDP growth per capita because it boosts productivity (Manyika, 2017). Manyika (2017) argues that automation provides benefits through better performance, outcome, and quality, it helps overcome human limits and leads to faster innovation and business transformation.
2.5 Limitations of AI-Enabled Automation
elaborate on what job automation researchers have identified as limitations of AI-enabled automation.
2.5.1 Classification of Routine / non-Routine and Abstract / Manual Tasks
Acemoglu and Autor (2011) were the first to separate tasks that were either routine or non-routine and between tasks that were either abstract (cognitive) or manual. They argue that computer-controlled equipment is highly efficient at performing structured tasks, which can be explicitly scripted by a programmer. According to Acemoglu and Autor, those tasks, which cannot be scripted, are not possible to be computerized. Abstract or cognitive tasks are those, which require problem-solving, intuition, persua-sion, and creativity. Hence, abstract tasks characterize managerial, technical, and crea-tive jobs such as lawyers, doctors, scientists, engineers, designers, or managers. In con-trast, manual tasks lie at the other end of the professional skill level and require less formal education. Nevertheless, Acemoglu and Autor argue that non-routine manual tasks are challenging to automate because they need adaption and response to unscripted interaction with the environment or with humans (Acemoglu et al., 2011).
2.5.2 Bottlenecks of Computerization
Frey and Osborne (2017) agree that routine manual tasks and routine cognitive tasks can well be automated, but they argue that with technological progress, especially in the fields of AI and robotics, many non-routine tasks can be automated as well. Activities such as driving a car, legal writing, and medical diagnosis are increasingly being auto-mated with the help of AI. Therefore, they developed new criteria for explaining the automatability of a job. They define the bottlenecks of computerization as ‘perception and manipulation tasks,’ ‘creative intelligence tasks,’ and ‘social intelligence tasks’ (Frey et al., 2017).
Non-routine manual tasks are especially demanding to automate in unstructured envi-ronments because a computer would be required to analyze and handle a variety of ir-regular objects under potentially severe perception conditions. This is why perception and manipulation tasks, e.g., on a construction site, are more difficult to automate than in a logistics warehouse, which represents a thoroughly structured and controlled envi-ronment (Frey et al., 2017).
Social intelligence tasks are those that require negotiation, persuasion, and care. Even though research takes place in this field (Skewes, Amodio, & Seibt, 2019), social inter-action, real-time processing of human emotions, and adequate reactions to humans re-main very difficult. Therefore, jobs that require much social intelligence are less prune to automation (Frey et al., 2017).
2.5.3 Inferring Work Task Automatability from AI Expert Evidence
Duckworth et al. (2019) recently surveyed 150 AI experts for estimations of which ac-tivities are automatable with today’s technology. It is a follow-up research at the same institute as the Frey and Osbourne (2017) article. They made use of the O*NET data-base, which provides highly granular job data and breaks down occupations into numer-ical variables. By nowcasting the survey results onto the O*NET database, Duckworth et al. estimated the automatability of all work activities, tasks, and occupations in the database. Within the model, each occupation is represented by a feature vector compris-ing numerical ratcompris-ings of skills, knowledge, and abilities. The O*NET database provides data about the feature ratings of each occupation from one to five. As part of their sensi-tivity analysis, Duckworth et al. generated gradients that demonstrate the automatability increasing or decreasing influence of the features. For example, an increase of an activi-ty’s rating in the feature called “Fine Arts” by one point leads on average to a decrease of automatability by 0.11 (Duckworth et al., 2019). The 25 most automatability-increasing and decreasing features across the activity space can be seen in Appendix C. Such specific gradients leave the impression of absolute exactness, but in fact, they re-main survey results extrapolated on a database, which naturally induces a certain degree of fuzziness. Different approaches often lead to diverging results: for example, the pre-diction of overall labor automation varies from 47% (Frey et al., 2017) to 14% (Nedelkoska & Quintini, 2018). Nevertheless, Duckworth et al.’s (2019) dataset is the most recent research in this field, and the quantified results allow novel research ap-proaches. Therefore, this is a reminder that the numbers are estimations and might not perfectly represent reality.
2.6 Business Processes
2.7 Automation Technology Initiatives Selection
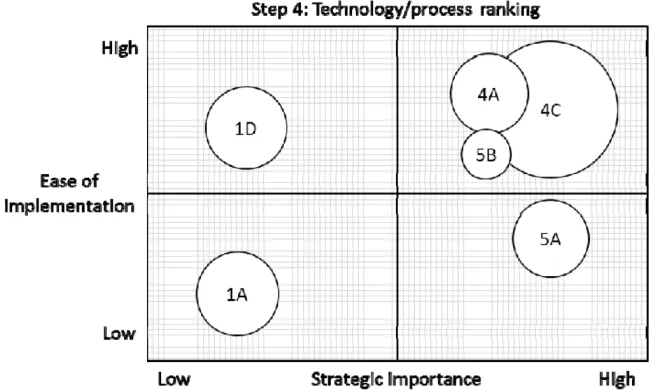
[image:17.595.123.450.217.412.2]Thomassen, Sjøbakk, and Alfnes (2014) developed a strategic approach for automation technology initiatives selection because existing models are time-consuming, require large computations and are challenging to use. After choosing a technology strategy and process/technology pairs, they propose a matrix that uses the variables “Ease of Imple-mentation” and “Strategic Importance” to assess the pairs (see Figure 2). In that way it allows the decision for an automation initiative.
Figure 2 Technology/Process Ranking (Thomassen et al., 2014)
Thomassen et al.’s approach is very generic, and the variables’ assessments are not specified, yet it can be adapted to fit the context of AI-enabled automation better. The variable “Ease of Implementation” strongly relates to the limitations of AI-enabled au-tomation, and “Strategic Importance” can be further framed through resource-based theory.
2.8 Theoretical Framework
The theoretical framework for the analytical framework combines all theories that have so far been elaborated. The central concept is the alignment of the automation of busi-ness processes with strategic management through core competences. First, the theoreti-cal framework itself will be explained, and afterward, it will be applied to an example from the insurance industry.
Other frameworks, such as the Business Model Canvas (Osterwalder & Pigneur, 2010), PESTEL (Yüksel, 2012), or Porter’s Five Forces (Porter, 2008), are not applicable. For instance, in Business Model Canvas, specific processes only play a minor role, and the focus is very high-level. PESTEL and Porter’s Five Forces, on the other hand, are ex-ternal-oriented frameworks and only analyze a company’s environment. Hence, those frameworks cannot be utilized. Another possible approach is the value chain analysis, which is as well an internal analysis and explains a firm’s competitive advantage through differentiation or cost advantages (Porter, 2001). In the end, the resource-based view was still preferred over the value chain analysis as it allows an investigation on a lower level and provides more clear-cut analysis criteria.
2.8.1 Theoretical Framework Description
Business automation has the target of operating or controlling business processes with-out human labor (Wright et al., 2018), but some jobs are more straightforward to auto-mate than others. The bottlenecks of computerization (‘perception and manipulation tasks,’ ‘creative intelligence tasks’ and ‘social intelligence tasks’) serve as an indicator for the automatability of jobs and processes (Frey et al., 2017). The more a process in-volves activities related to the bottlenecks of computerization, the more complicated its automation will be, and the lower is the “Ease of Implementation.”
The resources of a firm can be seen as a source for core competences and sustainable competitive advantage if the resources fulfill the related criteria (Barney, 1991; Grant, 1991; Prahalad et al., 1990). Core competences are not limited to main processes; in-stead, managerial, main, and support processes can all be core competences.
To choose the best automation initiatives, companies should identify processes that have high ease of automation (high automatability) while delivering the best benefit for the business (strategic importance). Two arguments speak for the focus on core processes. Firstly, these processes hold the most significant incentive to be automated, because core competences are the source for sustainable competitive advantage, new products, and new services (Prahalad et al., 1990). Secondly, the distinct set of resources used for sustainable competitive advantages can, per definition, only be accessed by the firm itself (Barney, 1991). Hence, no other firm or subcontractor has either the incentive or the ability to automate that particular process. As a consequence, many non-core com-petences will be available as a commodity and as-a-service in the future, but the core competence of a firm needs to be automated in-house.
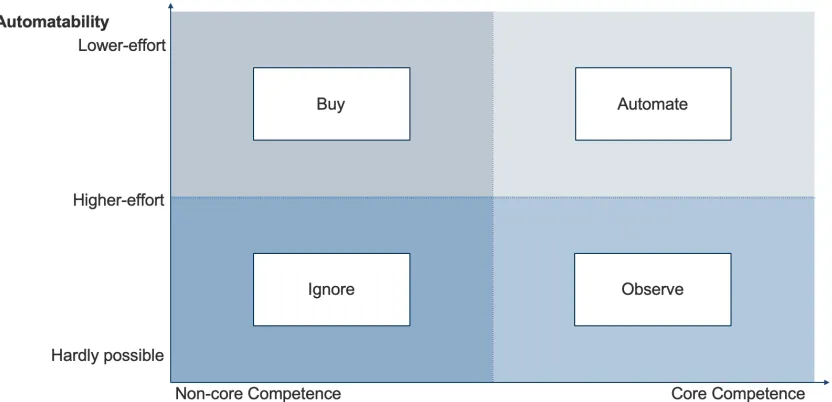
automatability-competence-matrix (ACM). It divides all processes under investigation into four quad-rants with distinct strategic recommendations.
Figure 3 Automatability Competence Matrix (ACM), own figure based on Thomassen et al. (2014)
Automate: This category relates to all processes that the analytical framework recom-mends to automate in-house. For these processes, only the firm itself has the ability and incentive for automation, while the automation is relatively achievable.
Observe: These are the core processes that are not automatable, yet. Hence, technologi-cal progress needs to be observed as these processes might move from Observe to Au-tomate over time.
Buy: Automatable non-core competences contain commodity processes that will proba-bly be taken over by third-party firms, which are specialized in that particular process. Their services can be bought, which is comparable to conventional outsourcing.
Ignore: Not-automatable non-core competences might be ignored and stay as they are. After a certain time, they possibly will move to the Buy quadrant.
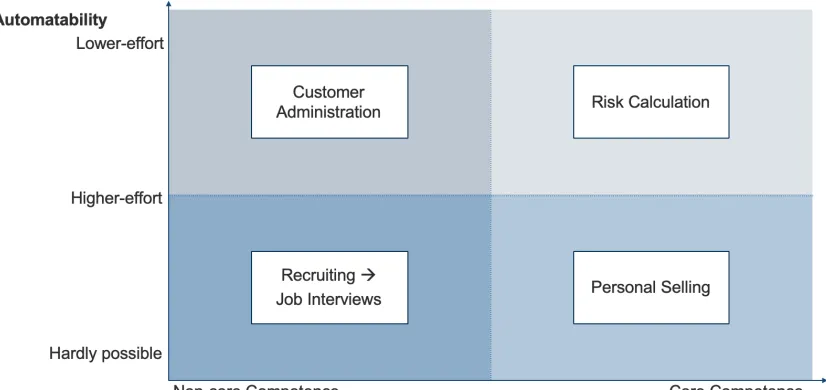
2.8.2 Example: Insurance Company
An example of tagging processes according to the ACM will be given for a fictitious insurance company. Along the value chain of an insurance company, exemplary pro-cesses are the recruitment of personnel, the calculation of new insurances and risks, customer administration, and sales.
heavily relies on their broad network of insurance agents and brokers, who promote and relationship sell the firm’s products regionally (Hain, Rutherford, & Hair Jr, 2019). They are the centerpiece of the sales process. Even though customer administration and recruitment are critical processes, they are not a source for the sustained competitive advantage of the example company. Therefore, they are considered as non-core compe-tence.
When looking at the processes’ automatabilities, customer administration, and risk cal-culation show little relatedness to the bottlenecks of computerization. Customer admin-istration is a process that is already well automated with customer relationship manage-ment software (Triznova, Maťova, Dvoracek et al., 2015), and risk calculation is a high-ly anahigh-lytical and number-driven task (cf. Appendix I.2). Sales, on the other hand, espe-cially personal selling through insurance agents, require high social intelligence. There-fore, its automation is many degrees more complicated than the risk calculation or cus-tomer administration.
[image:20.595.108.521.469.664.2]The recruitment process is an excellent example of where process decomposition is re-quired. Even though performing job interviews requires extremely high social intelli-gence, many recruitment processes (e.g., candidate sourcing) are already automated (Bischke, 2018). For analyzing the automatability of the recruitment, the process needs to be broken down into a lower abstractness. In this case, only job interviews will be placed in the Ignore quadrant of the ACM. The ACM with the exemplary processes can be seen in the following Figure:
3
Method
3.1 Design Science Research
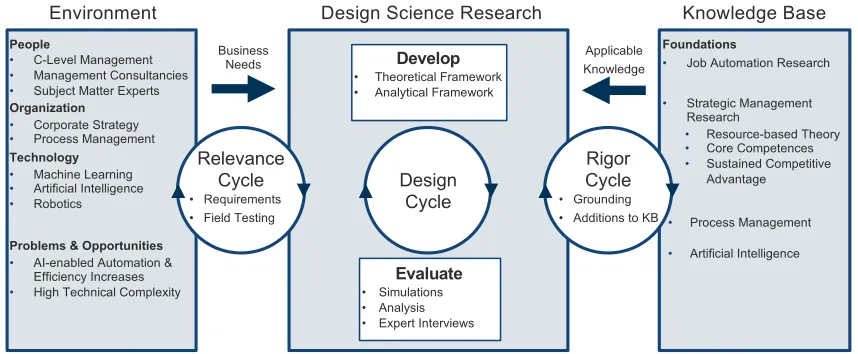
Design science research (DSR) has its roots in the discipline of information systems and is increasingly used in many fields whenever the development of an artifact or model is the goal of the research (Thuan, Drechsler, & Antunes, 2019). Generally, when design-ing an artifact, DSR takes the related environment and knowledge base into account. The environment represents the business world and application domain, which provide their business needs to the design process. From the knowledge base, knowledge is ex-tracted from all research fields that are relevant for the artifact. In that way, it is possible to develop artifacts that are designed to solve a particular problem. DSR is an iterative process, which requires constant evaluation of the designed artifact and the next rede-sign (Hevner, 2007).
[image:21.595.100.529.395.572.2]Hevner (2007) describes DSR in three iterative cycles: a relevance cycle, a design cycle, and a rigor cycle. The framework can be seen in Figure 5, which is customized to the research.
Figure 5 Design Science Research Cycles, adapted from Hevner (2007)
Peffers, Tuunanen, Rothenberger, & Chatterjee (2007) proposed a DSR methodology, which helps to structure DSR cycles. Depending on the research entry points, it defines the steps and iterations necessary to conduct DSR (see Appendix A).
Since this research was conducted in cooperation with UNITY AG, the demand for practical relevance is high. Additionally, Van Aken (2005) argues that there is a rele-vance gap in academic management research. Arguably, conventional deductive (testing a theory) or inductive (building a theory) business management research approaches can hardly be applied to answer design-related research questions. DSR has proven to be successful for explorative and solution-oriented studies (Peffers et al., 2007) and hence
People
• C-Level Management • Management Consultancies • Subject Matter Experts
Organization
• Corporate Strategy • Process Management
Technology
• Machine Learning • Artificial Intelligence • Robotics
Problems & Opportunities
• AI-enabled Automation & Efficiency Increases • High Technical Complexity
Foundations
• Job Automation Research
• Strategic Management Research
• Resource-based Theory • Core Competences • Sustained Competitive
Advantage
• Process Management • Artificial Intelligence
Relevance Cycle
• Requirements • Field Testing
Rigor Cycle
• Grounding • Additions to KB
Knowledge Base Design Science Research
Environment
Design Cycle Develop
• Theoretical Framework • Analytical Framework
Evaluate
• Simulations • Analysis • Expert Interviews Business
Needs
is well eligible for developing an analytical framework. Therefore, this research is struc-tured according to the DSR cycles and methodology.
3.2 Research Model
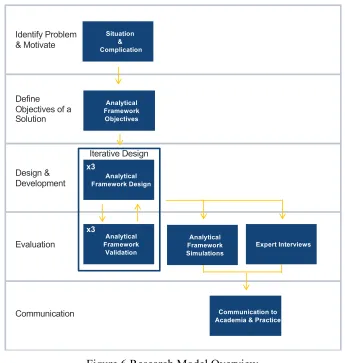
[image:22.595.140.485.304.667.2]Figure 6 provides a graphical overview of the research model derived from the iterative approach by Peffers et al. (2007) to ensure a rigorous framework design. The research started with a problem-centered initiation, which is elaborated in Chapter 1.1. The re-sulting research goal and research questions outline the objectives of the research. The objectives of the analytical framework have been developed during a semi-structured interview with Strategy Expert 1 (see Appendix H). In that way, it was possi-ble to integrate practical requirements directly from the start and to increase the arti-fact's applicability.
Figure 6 Research Model Overview
The next step was to design the analytical framework iteratively with three rounds of validation and refinement. For that purpose, the different versions of the analytical framework have been evaluated in cooperation with the Medical Technology Expert (see Appendix H), who took over the role of a business manager for a medical technol-ogy company. After each round of validation, the Medical Technoltechnol-ogy Expert gave
Identify Problem & Motivate
Define
Objectives of a Solution
Design & Development
Evaluation
Communication
Situation & Complication
Analytical Framework Objectives
Analytical Framework Design
Analytical Framework
Validation Iterative Design
x3
x3
Communication to Academia & Practice Analytical
Framework Simulations
feedback on the usability, and the test results have been analyzed. In that way, it was possible to quickly iterate and improve the analytical framework during the design phase.
For engaging in rigorous design evaluation, it is suggested to utilize different techniques such as experiments, simulations, or case studies (Von Alan, March, Park et al., 2004). This is why a mixed-method approach was chosen to achieve the highest rigor as possi-ble. Four simulations with the analytical framework, two Strategy Expert interviews, and one Data Technology Expert interview were conducted.
The simulations took place with four senior consultants, who mimicked the role of a company’s management with which they have several years of consulting experience. In that way, they were empowered to act as a user of the analytical framework under ex-perimental conditions. At first, the theoretical framework was introduced to explain the general background. Then, during the simulations, the consultants were guided through the analytical framework. Afterward, they could give feedback related to the frame-work’s usability and the generated results. In the end, the consultant’s feedback and the data generated were analyzed for evaluating the analytical framework.
Furthermore, expert interviews were conducted. Firstly, the automatability assessment was simulated with the Data Technology Expert. Afterward, the automatability results from the other simulations were presented to receive his technology expert opinion on the overall data. Additionally, Strategy Expert 1 and 2 were consulted to validate the theoretical model and propose possible improvements.
Each of the three expert interviews á ~40 minutes and four simulations á ~75 minutes have been dealt with as semi-structured expert interviews. Semi-structured interviews are chosen because it is necessary to have the experts explain and build on their re-sponses. In that way, the expert’s answers were not too restricted, and they could ex-press their knowledge and motives regarding their specific field of expertise. They could also lead the discussion in an unexpected direction, which they think is important and relevant for the framework (Bryman & Bell, 2011; Saunders, Lewis, & Thornhill, 2009).
4
Results
The Results Section is structured as follows: at first, the outcome of the theoretical framework evaluation is presented, as it builds the foundation of the analytical frame-work. It is continued with the analytical framework’s design by elaborating its general settings and the individual components. Lastly, the results of the analytical framework simulation are presented.
4.1 Theoretical Framework Evaluation
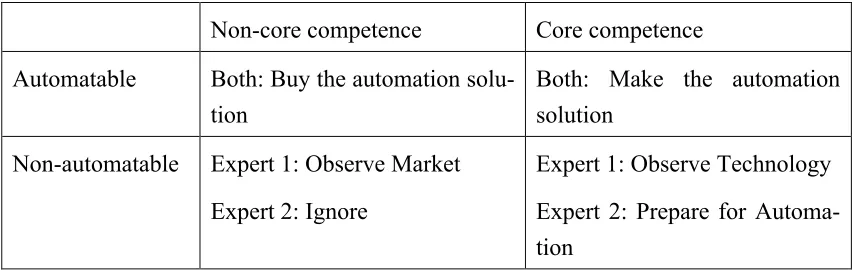
[image:24.595.99.528.456.591.2]In general, the feedback from the simulations was that the core competence analysis adds a valuable feature to the discussion about automation use cases. Core competences could serve as a filter for focusing on the strategically relevant business processes. Both Strategy Expert 1 & 2 support the idea to differentiate between core competences and non-core competences and to illustrate the variables in a two times two matrix. As well, they agree that automatable core competences should be automated in-house and that a third party should automate non-core competences as a service. Strategy Expert 2 stressed the critical difference between make or buy and that they should also be named accordingly. Nevertheless, the strategic implications in the lower half of the matrix leave more room for discussion.
Table 3 ACM Strategic Implications Expert Opinion Non-core competence Core competence Automatable Both: Buy the automation
solu-tion
Both: Make the automation solution
Non-automatable Expert 1: Observe Market Expert 2: Ignore
Expert 1: Observe Technology Expert 2: Prepare for Automa-tion
Strategy Expert 1 emphasized that technological possibilities are endless, and hence both the market (new offerings) and technological developments (new technologies) should be observed for further advancements and possible efficiency increases (see Ap-pendix I.1). Strategy Expert 2, on the other hand, has a more practical approach: by adapting, standardizing, and systemizing processes, non-automatable core competences should be prepared for future automation. While this effort is worthy for core compe-tences, non-core competences do not require such investment and might be ignored until an automated solution enters the market (see Appendix I.2).
tion for preparing non-automatable core competences adds value to the theoretical framework.
4.2 Analytical Framework Design
The following chapters serve to describe the designed analytical framework. Firstly, the general setting is explained by detailing the analytical framework’s objectives and struc-ture. Then, each central component is elaborated individually, while, if necessary, the search process is depicted as well (Gregor & Hevner, 2013).
4.2.1 Analytical Framework Objectives & Setting
One primary goal of the analytical framework is to demonstrate and test the validity of the theoretical model on a set of example processes. In this way, the analytical frame-work raises no claims of being a complete solution for identifying the processes for au-tomation. It shall instead give insights into the general understanding of how to identify automation use cases and provide a rough estimation.
The objective has academic and professional reasons. From an academic perspective, the analytical framework will be used to test the theoretical framework and to generate data. This data can be analyzed to receive insights into the underlying mechanisms. From a professional perspective, such an analytical framework can be utilized to demonstrate a business consulting approach towards potential customers. By exemplari-ly showcasing the anaexemplari-lysis of the firm on a small scale, the interest in a more compre-hensive analysis might be created.
As the interview with Strategy Expert 1 has shown, to comprehensively analyze all business processes according to the theoretical model, a several weeks long workshop series with a variety of different attendants is necessary. On the other hand, consultan-cies often offer a quick “bait-service,” which has the target to demonstrate expertise and to attract customers. These services usually take place with a business leader in a timeframe of up to 1.5 hours (see Appendix I.1). Therefore, academic and professional requirements can be best met by designing an analytical framework, which
1. identifies automatable business areas that should be further analyzed, 2. is based on the theoretical framework,
3. can be simulated to produce a set of reliable data, 4. builds upon state-of-the-art knowledge,
5. does not require more than 1.5 hours, and
6. matches the skills and needs of a business manager.
after each other, and in the end, the results are demonstrated in the Automatability-Competence-Matrix (ACM) and with an ACM score. The setting for the analytical framework is a bilateral exchange between the business manager and the consultant, who is guiding the manager and fills the framework with the provided data.
4.2.2 Process Request
The process request shapes the progress of the analytical framework, as here the busi-ness manager states the processes that will be analyzed. The process request consists of one question:
“What processes along the company's value chain are critical to its success? Please, name up to 7 processes!”
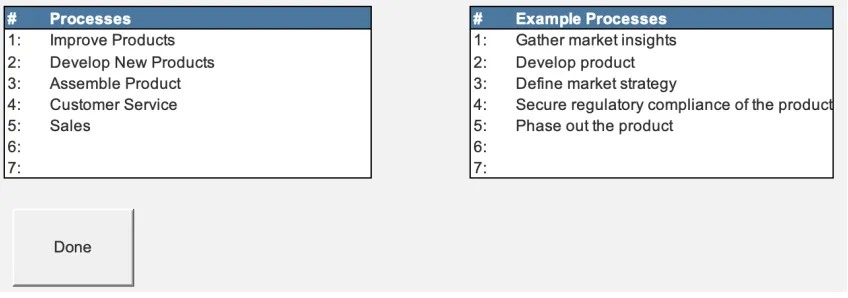
[image:26.595.102.526.527.676.2]As the targeted timeframe is limited to 1.5 hours, it is necessary to limit the amount and type of possible processes. It is barely possible to look at all the business processes of a company during this time. On the one hand, the manager shall not be guided too strong-ly during the process because his answers need to be unbiased and honest. On the other hand, the answers require to be provided in a way that they apply to the following steps. Asking for processes which are critical for the success already guides the manager into the direction of core processes, without actually naming the term “core competence” and without influencing considerably. Within the framework, processes of the initial validation are demonstrated as a set of example processes. These serve as support to better understand the question. The setup of the Excel worksheet is illustrated in Figure 7.
Figure 7 Process Request Worksheet
4.2.3 Core Competence Analysis
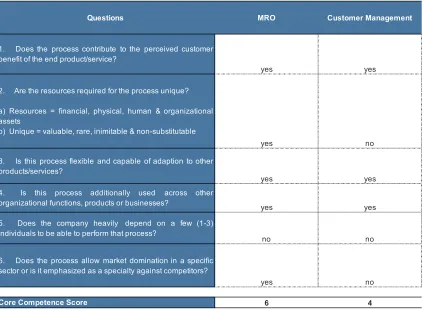
dummy variable question items are used, which are equally weighted and need to be answered with either ‘yes’ or ‘no.’ Therefore, the resulting core competence score reaches from zero to six. Within the worksheet, processes and question items form a matrix to enable answering all questions in a structured way. The worksheet and ques-tion items are illustrated in Figure 8:
[image:27.595.104.527.167.477.2]Figure 8 Extract from Core Competence Analysis Worksheet
All items are derived from the literature regarding core competences and are related to the work by Boguslauskas et al. (2009), who proposed a scheme for the identification of potential core processes in the context of business process outsourcing. The items one to three are grounded in the arguments of Prahalad et al. (1990). Additionally, resource-based theory identifies four characteristics of a firm’s core competence (Barney, 1991). This is why item two is extended by the requirement that the resources required for the process need to be unique (valuable, rare, difficult to imitate, and difficult to substitute). Quinn et al. (1994) provide another source for the core competence analysis, who de-scribe core competences as
• flexible, long-term platforms, capable of adaption or evolution (item 3),
• embedded in the organization’s system (item 4), and
• areas where the company can dominate (item 6).
The approach to identify core competences by Hafeez et al. (2002) is different in the application, but the underlying theories are strongly overlapping. Only what they call
Questions MRO Customer Management
1. Does the process contribute to the perceived customer benefit of the end product/service?
yes yes
2. Are the resources required for the process unique?
a) Resources = financial, physical, human & organizational assets
b) Unique = valuable, rare, inimitable & non-substitutable
yes no
3. Is this process flexible and capable of adaption to other products/services?
yes yes
4. Is this process additionally used across other
organizational functions, products or businesses? yes yes
5. Does the company heavily depend on a few (1-3) individuals to be able to perform that process?
no no
6. Does the process allow market domination in a specific sector or is it emphasized as a specialty against competitors?
yes no
“collectiveness determination” is not included in the other methods. Hence, the depend-ency on a few individuals has been added as a negative criterion for core competences (item 5). According to Hafeez et al. (2002), a competence cannot be a company’s core competence, if the execution and knowledge are highly dependent on a few individuals.
4.2.4 Automatability Assessment
The automatability assessment serves to estimate whether current technology is capable of automating a process. The estimates are not binary in the sense that the processes are either automatable or not. Instead, they indicate as to how extensive the development of the automated solution would be. Even though the economic interest in automation is tremendous, the knowledge base in the field of estimating what is automatable is sparse. Hence, the automatability assessment’s design was more iterative and experimental than the design of the other components.
The proposed solution heavily relies on the results from Duckworth et al. (2019), who surveyed 150 AI experts to estimate which activities are automatable with today’s tech-nology. Duckworth granted access to the complete database (see email communication, Appendix D), which allows the utilization of the features for assessing a process’s au-tomatability. The general concept of the assessment is that to perform a process, the acting person requires a particular set of skills, knowledge, and abilities. Therefore, each process can be characterized by a numerical rating of features (skills, knowledge, and abilities).
Duckworth’s dataset provides information about the automatability gradient of all skills, knowledge, and abilities that are included in the O*NET database. It then allows for transforming the set of features into automatability estimates by accumulating the nu-merical rating times the feature gradient:
𝐴𝑢𝑡𝑜𝑚𝑎𝑡𝑎𝑏𝑖𝑙𝑖𝑡𝑦 𝑆𝑐𝑜𝑟𝑒 = 1 𝑅𝑎𝑡𝑖𝑛𝑔56789:6∗ 𝐺𝑟𝑎𝑑𝑖𝑒𝑛𝑡56789:6
Formula 1 Automatability Score, self-developed
Coordi-24 ness and Management” has been split, and each containing feature is equally weighted as the other feature clusters.
In the end, 23 features and feature clusters comprise the automatability assessment, which implies that all processes from the process request are to be rated 23 times. The O*NET database also provides descriptions of each feature and feature cluster, which are additionally presented to the user for explanatory purposes. For those features that are clustered features, it is possible within the framework to display the containing fea-tures and feature descriptions. The feafea-tures, descriptions, and gradients included in the automatability assessment are summarized in Appendix F.
[image:29.595.104.525.429.722.2]Initially, the features were rated on a scale from one to five, but by rating a feature with the least possible rating, a one, the feature still influences the overall automatability score. As gradients describe the increase or decrease when the rating is increased by one, it should be possible to give a rating without any influence on the automatability score. Hence, the scale was expanded by the answer option zero. This allows to exclude a feature from the calculation entirely and does not profoundly change the responses. According to Allen and Seaman (2007), it is recommended to use as wide a scale as possible, because the answers can always be collapsed afterward. Additionally, the now proposed six-point Likert scale eliminates the neutral option, which forces the user to decide for a tendency.
Figure 9 Extract from Automatability Assessment Worksheet
Skill, Knowledge, Ability Desciption MRO
Give Ratings from 0 - 5 0 - no dependency 1 - little
2 - little/medium 3 - medium 4 - medium/strong 5 - strong dependency
Quantitative Abilities Abilities that influence the solution of problems
involving mathematical relationships 1
Auditory and Speech Abilities Abilities related to auditory and oral input, e.g.
speech recognition or sound localization 2
Administration and other office procedures
Knowledge of administrative and clerical procedures and systems such as word processing, managing files and records, stenography and transcription, designing forms, and other office procedures and terminology.
2
Economics and Accounting
Application of economic and accounting principles and practices; analysis and reporting of financial data.
0
Sales and Marketing
Knowledge of principles and methods for showing, promoting, and selling products or
services. This includes marketing strategy 0
Within the framework, the processes are again presented at the top, the features are writ-ten vertically, and the gradients are not displayed to the user for ensuring unbiased re-sponses. Figure 9 illustrates the worksheet setup. For guiding the user along with the feature ratings, the overall question is: “To what degree does each process make use of the following skills, abilities, and knowledge?”. Additionally, the six-point Likert scale is explained with a qualitative description.
Other approaches for the automatability assessment have been trialed and neglected during the design phase. In general, an optimization problem occurred between two con-tradicting targets, which were, on the one hand, an accurate automatability prediction and, on the other hand, a fast and user-friendly assessment. For example, instead of ob-serving on the skills, knowledge, and ability level, the occupational level might be uti-lized. Unfortunately, these have shown to be unusable as they are too generic and ne-glect the substantial varieties of automatability within one occupational group.
4.2.5 Automatability Competence Matrix and Score
For interpreting the results of the core competence and automatability analysis, each process is placed in a matrix, as described in Chapter 2.8. The abscissa represents the core competence score and spans from zero to six, where six represents a 100% core process. The automatability score is placed on the ordinate and has a variable span, de-pending on the assessments of the processes.
As described in the theoretical framework, those processes which are easier to be auto-mated and which make use of a firm’s core competences should be autoauto-mated first. For comparing the processes with each other and allow reasoned decision-making, it is nec-essary to be able to quantitatively evaluate the degree to which each process is in the top right corner of the ACM. Therefore, an ACM score is introduced, which serves the user as a prioritization tool. This ACM score is generated by calculating the Euclidian dis-tance to the bottom left corner of the ACM, where the core competence score equals zero, and the automatability is at the “lowest automatability baseline.” Since in each batch the process with the lowest automatability might have a different score, the pro-cess with the lowest automatability score serves as the lowest automatability baseline for the other processes. The formula and description of the ACM score calculation are elaborated in Appendix G. As already mentioned in Chapter 2.5.3, the assessment re-sults and scores are quantified, but the numbers rely on survey rere-sults. Hence, a certain degree of deviation from “reality” is most certain and should be remembered.
The process “Develop product” has been assessed as the least automatable and therefore targets the lowest automatability baseline. Then, the Euclidian distance to each process is calculated from the intersection of the ordinate with the lowest automatability base-line. None of the processes were evaluated to be in the top right corner, and only two of them came close. Here, the ACM score provides a convenient quantitative comparison and prioritization option.
Figure 10 ACM Score Calculation Table 4 Validation ACM Scores
Rank Process ACM-score
1 Secure regulatory
compli-ance of the product 1,118 2 Define market strategy 0,868 3 Gather market insights 0,839 4 Phase out the product 0,740
5 Develop product 0,667
4.2.6 Analytical Framework Overview
[image:31.595.176.451.562.670.2]success. These will be further analyzed during the following steps. Step two is the core competence analysis, which utilizes six dummy questions to elaborate the degree to which the processes are core processes. In step three, the automatability assessment, the business manager is asked to rate each process according to the degree it depends on 23 different skills, knowledge, and abilities. In that way, the processes’ automatabilities are estimated. In the end, the processes are placed in the automatability-competence-matrix, which allows deriving recommendations about the automation strategy (make/buy/prepare/observe).
4.3 Analytical Framework Simulation
After completion of the design phase, the analytical framework’s application was simu-lated four times (Simulation A-D). As described in Chapter 3.2, four consultants mim-icked the roles of the business managers of four different companies (see Table 5). For each company, they can demonstrate in-depth knowledge and experience, which em-powers them to take over that role. The consultants were guided through each step in the analytical framework, and afterward, the results have been presented. In the end, the consultants gave feedback related to the application of the analytical framework and the generated results. The entire analytical framework simulation spreadsheets can be found in the Annex. Resulting ACM matrices are shown in Figure 11.
The simulation results demonstrate the following characteristics:
1. The processes are skewed towards the right, which means all processes tend to-wards being core processes.
2. The range of automatability scores reaches from -0.63 to 0.91.
3. Only the automatability scores of Company A are balanced between positive and negative, whereas for B, they are solely positive, and for C and D, they are strongly negative.
[image:32.595.92.522.629.735.2]4. The highest-ranked processes, according to the ACM score, are Assembly (1.302), Drop Shipping (1.302), Sales (1.202), and MRO (1.093).
Table 5 Simulations Company Overview
Company Industry
Company A Industrial Sewing Machine Producer
Company B Bedding Goods Producer
Company C Pipe, Fiber & Cable Producer
Figure 11 Simulation Results - ACM Matrices
The feedback after simulation A was that the level of analysis is too high, and even though some processes are declared to be not automatable, there still might be sub-processes that are automatable. It was suggested that it might be useful to utilize com-pany process maps to identify which processes are automatable (see Appendix J.1). During Simulation B, the interviewee intentionally mimicked the situation before a company-wide automation initiative, which he had accompanied in 2018. Hence, the results were directly verifiable. Additionally, the interviewee brought a process map of company B, which was used to identify processes for the analysis. Each of the selected processes was estimated to be automatable, while the order acceptance process had the highest-rated automatability and core competence score. This result is wholly aligned with the interviewee’s expectations, as it is a rather simple process that has already been automated end-end, and it is the number one core competence of Company B. In to-tal, many aspects of all the given processes have at least partly been automated. In this
Development Process Product Management Procurement Disposition Sales Logistics Assembly -0,8 -0,6 -0,4 -0,2 0 0,2 0,4 0,6 0,8
0 1 2 3 4 5 6
AUT
OMA
TABILITY
SCORE
CORE COMPETENCE SCORE Company A Dispatch Production Order Process Production Order Commission Material Drop Shipping (Order
Acceptance) 0 0,1 0,2 0,3 0,4 0,5 0,6 0,7 0,8 0,9 1
0 1 2 3 4 5 6
AUT
OMA
TABILITY
SCORE
CORE COMPETENCE SCORE
Company B
Improve Products Develop New Products Assemble Product Customer Service Sales -0,5 -0,4 -0,3 -0,2 -0,1 0 0,1
0 1 2 3 4 5 6
AUT
OMA
TABILITY
SCORE
CORE COMPETENCE SCORE
Company C
MRO Customer Management
Innovation Management (non-tech) Technology Management -0,5 -0,45 -0,4 -0,35 -0,3 -0,25 -0,2 -0,15 -0,1 -0,05 0
0 1 2 3 4 5 6
AUT
OMA
TABILITY
SCORE
CORE COMPETENCE SCORE
case, the feedback was that both automatability assessment, as well as core competence analysis, have been accurate (see Appendix J.2).
Simulation C and D both suffered from a process level difficulty. After Simulation C, the feedback was that the acting person for each process was unclear, and hence, differ-ent roles had been mixed that take part in the process. The result is that the majority of processes are estimated to be hardly automatable. Even though the automatability scores are negative, the interviewee mentioned that their relation to each other still is accurate and that the core competence scores fit as well (see Appendix J.3)
5
Analysis
5.1 Core Competence Analysis
Overall, the core competence analysis has proven to be accurate. Three out of four con-sultants explicitly mentioned that the analysis result meets their expectations. Neverthe-less, an observation is that all processes under investigation have a core competence score of three or higher. Three possible explanations for this phenomenon have been identified.
Firstly, the initial process request is biased as it directly asks for “critical” processes. In that way, minor processes have been ignored from the start.
A second explanation relates to the theory of core competences. Usually, companies do not have more than five core competences, which is why the framework for identifying core competences by Boguslauskas et al. (2009) uses knock-out variables. If one criteri-on is not met, after their definiticriteri-on, it is no core competence. By applying this logic to the results above, only one out of twenty processes would be assessed to be core, which better reflects theory. Anyhow, it was intentionally decided to give scores from zero to six to provide a more differentiated core competence assessment.
Confirmation bias might induce the third reason for skewed core competence ratings (Nickerson, 1998). As in the beginning, the consultants were asked for critical process-es, they might have (unconsciously) given biased answers within the core competence analysis to confirm their initial estimate.
Additionally, minor issues occurred related to questions three1, four2 and five3.
Ques-tions three and four have always been answered with “yes”, which indicates that their difference is not relevant to the users. For that reason, both questions should be merged. Question five lead two times to confusion, which is why the item could be reformulated to be less ambiguous. In the end, even though there might be certain limitations to the analysis, the overall performance of the core competence analysis can be validated.
5.2 Automatability Assessment
In general, the automatability assessment demonstrated a valuable performance when comparing the processes’ scores among each other. Their relation with each other
usual-1 Question 3: “Is this process flexible and capable of adaption to other products/services?”
2 Question 4: “Is this process additionally used across other organizational functions, products or busi-nesses?
ly reflects the expected outcome, as was the feedback during the simulations and the interview with the Data Technology Expert (see Appendix I.3). Especially during simu-lation B, all processes that were estimated to be automatable have already been comput-erized. This leads to the conclusion that the classification of processes by using skills, knowledge, and abilities is generally suitable for determining their automatability. The following figure summarizes the automatability scores of all four simulations and the simulation results from the Data Technology Expert interview:
Figure 12 Automatability Assessment Results
In general, repetitive and manual tasks group at the upper end of the automatability scores, which is in line with the theory by Acemoglu et al. (2017). Customer-oriented processes, such as sales or customer service, are found in the middle section. This also appears to be accurate: many aspects of customer-oriented processes are already auto-mated through e-commerce, chatbots, or self-service websites. Nevertheless, social in-telligence (a bottleneck of computerization) and other soft skills often are critical skills when dealing with customers, but these are difficult to automate (Huang & Rust, 2018). Therefore, their mid-range automatability scores seem to be justified. Finally, develop-ment and managedevelop-ment processes represent the bottom part of automatabilities. This, again, is according to findings by Kaplan et al. (2019) or Frey et al. (2017), as these processes are mixtures of creative, social, and cognitive tasks.
Even though the general impression of the results implies accordance to theory, three significant limitations have been identified:
-0,8 -0,6 -0,4 -0,2 0 0,2 0,4 0,6 0,8 1 1,2 Development Process
Production Management Product Management Improve Products Develop New Products Innovation Management (non-tech) Technology Management Assemble Product MRO Software Development Customer Management Customer Service Sales Sales Disposition Procurement Logistics Dispatch Production Order Assembly Process Production Order
Commission Material Drop Shipping (Order Acceptance) Accounting
1. Personal backgrounds bias feature ratings
2. The automatability score itself is not informative, because assessment results foremost matter in relation to each other.
3. High-level processes cannot be estimated accurately
Firstly, the evaluation of skills, knowledge, and abilities is a highly subjective task and is influenced by the personal and professional background. During the interviews, it was recognizable that interviewees tended to give higher feature ratings to their own profes-sion. On the one hand, this might be caused by a more profound understanding in one field than the other. On the other hand, there might be a bias to overestimate one’s own profession in relation to other professions. For example, the software developer distrib-uted 37 skills, knowledge, and ability points to software development, but only 23 to accounting. As well, a Ph.D. in engineering gave 74 points to an engineering process, whereas procurement only received 22 points.
This leads to the second important limitation: as everyone has a slightly different rating behavior, perspective, and understanding of the processes and features, it is not general-ly possible to compare assessment results from separate interviews. This is why, in rela-tion to each other, the assessment was usually appropriate, but the overall score did not always reflect the expectations.
When analyzing processes that contain sub-processes, a third limitation emerges. Even though the general impression of a process could indicate a difficult automatability, there still might be the case that a particular sub-process is highly automatable (see Ap-pendix I.3). This induces the risk of missing out on valuable automation possibilities. Additionally, high-level processes are too vague to be analyzed. During the assess-ments, the interviewees tended to jump between several sub-processes and intermingled operational and managerial roles. That is why overall automatability scores have been lower, e.g., in Simulation C and D.