Vol.8 (2018) No. 6
ISSN: 2088-5334
A New Method for Battery Lifetime Estimation Using Experimental
Testbed for Zigbee Wireless Technology
Dahlila Putri Dahnil
#1, Supiah Selamat
#2, Khairul Azmi Abu Bakar
#3, Rosilah Hassan
#4, Ahmad G. Ismail
* #Center for Software Technology and Management, Faculty of Information Science and Technology, Universiti Kebangsaan Malaysia, 43600 Bangi, Selangor, Malaysia.
E-mail: [email protected], [email protected], [email protected], [email protected]
*
Institute of Microengineering & Nanotechnology, Universiti Kebangsaan Malaysia, 43600 Bangi, Selangor Email: [email protected]
Abstract— Many Zigbee-based wireless sensor networks have been developed for outdoor applications such as agriculture monitoring. The main attractiveness of Zigbee wireless module is in its potential to set up self-organizing network that requires no network backbone and extremely low cost with low-power wireless networking. Many simulations have been performed for testing the capabilities of wireless communication device and the battery lifetime. However, the results from the simulation do not capture the actual environment effects and the simulators allow users to isolate certain factors by tuning to different parameters. This paper provides experimental results on actual voltage drop using Zigbee protocol devices when communicating temperature, humidity and soil moisture data using a 900mAh battery both in indoor and outdoor environments. It is observed that the wireless nodes are capable of relaying data up to 143 meters on unobstructed line of sights in an outdoor environment with some observation of packet drop. The results differ from previous researches that perform the experiments on shorter range which only covers 50 cm distance between transmitter node and receiver node for 2 bytes of data transfer. The paper proposes a new method for battery lifetime estimation which is derived from number of times data packet can be transmitted. This study also suggests to conduct experiment by including the environmental factors to capture the actual performance of wireless device and the impact to packet drop. The experiment concludes the suitability of Zigbee wireless communication for short-range applications of up to 143 meters which is significantly farther than other reported experiments.
Keywords— Zigbee wireless technology; Arduino; Xbee; lifetime.
I. INTRODUCTION
The foundation of monitoring system lies on wireless network capability to sense the physical environment and to forward information to a central processing unit [1-2]. There are two main components involved namely the sensor devices that interact with the physical environment and a wireless module for sensor devices to communicate wirelessly. These devices when connected form wireless sensor networks [3].
Wireless sensor networks become popular in many applications due to its ability to sense the physical environment’s attributes and transmit the sensed data to a central processing unit for smart decision-making [4]. One of the most promising wireless technologies for wireless sensor networks is 802.15.4/ZigBee. ZigBee builds upon the IEEE 802.15.4 standard [5], which defines the physical and Media Access Control (MAC) layers of the communication protocol stack [6]. Zigbee has been proposed in many applications despite its immature state [7] and has emerged
as principle wireless technology for transmitting data between devices due to its simplicity of installation, extremely low cost, low-rate data transfer and low-power wireless networking [8]. It is suitable for applications that require connectivity up to 100 meters and most popular for short-range wireless personal area network [9].
they consume less power and work reliably under outdoor agricultural conditions [13].
The lifetime of the wireless sensor networks depends significantly on the battery usage. The study of battery consumption mostly has been done on the simulated environment [14] because building a real testbed is costly, complicated and time-consuming [15]. However, the results from the simulation do not capture the actual environmental effects, and the simulators allow users to isolate specific factors by tuning to different parameters [16]. An experiment performed on more realistic testbed is required because the battery drainage needs to be measured when the actual environment is taken into consideration. Once deployed, the weather conditions will be one of the factors in determining the success rate of wireless data transfer.
This paper presents experimental results when actual testbed is set up for transmitting agriculture parameters such as soil moisture, temperature, and humidity between two Xbee S2 Pro (Xbee is hardware that uses Zigbee communication protocol) devices operated on Lithium Polymer (LiPo) batteries. The paper provides voltage measurements in indoor and outdoor environments with three different distances, i.e. 38 m, 143 m, and 230 m. A new method for battery lifetime estimation is proposed in term of sometimes data packet can be transmitted. The results differ from previous research that experimented on the 50cm distance between the source node and the coordinator node for 2 bytes of data transfer [58]. Our results show the extended range of up to 143m when transmitting 15 bytes of data on the unobstructed line of sight and 230m with some trees between the source node and the coordinator node.
II. MATERIAL AND METHOD
A. Agriculture Applications
Wireless networks have many advantages including easy installation, cost-efficiency, and reliability, which lead to a wide range of applications [17]. Unlike wired networks, wireless networks such as Zigbee, Long Range (LoRa),
Wireless Fidelity (Wi-Fi networks), and satellite
communication systems, are independent of fixed
infrastructure [18-23]. Many agricultural applications have been proposed in wireless sensor networks [24-28]. Traditional agriculture activities require farmers to collect information manually at the scene [22, 29-30]. Today, wireless sensor networks modernize agriculture activities with remote monitoring. Information on the plants can be obtained wirelessly and in real-time [30-34]. Pictures of the farming plot can be obtained from sensor networks to farmers regardless of their locations. The sensor networks can manage automatic plant watering based on the soil water content [35]. Other information of the soil such as humidity, temperature, and potential of hydrogen (pH) level can be sent to farmer’s monitoring application either on mobile or web in a real-time manner [36]. The technology can be used to increase production efficiency, improve crop quality and at the same time protect the environment [37].
B. Zigbee Battery Measurement Review
There are many agriculture applications developed for wireless sensor network using Zigbee technologies [38-45].
The biggest challenge reported by Tuijl et al. (2007) for agriculture and horticulture application for short communication distance of between 10 to 30 m is the maintenance cost for frequent replacement of batteries, which goes back to the cost of implementation [46].
Agricultural applications depend significantly on the battery to power up the sensor devices. Most of the battery consumption is based on the simulated environment, and the battery prediction model are derived from this setup [47].
The work in [48] studied the current consumption of commercializing chipset including Bluetooth, Ultrawideband, IEEE 802.11, and IEEE802.15.4/Zigbee technologies during transmission and reception. The paper reported that IEE802.15.4 required very small current which was one-tenth of UWB, Wi-fi and half of the current needed by Bluetooth.
The work in [49-50] conducted a study on the impact of coexistence of 802.15.4 with other wireless technologies operating in the same 2.4GHz ISM band. The results showed the interference from other wireless technologies would have a serious effect on the throughput.
The study in [7] presented an empirical characterization of the current consumption of actual IEEE802.15.4/Zigbee under different operations and provided the analytical performance models. The presented results were based on the measurement of the current drained from the sensor mote during several phases namely start-up, when associating with the coordinator, during packet transmission, during the loss of connection and sleep mode. The experiment was performed on eZ430-RF2480 Kit by Texas instrument and repeated using Texas Instruments CC2520 [51] and the Freescale MC1322x platform.
The work in [7] was extended by [58] by providing the current consumption on one duty cycle that consists of current consumption during start-up, an association of sensor motes to a coordinator, packet transmission, and loss of connection and during sleep mode. The paper also presented the analytical model to predict the maximum, minimum and the expected battery life for a short distance that is less than 50cm between the coordinator node and the sensor mote.
In this paper, we further extend the work to cover a longer distance of communication between the coordinator and the sensor nodes and increase the packet size to capture a more realistic application in indoor and outdoor deployments. This is because most outdoor Zigbee applications [22-26] implement a coordinator node placed at a longer distance between the sensor nodes. The experiment is performed using 15 bytes of a data packet for ten times continuously in indoor and outdoor environments. The data transmission between the coordinator and sensor nodes is observed on the bright sunny day at 143 m on Application programming interface (API) mode and 230 m on (Transparent Mode) AT mode. The voltage of the battery is measured after each 150 data packets is sent.
C. Hardware for 802.15.4b/Zigbee
voltage measurements are taken with a different type of communication modes as shown in Table I.
TABLEI ENVIRONMENT SCENARIO
The distance between source and coordinator (m)
Environment
Indoor Outdoor Obstacles
38 AT API - API No
42 - API - - No
143 - - - API No
230 - - AT - Yes (some
trees)
1) Sensors: There are two sensors used for measurements which are temperature and soil moisture sensors. The temperature sensor also provides two types of measurements, which are temperature (Celsius) and humidity (percentage). The soil moisture sensor is placed into the soil to measure water content in the soils.
2) Microcontrollers: The microcontroller contains memory, programmable peripherals and a processor. In this project, Arduino UNO [52] is used and based on ATmega 328P. There are six analog inputs in the Arduino UNO where pin A0 is set for temperature sensor while pin A1 is set for soil moisture sensor.
3) Wireless Communication Module: Wireless communication device used in this project is XBee series 2 (S2). This device uses radio frequency of 2.4GHz for data transmission [53]. The baud rate of 115200 is set for the XBee using XCTU software from Digi [54].
4) Anemometer: Anemometer is a standalone digital device to measure air velocity and temperature during the test [55] for every 150 packets sent. The unit is used to measure the air velocity in meter per second (m/s) with ±5% accurate while the temperature unit is in Celsius (oC) with ±2 accurate.
5) Battery: Another important part of this battery measurement setup is the battery itself. LiPo rechargeable battery GE Power 900mAh 20C [56] is used where its voltage is measured to transmit a set of data.
Wireless communication
Wireless
communication Application Microcontroller
Sensors
Send data to Connected to Send data to Connected to B A
Source node Coordinator node
d
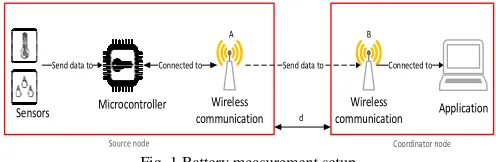
Fig. 1 Battery measurement setup
Fig. 1 shows the setup of the battery measurement experiments. The system consists of a set of sensors,
microcontroller, multimeter and Zigbee wireless
communication device. The data transmission happens between a source node and a coordinator node separated by a distance d. First, the temperature sensor reads the air temperature value and the soil moisture sensor reads the moisture level of the soil. These values are then sent to Arduino UNO. The microcontroller attached to the Arduino UNO executes the uploaded programmed code and sends the
data to the XBee, noted as A in Fig. 1. Wireless device XBee (A) transmits the data wirelessly to XBee (B), the coordinator node. Upon receiving the data, Xbee (B) sends the data to the application in the coordinator node. The voltage across the battery is then measured at the source node.
6) Programming Language: In this setup, C programming language is used as it is compatible with Arduino UNO board. Arduino Sketch is one of the applications that is used to write the codes. The baud rate is set to 115200 with as the transmit interval per serial byte sent.
D. Data Transmission
XBee can transfer data in multiple ways, i.e., point-to-point, point-to-multipoint-to-point, and multipoint-to-multipoint transfers. In this paper, the experiment is set to point-to-point data transfer. XBee operates in two kinds of modes which are AT and API modes with this point-to-point transfer.
XBee configured in AT mode transmits data immediately to the other remote XBee identified by the destination address. AT mode is an effortless operation where the XBee module receives wireless data exactly as it is sent. However, in AT mode, the receiver cannot recognize the ID of the source node where it receives the data from.
Unlike AT mode, API mode communicates in a structured interface known as a frame. XBee receiver configured in API mode knows from where the data is coming from because the received packets contain the source address of the sender.
E. Process Before Data Transmission
Before transmitting the data, the node discovery process is needed to discover the source node in the network. For this project, XCTU application installed on the computer connected with the coordinator node executes the node discovery process. The coordinator node scans the node available in the network. Once the other node is found, the connection between the source node and coordinator node is established. The node discovery process shows the connec*tion quality from very strong, strong, moderate or weak. The node discovery process is only applicable for API mode. This is because, in AT mode, nodes are configured to know each other’s destination address
F. Data Packet
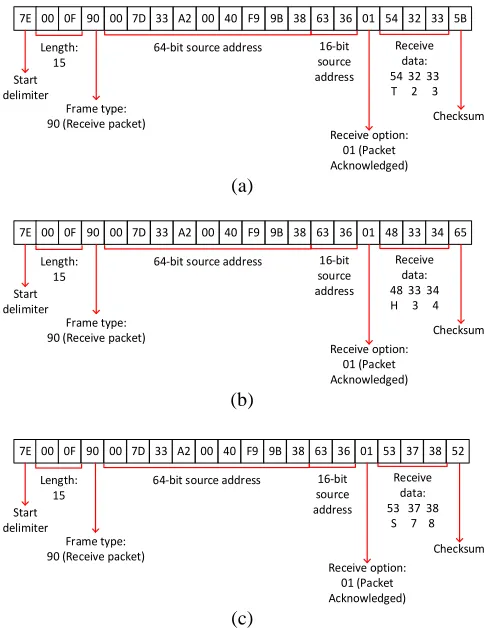
In AT mode, the receiver gets everything precisely the same as what the sender transmits. Unlike AT mode, API mode needs a data packet with the structured frame to send and receive data. The received frame structured regarding hexadecimal number is shown as in fig. 2.
1) Start Delimiter: The start delimiter is the first byte of a frame. This start delimiter indicates the beginning of a data packet which is 0x7E. The value of 0x7E in the frame enable the application to check for a new arriving frame. Fig. 2(a) to fig. 2(c) show the starting value of the frame is 0x7E for temperature, humidity, and soil moisture data packets.
7E 00 0F 90 00 7D 33 A2 00 40 F9 9B 38 63 36 01 54 32 33 5B
Start delimiter
Frame type:
90 (Receive packet) Checksum
Receive option: 01 (Packet Acknowledged) Length:
15
64-bit source address 16-bit
source address
Receive data: 54 32 33 T 2 3
(a)
7E 00 0F 90 00 7D 33 A2 00 40 F9 9B 38 63 36 01 48 33 34 65
Start delimiter
Frame type:
90 (Receive packet) Checksum
Receive option: 01 (Packet Acknowledged) Length:
15
64-bit source address 16-bit
source address
Receive data: 48 33 34 H 3 4
(b)
7E 00 0F 90 00 7D 33 A2 00 40 F9 9B 38 63 36 01 53 37 38
Start delimiter
Frame type:
90 (Receive packet) Checksum
Receive option: 01 (Packet Acknowledged)
52
Length: 15
64-bit source address 16-bit
source address
Receive data: 53 37 38
S 7 8
(c)
Fig. 2(a) Temperature data packet; (b). Humidity data packet; (c). Soil moisture data packet
2) Frame Length: Next to the start delimiter bit is the length of the frame. The length field is the total number of bytes in the data frame. This length field has a two-byte value that ignores the start delimiter, the length, and the checksum. Fig. 2(a) to fig. 2(c) show different values because of the different size of the data payload. The length of temperature data packet in fig. 2(a) to fig. 2(c) show that the length of the packet is 15.
3) Frame Data: Next to the length field is the frame data field. The frame data field holds the information whether the device transmits or receives. The frame data field is divided into two which are:
• Frame type: frame type field is the API frame type identifier which determines the type of data for the data packet. Fig. 2(a) to fig. 2(c) indicate the frame type is 0x90 which is for temperature, humidity, and soil moisture data packets.
• Data: data fields consist of 64-bit source address, 16-bit source address, receive option and the data itself. Fig. 2(a) to fig. 2(c) show the same 64-bit source address (0x00 0x7D 0x33 0xA2 0x00 0x40 0xF9 0x98 0x38), 16-bit address (0x63 0x36) and receive option (0x01). Receive option data frame of 0x01 means that the packet is acknowledged. The received data value in fig. 2(a) for temperature data packet is 0x54 0x32 0x33 which represents 23 degrees Celsius. Fig. 2(b) shows the received data for humidity data packet is 0x48 0x33 0x34 which means the percentage of humidity is 34%. Lastly, fig. 2(c) shows the percentage of soil moisture is 78%.
4) Checksum: The last byte in the data packet is the checksum. The checksum is calculated by summing up the API frame before it, excluding the start delimiter and frame length. The frame with the incorrect checksum leads to data being ignored. From fig. 2(a), the checksum for temperature data packet is 0x58. The checksum for humidity data packet in fig. 2(b) is 0x65. Lastly, the checksum for the soil moisture data packet in fig. 2(c) is 0x52.
The testbed includes two important considerations, first the Arduino setup and second, the location and distance selections.
G. Arduino Setup
The source node contains Arduino UNO, XBee, and the two sensors. For the coordinator node (receiver), the XBee module is attached to the laptop with XCTU application. In this test, two persons are required at both the source and coordinator sides. One person manually measures the battery’s voltage using a multimeter.
At the coordinator node, another person informs that the XBee has stopped receiving data via a walkie-talkie. The steps to measure the voltage are as follows:
• The battery voltage is measured at the source node using the multimeter.
• The source node sends 150 data packet to the coordinator node.
• Coordinator receives data through XBee for all 150 data packets
• The voltage drop is calculated by taking the voltage reading before and after transmission at the source node.
• Proses i-iv is repeated for 20 times to get 20 readings.
H. Location and Distance
Location and distance are the important factors to consider in this experiment. It is essential to choose the right location because XBee communication works with line of sight. This means there should not be any trees, buildings or moving vehicles between the transmitter and the receiver. Therefore, a stadium and a car park are the two places selected to run the outdoor test. An empty university hall and faculty laboratory hallway are the venues for the indoor test.
For the stadium set up, the source node is located in an open stadium field whereas the coordinator node is stationed in the stadium. The coordinator node view is facing the source node on a slightly higher position. The distance between two points is measured to be 143 m. The additional experiment is performed at two other different locations further from the stadium which is 230 m distance apart with some trees in between.
III.RESULTS AND DISCUSSION
A. AT to AT Mode
B. API to API Mode
API to API Mode means that the XBee’s are configured with API mode for both source and coordinator nodes. The API-mode source node with temperature and soil moisture sensor sends the data to the coordinator node configured with API mode. Fig. 3 shows the data received from the source node. Different from AT mode, the received data in API mode is a structured packet that starts with 7E as the starter of the frame shown in XCTU
Fig. 3 Coordinator Node configured with API mode received data shown in XCTU
C. Battery Voltage Measurement
The experiment is conducted to obtain how many transmission of data packets can be performed before the battery drops to a level where it is not able to send any more data packet. Fig. 4 below shows the transmission of 15 bytes of data continuously for ten times.
15 bytes data sent
15 bytes data sent
15 bytes data sent
10 times
15 bytes data sent
15 bytes data sent
15 bytes data sent
repeat until battery voltrage drop and cannot sent data Fig. 4 15 bytes data sent continuously
Fig. 5 shows the voltage measurements for API mode for the indoor environment at 42 m apart from source to the coordinator node.
Fig.5 API-API mode 42 m, indoor.
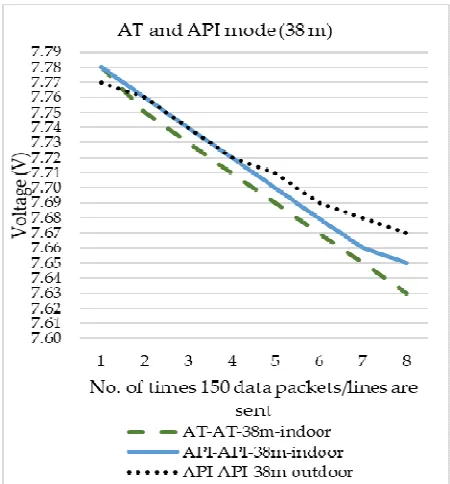
Fig. 6 shows that there is a more considerable voltage drop for both AT and API mode in both indoor and outdoor environments for the first six times of sending data packets. This might due to the time required to stabilize the wireless devices. The readings become stable afterward. This result shows that the mode of communication does not give a big impact to voltage since in both modes the average voltage drop is between 0.027 V and 0.016 V.
Fig. 6 AT and API mode 38 m, indoor and outdoor
Fig. 7 shows voltage measurement versus the number of times 150 data lines and 150 data packets are sent for AT and API modes at a distance 38 m away between the source node and coordinator node. It is observed that the voltage drops for AT to AT mode and API to API mode has the same linearly decreasing pattern. We can deduce that the voltage drop is not affected by the communication mode but due to data transmission. This conclusion is true for short-range communication coverage.
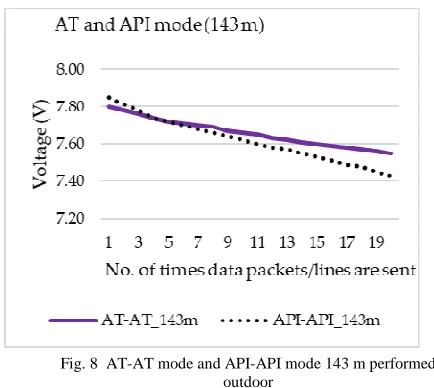
Fig. 8 is plotted for the experiment performed at a distance of 143 m between source and coordinator nodes. The wind velocity also is measured to investigate their effects on packet and voltage. The graph shows AT mode has a small voltage drop as compared to API mode. This is due to AT mode that sends the raw data without the packet frame. The experimental results are used for battery life estimation in term of a number of times transmissions can be done before the minimum operating voltage required for Xbee to transmit data is reached.
Fig. 8 AT-AT mode and API-API mode 143 m performed outdoor
Fig. 9 shows the experimental results for AT mode performed at 230 m with some trees in between. This plot also shows that the packet can be received with a few obstacles.
Fig. 9 AT-AT mode 230 m performed outdoor
D. Packet Drop
The experiment for the outdoor scenario is performed on a sunny day between 9 am to 2 p.m. for 38 m and 143 m distances. We observe the packet drops significantly in an outdoor environment. For a distance of 38m, the worst-case scenario is when the number of packets received is 141 as shown in Table II. For a distance of 143m, the worse case scenario is when the number of packets received is 109 as shown in Table III. We observe that vehicle movement and the wind speed might cause the packet drops. However, the results are not conclusive, and further experiment on wind must be carried out to determine whether it might influence the number of packet drops. Equation (1) is used to get the percentage of packet delivery ratio for both 141, and 109 packets received.
Packet delivery ratio = ((Data sent - Data received)/ Data
sent) *100 (1)
Packet delivery ratio =
% 6 100 150
141 150
= × −
(2)
Packet drop by 38 m is 6% while the packet drop worsens at a longer distance (143 m) where packet drop becomes 27.3%.
E. Battery Lifetime Estimation
In this paper, the battery lifetime estimation is based on the number of data transmission performed. We consider this during the data transmission as it is the major contribution in voltage drop while assuming other factors, such as microcontroller processing or sleep mode as negligible [57]. The voltage drop (Vdrop) for transmitting 1 data packet is given in equation (3):
150
avedrop drop
V
V
=
(3)
Eavesdrop is the average voltage drop for sending 150 data packets. Thus, the number of transmissions can be calculated as in equation (4):
150
min
×
−
=
avedrop operate init
num
V
V
V
on
Transmissi
(4)Where Transmission num is the number of transmissions can be performed, Vinit is the initial battery voltage, Vminoperate is the minimum operational battery for Xbee module to transmit data, which is specified to be between 2.1 - 3.6 V [53].
From the experiment, taking the average voltage drop = 0.0175 ~0.02 V, Vminoperate = 2.1 V and Vinit = 7.85 V as tabulated in Table III for API mode, we can calculate the number of transmission of the data packet until the minimum operational battery is reached as shown in equation (5).
43125
150
02
.
0
1
.
2
85
.
7
=
×
−
=
num
on
Transmissi
(5)Each API data packet consists of 15 bytes. This value gives an estimation of the battery life for any wireless device on the Xbee module. From (5), the value indicates for 15 bytes data packet; the battery can last for 43125 number of transmissions.
IV.CONCLUSION
ACKNOWLEDGMENT
This research are funded by Universiti Kebangsaan Malaysia (UKM) research project GGPM-2016-011, GGPM-2017-102 and GGPM_2017_021 under the Network
and Communication Technology Research Lab, Research Centre for Software Technology and Management
(SOFTAM), www.ftsm.ukm.my/softam, Faculty of
Information Science and Technology, and Institute of Microengineering and Nanotechnology.
TABLEII
AVERAGE VOLTAGE DROP PER 150 DATA PACKETS SENT
No of times 150 data packets/ lines ares sent
API_API_38 m_indoor API_API_38 m_outdoor AT_AT_38 m_indoor
Voltage drop Data Packet Voltage drop Data Packet Voltage drop Data Packet
1 0.04 150 0.02 150 0.03 150
2 0.05 150 0.01 150 0.02 150
3 0.03 148 0.01 150 0.02 150
4 0.04 150 0.02 150 0.02 150
5 0.05 150 0.02 150 0,02 150
6 0.03 150 0.03 144 0.02 150
7 0.03 150 0.02 148 0.02 150
8 0.03 150 0.02 143 0.01 150
9 0.02 150 0.02 150 0.02 150
10 0.02 150 0.02 147 0.01 150
11 0.03 150 0.02 141 0.01 150
12 0.02 150 0.03 150 0.02 150
13 0.02 150 0.01 148 0.01 150
14 0.02 150 0.02 145 0.01 150
15 0.02 150 0.02 150 0.02 150
16 0.02 150 0.01 149 0.01 150
17 0.02 150 0.02 150 0.01 150
18 0,01 150 0.01 150 0.01 150
19 0.02 150 0.01 150 0.01 150
20 0.01 150 0.01 150 0.01 150
Average 0.0265 0.075 0.016
TABLEIII
VOLTAGE MEASUREMENT FOR APIMODE (143 M) No of times
150 data packets/ lines ares sent
Voltage Drop Received Data Packet
Temperature (oC)
Humidity (%) Soil Moisture (%)
Observed Wind Velocity (m/s)
Anemometer- Temperature (min, max)
1 7.85 150 36 68 69 0 32.7, 36.0
2 7.81 150 37 54 69 0 36.0, 38.3
3 7.78 150 36 68 70 0 40.4, 40.6
4 7.74 148 36 57 69 1.5 37.4, 39.5
5 7.72 150 42 49 69 1.6, 1.8 34.7, 37.4
6 7.7 150 43 41 69 1.1 34.6, 39.8
7 7.68 150 43 38 68 1.2 35.1, 39.8
8 7.66 150 34 56 68 0 34.0, 34.2
9 7.64 150 37 58 68 0 34.2, 34.5
10 7.62 149 37 57 69 1.4, 1.6 32.0, 32.2
11 7.6 109 35 56 68 1.7, 0.8 32.2, 32.8
12 7.58 150 35 55 68 0 32.8, 32.9
13 7.57 150 35 56 67 0 33.7, 33.6
14 7.55 150 35 55 67 0 33.4, 34.9
15 7.53 150 35 58 68 2.0, 1.1 33.3, 34.3
16 7.51 150 41 50 76 1.6, 1.3 32.6, 32.7
17 7.49 150 36 55 73 2 33.0, 34.1
18 7.48 150 37 57 72 1.5, 1.1 32.9, 34.0
19 7.45 134 35 56 72 2.2, 2.0 35.7, 41.6
REFERENCES
[1] M. A. Mahmood, W. K. G. Seah, I. Welch, “Reliability in Wireless Sensor Networks: A survey and challenges ahead” 2015, Computer Networks, Vol 79, pp 166-187.
[2] D. P. Dahnil, Y. P. Singh and C. K. Ho, “Topology-Controlled adaptive clustering for uniformity and increased lifetime in wireless sensor networks,” IET Wireless Sensor Systems, 2012, vol. 2, no. 4, pp. 318-327
[3] W. Dargie and C. Poellabauer, Fundamental of Wireless Sensor Networks: Theory and Practice. West Sussex, UK: John Wiley & Sons, 2010, pp. 3-16.
[4] S. N. More and M Nighot, “A review of wireless sensor network for agriculture,” International Journal on Recent and Innovation Trend in Computing and Communication, 2016, vol. 4, no. 6, pp.4 -7. [5] Institute of Electrical and Electronics Engineers, Inc., IEEE Std.
802.15.4. 2003, Wireless Medium Access Control (MAC) and Physical Layer (PHY) Specifications for Low Rate Wireless Personal Area Networks (LR-WPANs).
[6] H. Zawia, R. Hassan, D. P. Dahnil, “Enhancement of real-time application IEEE 802.11e using dynamics contention windows approach,” Advanced Science Letter, vol. 22, no. 8, pp. 1874-1881, August 2016
[7] E. Casilari, G. Campos-Garrido and J. M. Cano-García, “Characterization of battery consumption in 802.15.4/ZigBee sensor motes,” 2010 IEEE International Symposium on Industrial Electronics, pp. 3471-3476, November 2010.
[8] S. Malge, K. Bhole, “Novel, low cost remotely operated smart irrigation system” In International Conference on Industrial Instrumentation and Control (ICIC), 2015, 1501-1505.
[9] J.T Devaraju, K.R. Suhas, H.K. Mohana, V.A. Patil, “ Wireless Portable Microcontroller based weather monitoring station” Measurement, 2016, Vol 76, pp 189-200.
[10] F. Aliyu, M. Garba,, et al., “Hydrogen sulfide (H2S) gas safety system for oil drilling sites using wireless sensor network,” Procedia Computer Science, vol. 64, pp. 499-504, 2015.
[11] X. Lu, P. Wang, D. Niyato, D.I. Kim, Z. Han, “Wireless Networks with RF Energy Harvesting: A Contemporary Survey” IEEE Communications Surveys and Tutorials, 2015, vol 17 (2), 757 -789. [12] T. Ojha, S. Misra, N. S. Raghuwanshi, “Wireless sensor networks for
agriculture: the state-of-the-art in practice and future challenges,”
Computers and Electronics in Agriculture, vol. 118, pp. 66-84,
October 2015
[13] S. A. Nikolidakis, D. Kandris, D.D. Vergados, “Energy efficient automated control of irrigation in agriculture by using wireless sensor networks” 2015, Computers and Electronics in Agriculture, vol 113 pp 154-163.
[14] L. M. Feeney, Towards a Better Battery Model for INET. In 3rd OMNeT++ Community Summit, 2015.
[15] F. Yu and R. Jain, “A Survey of Wireless Sensor Network Simulation Tools,” Washington University in St. Louis, Department of Science and Engineering, April 2011
[16] N. Mukherjee, S. Neogy and S. Roy, Building Wireless Sensor Networks: Theoretical and Practical Perspective. Boca Raton, London New York: CRC Press, 2016, pp. 4-5
[17] Zhang, Z., et al., “Survey on the water-saving agricultural internet of
things based on wireless sensor network” International Journal of
Control and Automation, 2015. 8(4): p. 229-240
[18] D. Pašalić, D. Bundalo, Z. Bundalo and B. Cvijić, “ZigBee-based data transmission and monitoring wireless smart sensor network integrated with the Internet,” 2015 4th Mediterranean Conference on Embedded Computing (MECO), Budva, pp. 240-243, June 2015 [19] A. Augustin, J. Yi, T. Clausen, and W. M. Townsley, “A study of
LoRa: long range & low power networks for the internet of things,”
Sensors, vol. 16, no. 9, pp. 1466 September 2016,
[20] Y. B. Shi, Y. P. Shi, D. B. Xiu, X. Wang, M. M. Wang, R. X. Wang, “Design of wireless sensor system for the agricultural micro environment based on wifi,” Applied Mechanics and Materials, vol. 303-306, pp. 215-222, February 2013,
[21] J. Petäjäjärvi, K. Mikhaylov, M. Hämäläinen and J. Iinatti, “Evaluation of LoRa LPWAN technology for remote health and wellbeing monitoring,” 2016 10th International Symposium on
Medical Information and Communication Technology (ISMICT),
Worcester, MA, pp. 1-5. June 2016,
[22] P.B. Chikankar, D.Mehetre, S. Das, “An automatic irrigation system using ZigBee in wireless sensor network.” In International Conference on Pervasive Computing (ICPC), 1-5, 2015.
[23] S. A. Hussein, and D. P. Dahnil, “A new hybrid technique to improve the path in reducing energy consumption in mobile ad-hoc networks,” IJAER, vol. 12, no. 3, pp. 277-282, 2017.
[24] Y. Rao, W.Xu. J.Zhu, Z. Jiang, R. Wang, S. Li, “Practical deployment of an in-field wireless sensor network in date palm orchard,” International Journal of Distributed Sensor Networks, Vol 13, No 5, May 2017
[25] T. Ojha, S. Misra, N.S. Raghuwanshi, “Wireless sensor Networks for agriculture: The state-of-the-artin practice and future challenges”. Computers and Electronics in Agriculture, 2015, 118, pp 66-84 [26] Liu, Y., et al., “Enterprise-oriented IoT name service for agricultural
product supply chain management.” International Journal of
Distributed Sensor Networks, 2015.
[27] Li, J., M. Guo, and L. Gao, “Application and innovation strategy of
agricultural Internet of Things” Nongye Gongcheng Xuebao/Transactions of the Chinese Society of Agricultural Engineering, 2015. 31, p. 200-209.
[28] Liu, X., “Traceability system design for fruits and vegetables safety
based on internet of things technology” Advance Journal of Food
Science and Technology, 2015. 8(10): p. 711-715
[29] H. Ling and Y. Qiuying, “The application of wireless communication technology in precision agriculture,” Agricultural Science &
Technology And Equipment, pp. 49-53, 2009.
[30] D. P. Dahnil and R. Hassan, “Wireless Sensor Networks: A Framework for Community and Educational Gardens” Advanced Science Letters, 2018, Vol 24 (2), pp 1153-1157.
[31] M. Mawois, C. Aubry, M. Le-Bail, “Can farmers extend their cultivation areas in urban agriculture? a contribution from agronomic analysis of market gardening systems around mahajanga (madagascar),” Land Use Policy, vol. 28, no. 2, pp. 434-445, April 2011.
[32] Dhanekula, H., & Kumar, K. K. “GSM and Web Application based Real-Time Automatic Irrigation System using Raspberry pi 2 and 8051” Indian Journal of Science and Technology, 2016, 9(17). [33] A. J. Garcia-Sanchez, F. Garcia-Sanchez, and J. Garcia-Haro,
“Wireless sensor network deployment for integrating video-surveillance and data-monitoring in precision agriculture over distributed crops,” Computers and Electronics in Agriculture, vol. 75, no. 2, pp. 288-303, February 2011.
[34] C. Goumopoulos, B. O’Flynn and A. Kameas, “Automated zone-specific irrigation with wireless sensor/actuator network and adaptable decision support,” Computers and Electronics in
Agriculture, 2014, vol. 105, pp.20-33.
[35] S. A. H. Z. Abidin and S. N. Ibrahim, “Web-based monitoring of an automated fertigation system: An IoT application,” 2015 IEEE 12th
Malaysia International Conference on Communications (MICC),
Kuching, pp. 1-5, October 2016.
[36] B. B. Bhanu, K. R. Rao, J. V. N. Ramesh and M. A. Hussain, “Agriculture field monitoring and analysis using wireless sensor networks for improving crop production,” 2014 Eleventh
International Conference on Wireless and Optical Communications Networks (WOCN), Vijayawada, pp. 1-7, October 2014.
[37] G. Rezai, M. N. Shamsudin, Z. Mohamed and J. Sharifuddin, “Factor influencing public participation in urban agriculture in malaysia,”
Malay, vol. 256, pp. 40, December 2014.
[38] J. J. Zhou, X. F. Wang, X. Wang, W. Zou, and J. C. Cai, “Greenhouse monitoring and control system based on zigbee,” In
Applied Mechanics and Materials, Trans Tech Publications, vol.
347-350, pp. 768-771, August 2013.
[39] T. Kalaivani, A. Allirani and P. Priya, “A survey on zigbee based wireless sensor networks in agriculture,” 3rd International
Conference on Trendz in Information Sciences & Computing (TISC2011), Chennai, pp. 85-89, March 2012,
[40] M. Hussnain et al., “Investigating multi-topological zigbee based wireless sensor network in precision agriculture,” Journal of Basics
and Applied Scientific Research, vol. 3, no. 2, pp. 195-201, 2013.
[41] I. Lamprinos, M. Charalambides and M. Chouchoulis, “Greenhouse monitoring system based on a wireless sensor network,” 22nd
International Electronic Conference on Sensors and Applications,
November 2015.
[42] G. V. Satyanarayana and S. D. Mazaruddin, “Wireless sensor based remote monitoring system for agriculture using zigbee and gps,”
[43] F. Cuomo, A. Abbagnale and E. Cipollone, “Cross-layer network formation for energy-efficient ieee 802.15.4/zigbee wireless sensor networks,” Ad Hoc Networks, vol. 11, no. 2, pp. 672-686, March 2013.
[44] J. Swetha and B. P. Raveendra, “Zigbee based management system,”
IJESRT, vol. 2, no. 9, pp. 2463-2466, September 2013.
[45] K. Krishnamurthi, S. Thapa, L. Kothari, “Arduino based weather monitoring system”, 2015. International Journal of Engineering Research and General Science, Vol 3, Issue 2, pp 452-458
[46] B. V. Tuijl, E. V. Os, and E. V. Henten, “Wireless sensor networks: state of the art and future perspective,” In International Symposium
on High Technology for Greenhouse System Management: Greensys,
vol. 801, pp. 547-554, October 2007.
[47] D. P. Dahnil, Y. P. Singh, and C. K. Ho, “Topology-controlled adaptive clustering for uniformity and increased lifetime in wireless sensor networks,” IET Wireless Sensor Networks, vol. 2, no. 4, pp. 318-327, December 2012.
[48] J.S. Lee, Y.W. Su, C.C. Shen, “A comparative study of wireless protocols: Bluetooth, UWB, ZigBee, and Wi-Fi,” In Proceedings of 33rd Annual Conference of the IEEE Industrial Electronics Society (IECON), Taipei, Taiwan, 2007, pp. 46-51
[49] K. Shuaib, M. Alnuaimi, M. Boulmalf, I. Jawhar, F. Sallabi, A. Lakas, “Performance evaluation of IEEE 802.15.4: experimental and simulation results” J. Commun. 2007, 2, pp. 29-37
[50] M. Petrova, J. Riihijarvi, P. Mahonen, S. Labella, “Performance study of IEEE 802.15. 4 using measurements and simulations” In Wireless communications and networking conference, 2006, 1, pp. 487-492.
[51] Texas Instruments, CC2520 (Second generation 2.4 GHz ZigBee/IEEE 802.15.4 RF transceiver). Available online: http://focus.ti.com/docs/prod/folders/print/cc2520.html (accessed on 28 January 2010).
[52] Arduino UNO. https://www.arduino.cc/en/Main/ArduinoBoardUno, accessed 16 January 2017
[53] XBee Datasheet. 2017.
https://www.sparkfun.com/datasheets/Wireless/Zigbee/XBee-Datasheet.pdf.
[54] XCTU. 2017 https://www.digi.com/products/xbee-rf-solutions/xctu-software/xctu.
[55] Anemometer BENETECH GM816. 2017.
http://mikroelectron.com/Product/BENETECH-GM816-Mini-Digital-Anemometer-Wind-Speed-Temperature-Tester/.
[56] GE Power RC PACK 900mAh Battery. 2017. http://www.dx.com/p/ge-power-900-11-1v-900mah-25c-li-ion-battery-pack-for-r-c-helicopter-black-217458#.WL-0zjt97IU. [57] W. B. Heinzelman, A. P. Chandrakasan, H. Balakrishnan, “An
application-specific protocol architecture for wireless microsensor networks,” IEEE Transaction on Wireless Communication 2002, 1, (4), pp. 660-670