Research Article
Genotype x Environment interaction for yield and yield contributing
traits in
Rabi
Sorghum
S. A. Anarase1*, R.T. Desai2, G. B. Chaudhari3, A. B. Patil4 and Y.G.Ban5
1,5Department of Botany, Mahatma Phule Krishi Vidyapeeth, Rahuri-413 722
2Navsari Agricultural University, Navsari-396 450. (Gujarat)
3
Oilseeds Research Station, MPKV, Jalgaon
4Ankur Seeds, Nagpur.
* E-mail: [email protected]
(Received:04 Mar 2015; Accepted:14 July 2015)
Abstract
The analysis of variance for phenotypic stability revealed that the variation due to genotype x environment was considerable for all the characters studied. The significance of G x E (linear) and pooled deviation for majority of the traits suggested the importance of both linear and non-linear components in determining total genotype x environment interactions. Perusal of stability parameters revealed that eight parents were found to be average stable for grain yield. Nevertheless, it was noticed that the male parent RSV 1460 and RPOSV 3 exhibited bi value significantly greater than one, showed below average stability, which was suitable for favourable environments. Among hybrids twenty five hybrids exhibited high mean, unit regression (bi) and least deviation from regression (S2di) and therefore they were classified as stable with average response to
environments. In general, the hybrids found stable for grain yield also showed stability for two or more component characters, which indicated that the stability of various component traits might be responsible for stability of these hybrids for grain yield per plant. The best three hybrids viz., 1543A x RSV 1297, 1343A x RSV 1200 and 1343A x SPV 1359 were found to have average stability over environments for grain yield per plant with one or more stable yield contributing traits, signifying their potential for commercial exploitation for genetic improvement in rabi sorghum.
Key words:
Genotype x Environment interaction, stability, linear, non-linear
Introduction
Evaluation of genotypes for consistency of performance in different environments is important in plant breeding programmes. The relative performance of genotypes often changes from one environment to another. The occurrence of large genotype x environment interaction poses a major problem of relating phenotypic performance to genetic constitution and makes it difficult to decide which genotypes should be selected. It is important to understand the nature of genotype x environment interaction to make testing and ultimately selection of more efficient genotypes.
Breeding genotype with wider adaptability has been ultimate aim of plant breeders. A variety is desirable for commercial exploitation over a wide range of environment, if adaptability in real sense is due to genetic make up. Although plant breeders have been unable to exploit them fully in breeding programme. This has been due to problems of measuring adaptability or other complexities of natural environments. Eberhart and Russell (1966) defined a stable genotype as one, which produced high mean yield and depicted regression coefficient (bi) around unity and deviations from
regression (S2di) near zero. Present investigation
aimed to study the interaction of 91 genotypes (five male sterile lines, fourteen testers, resultant seventy hybrids and two checks) of rabi sorghum with environments.
Materials and methods
The experimental material comprised of five male sterile lines, fourteen testers, resultant seventy hybrids and two checks of rabi sorghum. The experiment consisted of 91 genotypes was conducted in randomized block design with three replications during rabi 2012-13 at three different locations viz., E1 : College farm, Navsari
Agricultural University, Navsari (Agroclimatic Zone 1- South Gujarat Heavy rainfall zone, annual rainfall 1793mm and semi arid to dry sub humid climatic condition), E2: Main Sorghum Research Station,
Athwa farm, NAU, Surat and E3: Agricultural
Research Station, Achhalia (Agroclimatic Zone 2- South Gujarat, annual rainfall 974mm and semi arid to dry sub humid climatic condition), during rabi
Results and discussion
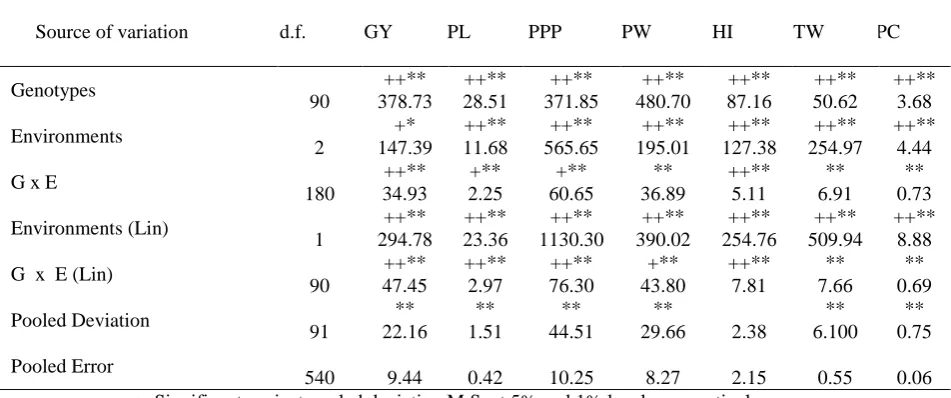
The analysis of variance for phenotypic stability (Table 1) revealed that mean squares due to genotypes as well as environments were highly significant for all the characters when tested against pooled deviation. The genotypes interacted significantly with environments for all the characters when tested against pooled error specifying that the genotypes interacted significantly to diverse environments.
The mean squares due to environments (linear) were highly significant for all the characters when tested against pooled deviation. However, the same was significant for all the characters when tested against pooled error. This indicated that variation among environments was linear and it signifies unit change in environmental index for each unit change in the environmental conditions.
The variances due to G x E were further partitioned in to components (i) G x E (linear) and (ii) G x E (non-linear) i.e. pooled deviation. The coincidence of genotypic performance with environmental values was observed for grain yield, panicle length, primaries per panicle and harvest index an evident from significant genotypes x environments (linear) mean squares when tested against pooled deviations. Although, G x E (linear) was found to be significant for all the characters when tested against pooled error indicating differential performance of genotypes under diverse environments but with considerably varying norms, i.e., the linear sensitivity of different genotypes is variable. The mean squares due to pooled deviations were significant for all the characters except harvest index, which suggested that performance of different genotypes fluctuated significantly from their respective linear path of response to environments.
On comparing relative magnitude of genotype x environment (linear) and pooled deviation from linearity (non-linear), it was found that the linear component was high for grain yield per plant, panicle length, primaries per panicle, panicle weight, and harvest index indicating that linear component contributed more towards the genotype x environment interactions. In case of 1000-grain weight and protein content both linear and non-linear components was almost equal indicating importance of both linear and non linear components in determining genotype x environment interactions for these attributes.
These results were in general, concurring with those of Muppidathi et al. (1995a&b), Narkhede et al. (1998a &b), Muppidathi et al. (1999a&b), Patil
et al. (1991), Shivanna et al. (1992), Das and
Prabhakar (2003), Khandelwal et al. (2005) and Kale (2012).
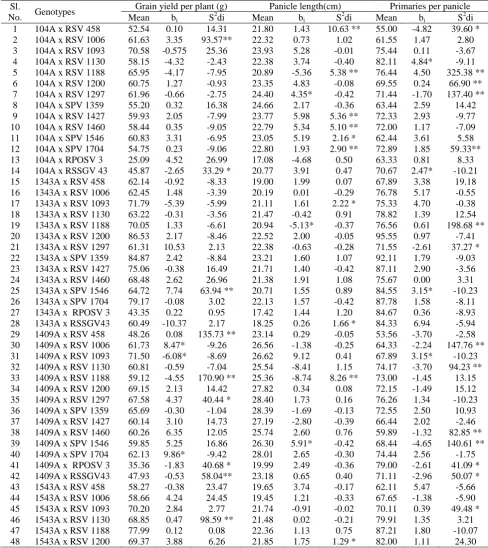
The stability parameters viz., mean performance (X), regression coefficient (bi) and individual squared deviation from linear regression (S2di) for parents as well as hybrids were estimated for seven characters to assess the stability over the environments and are presented in Table 2.1-2.3. Total 91 genotypes were divided in to two groups; first comprising all hybrids with hybrid check CSH 15R and second comprising all parents with varietal check BP 53. Population means of these two groups were estimated separately and used for assessment of stability parameters.
For grain yield per plant significant deviation from regression were exhibited by 12 hybrids and 02 parents, revealing larger contribution of non-linear component is important than linear components towards G x E interaction. Among parents, three females viz., 104A, 1343A and 1543A, eight males and varietal check BP 53 had higher mean than parental mean with bi magnitude not significantly deviating from unity and non-significant deviation from regression, hence they were considered stable for this trait. The male parent RSV 1460 and RPOSV 3 exhibited high mean, bi value significantly greater than unity and non-significant deviation from regression, thus showing below average stability which was suitable for rich environments. Out of 70 hybrids and check (CSH 15R) tested, 25 hybrids exhibited high mean, along with regression coefficient near unity and non-significant deviation from regression and therefore they were classified as stable hybrids. In addition to these stable hybrids, four hybrids 1409A x RSV 1006, 1409 A x RSV 1704, 1543A x SPV 1359 and 1543A x SPV 1546 had high mean, regression coefficient greater than unity and non significant deviation from regression showed specific adaptability for favourable environments. While one hybrid, 1409A x RSV 1093 showed specific adaptability to poor environments for grain yield per plant. The superlative five stable hybrids were 1543A x RSV 1297, 1343A x RSV 1200, 1343A x SPV 1359, 1543A x SPV 1704 and 1543A x RSV 1188.
Among the hybrids, 2 hybrids viz., 1409A x SPV 1546 and 104A x RSV 1297 exhibited high mean, bi value significantly greater than unity and non-significant deviation from regression showing below average stability and were found suitable for rich environments. The superlative five stable hybrids were 1409A x RSV 1297, 1409A x SPV 1704, 1409A x RSV 1200, 1409A x RSV 1460 and 1543A x RSV 1297.
For primaries per panicle the female 1343A along with 4 male parents and check BP 53 were stable as evident from their high mean, unit regression coefficient and non-significant non-linear component. Among the 70 hybrids and check (CSH 15R) tested, 27 hybrids exhibited high mean, along with regression coefficient near unity and non-significant deviation from regression and therefore they were classified as stable hybrids. The superlative five stable hybrids were 1543A x RSV 1297, 1343A x RSV 1200, 1343A x SPV 1359, 1543A x SPV 1704 and 1343A x SPV 1704. The two hybrids 104A x RSV 1130 and 1343A x SPV 1546 showed below average stability which were suitable for rich environments.
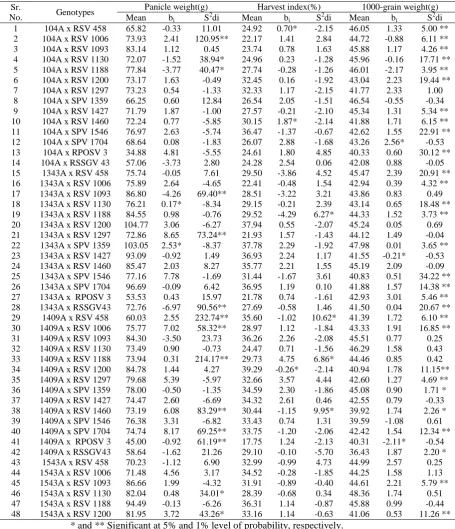
Among parents, one female (1343A), 10 males and check BP 53 had higher mean than parental mean with bi magnitude not significantly deviating from unity and non-significant deviation from regression, were considered stable for panicle weight. Among the hybrids, 23 hybrids exhibited high mean, along with regression coefficient near unity and non-significant deviation from regression and therefore they were classified as stable hybrids. Hybrid, 1543A x RSV 1427 recorded high mean, bi significantly less than unity, exhibited above average response and suitability for poor environments. One hybrid 1343A x SPV 1359 exhibited high mean, bi value significantly greater than unity and non-significant S2di, showing below average stability and suitability for favourable environments. The superior five stable hybrids were 1543A x RSV 1297, 1343A x RSV 1200, 1343A x SPV 1704, 1543A x RSV 1188 and 1543A x SPV 1704.
For harvest index, 4 females, 01 male (RSV 458) and varietal check BP 53 recorded high mean, non significant regression coefficient and non-significant S2di values showing average stability over environments. The male parent RSV 1093 was found suitable for favourable environments. Among 70 hybrids, 30 hybrids had high mean, non significant regression coefficient and non-significant S2di values which indicated their ideal stability over environments. The performance of 4 hybrids (1343 A x RSV 1188, 1409A x RSV 458, 1409A x RSV 1188 and 1409A x RSV 1460) could not be predicted under variable
environments in view of significant S2di values. Three hybrids 1409A x RSV 1200, 1543A xS PV 1359 and 9168A x RSV 1200 exhibited high mean, bi value significantly less than unity and non-significant deviation from regression showed above average stability which were suitable for poor environments, whereas hybrid 104A x RSV 1460 was suitable for rich environment. The best five hybrids among the stable hybrids for this trait were 1343A x RSV 1200, 1343A x SPV 1359, 1543A x SPV 1704, 1543A x RSV 1297 and 1543A x SPV 1704.
As regards to 1000 grain weight, among the parents, 3 male along with check BP 53 had higher mean than parental mean with bi magnitude not significantly deviating from unity and non-significant deviation from regression, hence were considered as stable for this trait. Among all parents RSV 1188 and hybrids cross 9168A x SPV 1546 exhibited high mean, bi value significantly greater than unity and non-significant S2di values, exhibiting below average stability which was suitable for rich environments, while male SPV 1704 has exhibited above average stability for this trait. Performance of 16 hybrid, 6 testers and 1 female was unpredictable behaviour due to high mean bi around unity and S2di significantly deviating from zero. Out of 70 hybrids and check (CSH 15R) tested, 14 hybrids exhibited high mean, along with regression coefficient near unity and non-significant deviation from regression and therefore they were classified as stable hybrids. The superlative three stable hybrids were 1543A x RSV 1188, 1543A x RSV 1297 and 1343A x RSV 1200.
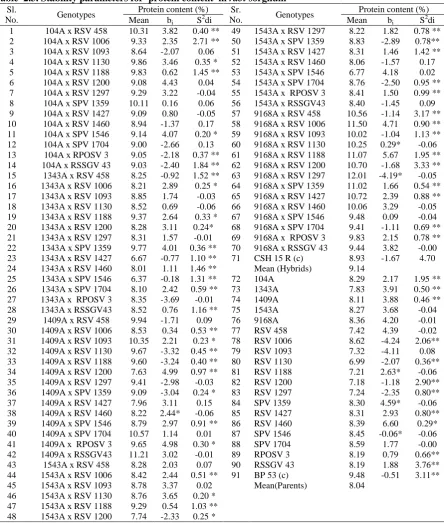
For protein content, females 1543A and 9168A along with one male parent SPV 1704 had higher mean than parental mean, bi magnitude not significantly deviating from one and non-significant deviation from regression, hence were considered stable for this trait. Among the males, SPV 1546 and among crosses, 9168A x RSV 1130 and 9168A x RSV 1297 exhibited bi value significantly less than one, showing above average stability which were suitable for poor environments. Among the hybrid group, 9 hybrids exhibited high mean, along with regression coefficient near unity and non-significant deviation from regression and therefore they were classified as stable hybrids. Performance of 20 hybrids was unpredictable due to high mean bi around unity and S2di value significantly deviating from zero. The superlative five stable hybrids were 1409 A x RSSGV 43, 1409A x SPV 1704, 104A x SPV 1359, 9168A x RSV 1460 and 1409A x RSV 458.
checks), it was revealed that none of the genotype was found stable for all the traits. Any generalization regarding stability of genotypes for all the characters was therefore not possible. Among these genotypes, 25 hybrids exhibited unit regression (bi) and least deviation from regression
(S2di) and therefore they were classified as stable
with average response to environments. Perusal of stability parameters further revealed that 8 parents were found to be stable for grain yield for all the environments. In general, the female and male parents behaved differently in different environments as observed by Patel et al. (1984). However, it was noticed that the male parent RSV 1460 and RPOSV 3 exhibited bi value significantly greater than one, showed below average stability and suitability for rich environments for grain yield per plant. Instances where a few true breeding varieties were comparable in yield to hybrids under favorable environmental conditions have been reported by Rao and Harinarayana (1969) and Singhania & Rao (1976).
The heterozygous entries (hybrids) were in general, slightly more stable than the homozygous ones (parents), but the wide ranges found within both the parents and hybrids for stability parameters indicated that it should be possible to select stable entries at both levels of genetic structure. These results corroborated with the findings of Reich and Atkins (1970), Majisu and Dogget (1972), Patanothai and Atkins (1974), Rao
et al. (1981), Patel et al. (1984), Haussmann et al.
(2000) and Kale (2012).
From the stability analysis, it could be seen that the best three stable hybrids for grain yield per plant were 1543A x RSV 1297, 1343A x RSV 1200, 1343A x SPV 1359. In general, the hybrids found stable for grain yield also showed stability for two or more component characters, which indicated that the stability of various component traits might be responsible for the observed stability of various hybrids for grain yield per plant. In the present investigation, the best three hybrids viz., 1543A x RSV 1297, 1343A x RSV 1200, 1343A x SPV 1359 were found to have average stability over environments for grain yield per plant with one or more stable yield contributing traits, signifying their potential for commercial exploitation for genetic improvement in rabi sorghum.
Acknowledgement
Authors are thankful to Senior Sorghum Breeder, Sorghum Improvement Project, Mahatma Phule Krishi Vidyapeeth, Rahuri (M.S.) for supply of breeding material.
References
Eberhart, S.A. and Russell, W.A. (1966). Stability parameters for comparing varieties.
Crop Sci., 6: 36-40.
Das, I . K . and Prabhakar (2003). Identification of stable morphological and anatomical charcters of sorghum [Sorghum bicolor (L.) Moench] stalk. Indian J. Genet., 63 ( 4 ) : 347-348.
Haussmann, B.I.G., Obilana, A.B., Ayiecho, P.O., Blum, A., Schipprack, W. and Geiger, H.H. (2000). Yield and yield stability of four population types of grain sorghum in a semi-arid area of Kenya. Crop Sci., 4 0: 3 1 9 - 3 2 9 .
Kale, B.H. (2012). Genetic and stability analysis for yield and yield contributing traits over different seasons in sorghum [Sorghum bicolor (L.) Moench]. Unpublished Ph.D. Thesis, Navsari Agricultural University, Navsari.
Khandelwal, V., Sharma, V. and Singh, D. (2005). Stability for grain yield in sorghum [Sorghum bicolor (L.) Moench]. Indian J. Genet., 65 (1): 53-54.
Majisu, B.N. and Doggett, H. (1972). The yield stability of sorghum varieties and hybrids in East African environments. East Afric. Forest. J.: 179-192.
Muppidathi, N., Paramasivam, K.S., Sivasamy, N., Rajarathinam, S. and Sevagaperumal, S. (1999a). Phenotypic stability for grain yeild and its component traits in sorghum. Madras Agric. J., 86 (1-3): 134-138.
Muppidathi, N., Paramasivam, K.S., Sivasamy, N., Rajarathinam, S., Ramalingam, A. and Ravikasevan, R. (1999b). Stability analysis for grain
yield and its components in grain sorghum. Madras Agric. J., 86 (4-6): 242-246.
Muppidathi, N., Subbaraman, N. and Muthuvel, P. (1995b). Genotypic stability for panicle characters in grain sorghum [Sorghum bicolor (L.) Moench]. Madras agric. J.,
82 (1): 21-24.
Muppidathi, N., Subbaraman, N., Muthuvel, P. and Rajarathinam, S. (1995a). Phenotypic stability for yield and its components in grain sorghum. Madras Agric. J., 82 (1): 18-21.
Narkhede, B.N., Shinde, M.S. and Patil, S.P. (1998a). Stability performance of sorghum varieties for grain and
fodder yields. J. Maharashtra Agric. Univ., 22(2): 179-181.
Narkhede, B.N., Shinde, M.S. and Patil, S.P. (1998b). Stability analysis in kharif sorghum hybrids. J. Maharashtra Agric. Univ., 22 (3): 299-301.
Patanothai, A. and Atkins, R.E. (1974). Yield stability of single crosses and three-way hybrids of grain sorghum. Crop Sci., 14: 287-290. Patil, H.S., Narkhede, B.N. and Bapat, D.R. (1991).
Patel, R.H., Desai, K.B, Doshi, S.P. and Desai, D.T. (1984). Phenotypic stability for panicle characters in grain sorghum. Indian J. Agric.Sci., 54 (7): 530-534.
Rao, N.G.P. and Harinarayana, G. (1969). Phenotypic stability of hybrids and varieties in grain sorghum. Curr. Sci., 38: 97-98.
Rao, N.G.P., Rana, B.S., Jagmohan Rao, V. and Reddy, B.(1981).Sorghum and their performance.
Indian J. Genet., 41: 213-219.
Reich, V.H. and Atkins, R.E. (1970). Yield stability of four population types of grain sorghum,
Sorghum bicolor (L.) Moench, in different environments. Crop Sci., 10: 511-517.
Table 1. Analysis of variance (mean square) for phenotypic stability for different characters in rabi
sorghum
Source of variation d.f. GY PL PPP PW HI TW PC
Genotypes
90
++** 378.73
++** 28.51
++** 371.85
++** 480.70
++** 87.16
++** 50.62
++** 3.68
Environments
2
+* 147.39
++** 11.68
++** 565.65
++** 195.01
++** 127.38
++** 254.97
++** 4.44
G x E
180
++** 34.93
+** 2.25
+** 60.65
** 36.89
++** 5.11
** 6.91
** 0.73
Environments (Lin)
1
++** 294.78
++** 23.36
++** 1130.30
++** 390.02
++** 254.76
++** 509.94
++** 8.88
G x E (Lin)
90
++** 47.45
++** 2.97
++** 76.30
+** 43.80
++** 7.81
** 7.66
** 0.69
Pooled Deviation
91
** 22.16
** 1.51
** 44.51
**
29.66 2.38
** 6.100
** 0.75
Pooled Error
540 9.44 0.42 10.25 8.27 2.15 0.55 0.06
+, ++ : Significant against pooled deviation M.S. at 5% and 1% levels, respectively. *, ** : Significant against pooled error M.S. at 5% and 1% levels, respectively.
GY : Grain yield per plant (g) PL : Panicle length (cm) PPP : Primaries per panicle PW : Panicle weight (g) HI : Harvest Index (%) TW : 1000-grain weight (g) PC : Protein content(%)
Table 2.1 Stability parameters for grain yield per plant, panicle length and primaries per panicle in rabi sorghum
Sl.
No. Genotypes
Grain yield per plant (g) Panicle length(cm) Primaries per panicle
Mean bi S
2
di Mean bi S
2
di Mean bi S
2
di
1 104A x RSV 458 52.54 0.10 14.31 21.80 1.43 10.63 ** 55.00 -4.82 39.60 *
2 104A x RSV 1006 61.63 3.35 93.57** 22.32 0.73 1.02 61.55 1.47 2.80
3 104A x RSV 1093 70.58 -0.575 25.36 23.93 5.28 -0.01 75.44 0.11 -3.67
4 104A x RSV 1130 58.15 -4.32 -2.43 22.38 3.74 -0.40 82.11 4.84* -9.11
5 104A x RSV 1188 65.95 -4.17 -7.95 20.89 -5.36 5.38 ** 76.44 4.50 325.38 **
6 104A x RSV 1200 60.75 1.27 -0.93 23.35 4.83 -0.08 69.55 0.24 66.90 **
7 104A x RSV 1297 61.96 -0.66 -2.75 24.40 4.35* -0.42 71.44 -1.70 137.40 **
8 104A x SPV 1359 55.20 0.32 16.38 24.66 2.17 -0.36 63.44 2.59 14.42
9 104A x RSV 1427 59.93 2.05 -7.99 23.77 5.98 5.36 ** 72.33 2.93 -9.77
10 104A x RSV 1460 58.44 0.35 -9.05 22.79 5.34 5.10 ** 72.00 1.17 -7.09
11 104A x SPV 1546 60.83 3.31 -6.95 23.05 5.19 2.16 * 62.44 3.61 5.58
12 104A x SPV 1704 54.75 0.23 -9.06 22.80 1.93 2.90 ** 72.89 1.85 59.33**
13 104A x RPOSV 3 25.09 4.52 26.99 17.08 -4.68 0.50 63.33 0.81 8.33
14 104A x RSSGV 43 45.87 -2.65 33.29 * 20.77 3.91 0.47 70.67 2.47* -10.21
15 1343A x RSV 458 62.14 -0.92 -8.33 19.00 1.99 0.07 67.89 3.38 19.18
16 1343A x RSV 1006 62.45 1.48 -3.39 20.19 0.01 -0.29 76.78 5.17 -0.55
17 1343A x RSV 1093 71.79 -5.39 -5.99 21.11 1.61 2.22 * 75.33 4.70 -0.38
18 1343A x RSV 1130 63.22 -0.31 -3.56 21.47 -0.42 0.91 78.82 1.39 12.54
19 1343A x RSV 1188 70.05 1.33 -6.61 20.94 -5.13* -0.37 76.56 0.61 198.68 **
20 1343A x RSV 1200 86.53 2.17 -8.46 22.52 2.00 -0.05 95.55 0.97 -7.41
21 1343A x RSV 1297 61.31 10.53 2.13 22.38 -0.63 -0.28 71.55 -2.61 37.27 *
22 1343A x SPV 1359 84.87 2.42 -8.84 23.21 1.60 1.07 92.11 1.79 -9.03
23 1343A x RSV 1427 75.06 -0.38 16.49 21.71 1.40 -0.42 87.11 2.90 -3.56
24 1343A x RSV 1460 68.48 2.62 26.96 21.38 1.91 1.08 75.67 0.00 3.31
25 1343A x SPV 1546 64.72 7.74 63.94 ** 20.71 1.55 0.89 84.55 3.15* -10.23
26 1343A x SPV 1704 79.17 -0.08 3.02 22.13 1.57 -0.42 87.78 1.58 -8.11
27 1343A x RPOSV 3 43.35 0.22 0.95 17.42 1.44 1.20 84.67 0.36 -8.93
28 1343A x RSSGV43 60.49 -10.37 2.17 18.25 0.26 1.66 * 84.33 6.94 -5.94
29 1409A x RSV 458 48.26 0.08 135.73 ** 23.14 0.29 -0.05 53.56 -3.70 -2.58
30 1409A x RSV 1006 61.73 8.47* -9.26 26.56 -1.38 -0.25 64.33 -2.24 147.76 **
31 1409A x RSV 1093 71.50 -6.08* -8.69 26.62 9.12 0.41 67.89 3.15* -10.23
32 1409A x RSV 1130 60.81 -0.59 -7.04 25.54 -8.41 1.15 74.17 -3.70 94.23 **
33 1409A x RSV 1188 59.12 -4.55 170.90 ** 25.36 -8.74 8.26 ** 73.00 -1.45 13.15
34 1409A x RSV 1200 69.15 2.13 14.42 27.82 0.34 0.08 72.15 -1.49 15.12
35 1409A x RSV 1297 67.58 4.37 40.44 * 28.40 1.73 0.16 76.26 1.34 -10.23
36 1409A x SPV 1359 65.69 -0.30 -1.04 28.39 -1.69 -0.13 72.55 2.50 10.93
37 1409A x RSV 1427 60.14 3.10 14.73 27.19 -2.80 -0.39 66.44 2.02 -2.46
38 1409A x RSV 1460 60.26 6.35 12.05 25.74 2.60 0.76 59.89 -1.32 82.85 **
39 1409A x SPV 1546 59.85 5.25 16.86 26.30 5.91* -0.42 68.44 -4.65 140.61 **
40 1409A x SPV 1704 62.13 9.86* -9.42 28.01 2.65 -0.30 74.44 2.56 -1.75
41 1409A x RPOSV 3 35.36 -1.83 40.68 * 19.99 2.49 -0.36 79.00 -2.61 41.09 *
42 1409A x RSSGV43 47.93 -0.53 58.04** 23.18 0.65 0.40 71.11 -2.96 50.07 *
43 1543A x RSV 458 58.27 -0.38 23.47 19.65 3.74 -0.17 62.11 5.47 -5.66
44 1543A x RSV 1006 58.66 4.24 24.45 19.45 1.21 -0.33 67.65 -1.38 -5.90
45 1543A x RSV 1093 70.20 2.84 2.77 21.74 -0.91 -0.02 70.11 0.39 49.48 *
46 1543A x RSV 1130 68.85 0.47 98.59 ** 21.48 0.02 -0.21 79.91 1.35 3.21
47 1543A x RSV 1188 77.99 0.12 0.08 22.36 1.13 0.75 87.21 1.80 -10.07
48 1543A x RSV 1200 69.37 3.88 6.26 21.85 1.75 1.29 * 82.00 1.11 24.30
Table 2.1 Contd… Sl.
No. Genotypes
Grain yield per plant (g) Panicle length (cm) Primaries per panicle
Mean bi S
2
di Mean bi S
2
di Mean bi S
2
di 49 1543A x RSV 1297 87.82 2.58 -7.54 24.30 2.92 0.35 99.67 0.86 -0.80 50 1543A x SPV 1359 66.50 11.34* -9.13 22.31 1.59 0.87 69.67 6.17 4.86 51 1543A x RSV 1427 65.67 -4.30 19.89 21.60 4.34 -0.40 76.16 1.70 4.85 52 1543A x RSV 1460 65.55 7.68 5.77 20.39 2.05 0.72 76.70 2.64 -8.40 53 1543A x SPV 1546 68.22 5.80* -9.12 21.10 1.40 -0.40 80.67 0.88 47.05 * 54 1543A x SPV 1704 80.20 0.48 5.62 22.33 1.96 -0.39 90.33 2.02 -10.12 55 1543A x RPOSV 3 34.17 -1.18 85.69 ** 15.98 0.44 -0.02 80.27 4.21 20.70 56 1543A x RSSGV43 53.55 -4.04 -6.20 19.01 2.31 -0.22 74.22 3.32 14.77 57 9168A x RSV 458 50.47 -3.97 5.09 20.59 5.62 0.49 50.11 4.10* -9.57 58 9168A x RSV 1006 54.51 -2.66 -4.74 21.92 0.47 -0.07 68.00 0.74 47.52 * 59 9168A x RSV 1093 56.25 -4.03 9.07 22.10 -0.77 -0.39 63.00 2.72 135.90 ** 60 9168A x RSV 1130 62.04 -0.25 -7.05 21.75 1.43 -0.21 70.56 1.61 42.51* 61 9168A x RSV 1188 55.73 -8.67 -6.34 22.08 0.62 -0.42 62.78 1.34 1.65 62 9168A x RSV 1200 57.78 2.80 -6.97 22.31 1.12 0.55 59.89 0.73 5.66 63 9168A x RSV 1297 60.64 -5.60 33.77 * 23.26 0.95 -0.39 55.00 2.62 -9.85 64 9168A x SPV 1359 60.92 3.211 106.66 ** 22.84 1.57 -0.00 59.00 0.44 65.35 ** 65 9168A x RSV 1427 49.98 -3.60* -9.43 22.48 -0.32 -0.30 56.78 3.78 -8.54 66 9168A x RSV 1460 54.73 -0.39 -8.79 19.86 4.81 0.61 57.89 -1.35 47.45 * 67 9168A x SPV 1546 60.55 -0.01 10.22 20.70 1.24 -0.42 50.22 -0.11 -3.67 68 9168A x SPV 1704 54.73 -0.10 11.78 22.27 -0.14* -0.42 59.78 1.42 277.72 ** 69 9168A x RPOSV 3 32.22 0.89 13.70 18.51 -4.97 3.49** 60.55 0.56 20.97 70 9168A x RSSGV 43 50.65 -0.91 6.24 19.44 0.90 -0.10 58.22 2.84 14.08 71 CSH 15 R (c) 56.53 3.96 -3.57 20.88 -0.58 0.13 69.62 0.52 -2.16
Mean (Hybrids) 60.81 22.30 71.53
72 104A 53.17 2.07 5.14 22.57 3.93 1.63 * 74.44 -3.58 249.21 **
73 1343A 57.10 1.51 4.85 18.94 2.52 0.44 68.91 0.32 1.14
74 1409A 41.31 -0.59 111.39 ** 27.79 -2.54 6.24 ** 58.78 -3.06 14.13
75 1543A 53.81 2.43 -3.14 19.56 1.13 0.03 69.44 0.06 34.23 *
76 9168A 44.96 1.68 -7.34 19.48 -0.61 0.09 41.67 3.83 49.07 *
77 RSV 458 45.13 0.79 -8.59 14.44 0.11 1.056 43.67 -2.90 25.67 78 RSV 1006 47.79 2.07 -9.11 15.66 0.07 0.08 48.26 -3.10 -5.27 79 RSV 1093 65.52 2.35 -9.01 20.57 -2.56 0.33 69.11 -0.51 -5.41 80 RSV 1130 56.09 4.96 -6.03 18.21 -0.84 2.58 ** 54.44 -0.69 158.26 ** 81 RSV 1188 60.40 1.24 1.27 19.20 -2.88 3.47** 61.67 0.41 -9.72 82 RSV 1200 56.69 4.53 -8.89 19.67 0.42 0.17 60.67 -1.69 32.38 * 83 RSV 1297 54.26 3.98 -7.12 20.01 -1.39 5.25 ** 66.89 -1.06 7.40 84 SPV 1359 58.77 2.66 -8.51 21.50 4.09 -0.15 63.67 -0.07 38.42 * 85 RSV 1427 45.87 2.47 -9.38 18.47 -1.47 1.34 * 71.89 0.81 296.31 ** 86 RSV 1460 53.28 5.49* -9.44 17.76 -0.70 1.96 * 60.00 2.06 10.64 87 SPV 1546 54.15 1.14 5.06 17.30 11.32 7.39 ** 74.22 4.35 39.24 * 88 SPV 1704 53.75 -1.93 13.37 18.85 5.86 2.07 * 61.33 1.53 -9.66 89 RPOSV 3 57.35 4.04* -9.41 16.24 -11.52 7.96 ** 75.67 3.71 13.44 90 RSSGV 43 33.59 -0.52 27.09 * 13.76 3.21 -0.29 85.22 0.69 11.03 91 BP 53 (c) 60.46 0.46 -7.86 15.75 0.22 4.15** 65.64 -0.47 8.74
Mean(Parents) 52.67 18.79 63.78
Table 2.2 Stability parameters for panicle weight, harvest index and 1000 grain weight in rabi sorghum
Sr.
No. Genotypes
Panicle weight(g) Harvest index(%) 1000-grain weight(g) Mean bi S2di Mean bi S2di Mean bi S2di
1 104A x RSV 458 65.82 -0.33 11.01 24.92 0.70* -2.15 46.05 1.33 5.00 ** 2 104A x RSV 1006 73.93 2.41 120.95** 22.17 1.41 2.84 44.72 -0.88 6.11 ** 3 104A x RSV 1093 83.14 1.12 0.45 23.74 0.78 1.63 45.88 1.17 4.26 ** 4 104A x RSV 1130 72.07 -1.52 38.94* 24.96 0.23 -1.28 45.96 -0.16 17.71 ** 5 104A x RSV 1188 77.84 -3.77 40.47* 27.74 -0.28 -1.26 46.01 -2.17 3.95 ** 6 104A x RSV 1200 73.17 1.63 -0.49 32.45 0.16 -1.92 43.04 2.23 19.44 ** 7 104A x RSV 1297 73.23 0.54 -1.33 32.33 1.17 -2.15 41.77 2.33 1.00 8 104A x SPV 1359 66.25 0.60 12.84 26.54 2.05 -1.51 46.54 -0.55 -0.34 9 104A x RSV 1427 71.79 1.87 -1.00 27.57 -0.21 -2.10 45.34 1.31 5.34 ** 10 104A x RSV 1460 72.24 0.77 -5.85 30.15 1.87* -2.14 41.88 1.71 6.15 ** 11 104A x SPV 1546 76.97 2.63 -5.74 36.47 -1.37 -0.67 42.62 1.55 22.91 ** 12 104A x SPV 1704 68.64 0.08 -1.83 26.07 2.88 -1.68 43.26 2.56* -0.53 13 104A x RPOSV 3 34.88 4.81 -5.55 24.61 1.80 4.85 40.33 0.60 30.12 ** 14 104A x RSSGV 43 57.06 -3.73 2.80 24.28 2.54 0.06 42.08 0.88 -0.05 15 1343A x RSV 458 75.74 -0.05 7.61 29.50 -3.86 4.52 45.47 2.39 20.91 ** 16 1343A x RSV 1006 75.89 2.64 -4.65 22.41 -0.48 1.54 42.94 0.39 4.32 ** 17 1343A x RSV 1093 86.80 -4.26 69.40** 28.51 -3.22 3.21 43.86 0.83 0.49 18 1343A x RSV 1130 76.21 0.17* -8.34 29.15 -0.21 2.39 43.14 0.65 18.48 ** 19 1343A x RSV 1188 84.55 0.98 -0.76 29.52 -4.29 6.27* 44.33 1.52 3.73 ** 20 1343A x RSV 1200 104.77 3.06 -6.27 37.94 0.55 -2.07 45.24 0.05 0.69 21 1343A x RSV 1297 72.86 8.65 73.24** 21.93 1.57 -1.43 44.12 1.49 -0.04 22 1343A x SPV 1359 103.05 2.53* -8.37 37.78 2.29 -1.92 47.98 0.01 3.65 ** 23 1343A x RSV 1427 93.09 -0.92 1.49 36.93 2.24 1.17 41.55 -0.21* -0.53 24 1343A x RSV 1460 85.47 2.03 8.27 35.77 2.21 1.55 45.19 2.09 -0.09 25 1343A x SPV 1546 77.16 7.78 -1.69 31.44 -1.67 3.61 40.83 0.51 34.22 ** 26 1343A x SPV 1704 96.69 -0.09 6.42 36.95 1.19 0.10 41.88 1.57 14.38 ** 27 1343A x RPOSV 3 53.53 0.43 15.97 21.78 0.74 -1.61 42.93 3.01 5.46 ** 28 1343A x RSSGV43 72.76 -6.97 90.56** 27.69 -0.58 1.46 41.50 0.04 20.67 ** 29 1409A x RSV 458 60.03 2.55 232.74** 35.60 -1.02 10.62* 41.39 1.72 6.10 ** 30 1409A x RSV 1006 75.77 7.02 58.32** 28.97 1.12 -1.84 43.33 1.91 16.85 ** 31 1409A x RSV 1093 84.30 -3.50 23.73 36.26 2.26 -2.08 45.51 0.77 0.25 32 1409A x RSV 1130 73.49 0.90 -0.73 24.47 0.71 -1.56 46.29 1.58 0.43 33 1409A x RSV 1188 73.94 0.31 214.17** 29.73 4.75 6.86* 44.46 0.85 0.42 34 1409A x RSV 1200 84.78 1.44 4.27 39.29 -0.26* -2.14 40.94 1.78 11.15** 35 1409A x RSV 1297 79.68 5.39 -5.97 32.66 3.57 4.44 42.60 1.27 4.69 ** 36 1409A x SPV 1359 78.00 -0.50 -1.35 34.59 2.30 -1.86 45.08 0.90 1.71 * 37 1409A x RSV 1427 74.47 2.60 -6.69 34.32 2.61 0.46 42.55 0.79 -0.33 38 1409A x RSV 1460 73.19 6.08 83.29** 30.44 -1.15 9.95* 39.92 1.74 2.26 * 39 1409A x SPV 1546 76.38 3.31 -6.82 33.43 0.74 1.31 39.59 -1.08 0.61 40 1409A x SPV 1704 74.74 8.17 69.25** 33.75 -1.20 -2.06 42.42 1.54 12.34 ** 41 1409A x RPOSV 3 45.00 -0.92 61.19** 17.75 1.24 -2.13 40.31 -2.11* -0.54 42 1409A x RSSGV43 58.64 -1.62 21.26 29.10 -0.10 -5.70 36.43 1.87 2.20 * 43 1543A x RSV 458 70.23 -1.12 6.90 32.99 -0.99 4.73 44.99 2.57 0.25 44 1543A x RSV 1006 71.48 4.56 3.17 34.52 -0.28 -1.85 44.25 1.58 1.13 45 1543A x RSV 1093 86.66 1.99 -4.32 31.91 -0.89 -0.40 44.61 2.21 5.79 ** 46 1543A x RSV 1130 82.04 0.48 34.01* 28.39 -0.68 0.34 48.36 1.74 0.51 47 1543A x RSV 1188 94.49 -0.13 -6.26 36.31 1.14 -0.87 45.88 0.99 -0.44 48 1543A x RSV 1200 81.95 3.72 43.26* 33.16 1.14 -0.63 41.06 0.53 11.26 ** * and ** Significant at 5% and 1% level of probability, respectively.
Table 2.2 Contd…
Sr. No. Genotypes Panicle weight(g) Harvest index(%) 1000-grain weight(g)
Mean bi S2di Mean bi S2di Mean bi S2di
49 1543A x RSV 1297 106.99 3.52 -3.38 37.07 1.13 -0.50 46.67 0.95 1.47 50 1543A x SPV 1359 79.76 9.90 97.67** 31.85 0.89* -2.15 48.54 1.35 0.29 51 1543A x RSV 1427 77.60 -3.321* -8.03 33.18 0.44 -1.37 45.78 0.38 12.29** 52 1543A x RSV 1460 80.53 6.50 0.03 34.16 -0.07 -1.29 42.95 1.88 -0.21 53 1543A x SPV 1546 82.06 5.33 39.27* 32.65 1.15 -1.69 42.08 -0.31 5.07 ** 54 1543A x SPV 1704 94.27 1.44 9.93 37.19 1.80 1.08 47.99 1.68 1.88 * 55 1543A x RPOSV 3 44.60 1.43 73.64** 16.88 2.56 -1.07 41.35 -0.77 14.54 ** 56 1543A x RSSGV43 67.12 -3.53 33.53* 27.94 4.16 -0.09 43.16 0.25 1.61* 57 9168A x RSV 458 62.82 -4.291* -7.82 20.82 3.51 -0.58 42.50 2.03* -0.53 58 9168A x RSV 1006 67.31 -4.20 -4.37 22.22 1.92 -1.86 42.42 2.32 9.96** 59 9168A x RSV 1093 69.37 -2.05 41.65* 24.66 2.04 -1.81 42.36 0.29 6.66** 60 9168A x RSV 1130 82.83 1.13 -7.74 32.77 4.62 1.90 42.17 1.86 0.85 61 9168A x RSV 1188 69.06 -7.13 64.79** 18.19 -0.14 -1.08 42.23 2.54 -0.09 62 9168A x RSV 1200 71.91 2.95 -5.72 29.54 0.35* -2.15 40.24 0.93 4.77 ** 63 9168A x RSV 1297 74.55 -3.18 92.78** 21.90 -0.73 -1.58 45.26 1.54 15.68** 64 9168A x SPV 1359 74.28 0.69 68.41** 21.38 -0.35 8.07* 41.77 1.19 4.91 ** 65 9168A x RSV 1427 63.05 -3.90 28.87* 22.72 3.09 -0.72 41.76 0.75 -0.55 66 9168A x RSV 1460 68.69 -2.23 -4.41 20.79 0.75 -1.33 41.99 0.01 -0.46 67 9168A x SPV 1546 75.11 0.68 -1.80 25.76 2.12 -1.23 43.36 2.76* -0.48 68 9168A x SPV 1704 67.18 0.06 33.63* 25.24 2.49 0.23 41.78 0.98 -0.48 69 9168A x RPOSV 3 40.75 -0.67 32.71* 23.43 2.98 2.51 39.10 -0.66 4.41** 70 9168A x RSSGV 43 63.05 -1.33 -3.66 18.94 2.84* -2.12 39.20 0.90 0.12 71 CSH 15 R (c) 72.42 1.65 -8.32 26.83 2.03* -2.14 42.44 1.53 0.30
Mean (Hybrids) 74.37 28.94 43.29
72 104A 66.46 0.80 2.93 28.72 0.70 -1.81 37.81 0.66 6.52 **
73 1343A 71.05 1.67 2.33 30.05 1.79 -1.86 31.26 2.30 3.56 **
74 1409A 53.45 1.53 140.07** 32.22 -0.66 11.05* 26.57 -0.40 6.23**
75 1543A 66.43 2.29 1.20 31.16 0.54 4.32 36.57 -1.55 0.95
76 9168A 58.73 2.67 -8.25 28.06 2.11 0.55 27.40 0.37 -0.34
77 RSV 458 58.77 0.17 -2.82 27.57 1.74 -1.61 42.22 0.97 17.57 **
78 RSV 1006 60.80 3.22 -2.23 24.63 1.64 -2.02 37.34 2.32 1.91 *
79 RSV 1093 78.41 1.15 -5.96 26.63 2.33* -2.15 40.28 3.44 -0.11
80 RSV 1130 69.81 0.08 -7.81 25.69 0.56* -2.14 41.64 0.24 6.10 ** 81 RSV 1188 76.02 -0.41 -4.37 24.96 2.24 -1.59 44.22 1.56* -0.54 82 RSV 1200 72.58 3.14 -3.91 23.60 -0.10 -2.05 38.94 0.89 18.18 ** 83 RSV 1297 69.97 3.09 -5.35 24.85 0.87 -1.03 38.54 2.01 8.67 **
84 SPV 1359 74.15 1.84 -1.35 22.54 2.14 -1.90 40.53 0.05 0.98
85 RSV 1427 60.68 1.19 -5.36 24.51 3.00 -0.97 38.52 0.39 11.14**
86 RSV 1460 67.69 3.98 23.48 21.43 0.13 -1.86 41.12 2.97 7.40 ** 87 SPV 1546 68.59 2.23 -7.06 22.83 0.51 -1.15 31.91 -1.43 8.09 ** 88 SPV 1704 66.66 -2.33 -5.83 23.08 0.12* -2.15 40.86 0.66* -0.55
89 RPOSV 3 72.44 3.43 -2.01 24.19 4.02 0.14 42.48 2.81 0.95
90 RSSGV 43 44.73 -1.77 3.41 24.85 3.04 3.68 27.22 -1.54 1.14
91 BP 53 (c) 73.87 -0.07 -5.03 28.84 0.40 -1.80 41.49 0.48 0.92
Mean(Parents) 66.56 26.02 37.35
Table 2.3. Stability parameters for protein content in rabi sorghum Sl.
No. Genotypes
Protein content (%) Sr.
No. Genotypes
Protein content (%)
Mean bi S
2
di Mean bi S
2
di 1 104A x RSV 458 10.31 3.82 0.40 ** 49 1543A x RSV 1297 8.22 1.82 0.78 ** 2 104A x RSV 1006 9.33 2.35 2.71 ** 50 1543A x SPV 1359 8.83 -2.89 0.78** 3 104A x RSV 1093 8.64 -2.07 0.06 51 1543A x RSV 1427 8.31 1.46 1.42 ** 4 104A x RSV 1130 9.86 3.46 0.35 * 52 1543A x RSV 1460 8.06 -1.57 0.17 5 104A x RSV 1188 9.83 0.62 1.45 ** 53 1543A x SPV 1546 6.77 4.18 0.02 6 104A x RSV 1200 9.08 4.43 0.04 54 1543A x SPV 1704 8.76 -2.50 0.95 ** 7 104A x RSV 1297 9.29 3.22 -0.04 55 1543A x RPOSV 3 8.41 1.50 0.99 ** 8 104A x SPV 1359 10.11 0.16 0.06 56 1543A x RSSGV43 8.40 -1.45 0.09 9 104A x RSV 1427 9.09 0.80 -0.05 57 9168A x RSV 458 10.56 -1.14 3.17 ** 10 104A x RSV 1460 8.94 -1.37 0.17 58 9168A x RSV 1006 11.50 4.71 0.90 ** 11 104A x SPV 1546 9.14 4.07 0.20 * 59 9168A x RSV 1093 10.02 -1.04 1.13 ** 12 104A x SPV 1704 9.00 -2.66 0.13 60 9168A x RSV 1130 10.25 0.29* -0.06 13 104A x RPOSV 3 9.05 -2.18 0.37 ** 61 9168A x RSV 1188 11.07 5.67 1.95 ** 14 104A x RSSGV 43 9.03 -2.40 1.84 ** 62 9168A x RSV 1200 10.70 -1.68 3.33 ** 15 1343A x RSV 458 8.25 -0.92 1.52 ** 63 9168A x RSV 1297 12.01 -4.19* -0.05 16 1343A x RSV 1006 8.21 2.89 0.25 * 64 9168A x SPV 1359 11.02 1.66 0.54 ** 17 1343A x RSV 1093 8.85 1.74 -0.03 65 9168A x RSV 1427 10.72 2.39 0.88 ** 18 1343A x RSV 1130 8.52 0.69 -0.06 66 9168A x RSV 1460 10.06 3.29 -0.05 19 1343A x RSV 1188 9.37 2.64 0.33 * 67 9168A x SPV 1546 9.48 0.09 -0.04 20 1343A x RSV 1200 8.28 3.11 0.24* 68 9168A x SPV 1704 9.41 -1.11 0.69 ** 21 1343A x RSV 1297 8.31 1.57 -0.01 69 9168A x RPOSV 3 9.83 2.15 0.78 ** 22 1343A x SPV 1359 9.77 4.01 0.36 ** 70 9168A x RSSGV 43 9.44 3.82 -0.00 23 1343A x RSV 1427 6.67 -0.77 1.10 ** 71 CSH 15 R (c) 8.93 -1.67 4.70 24 1343A x RSV 1460 8.01 1.11 1.46 ** Mean (Hybrids) 9.14
25 1343A x SPV 1546 6.37 -0.18 1.31 ** 72 104A 8.29 2.17 1.95 ** 26 1343A x SPV 1704 8.10 2.42 0.59 ** 73 1343A 7.83 3.91 0.50 ** 27 1343A x RPOSV 3 8.35 -3.69 -0.01 74 1409A 8.11 3.88 0.46 ** 28 1343A x RSSGV43 8.52 0.76 1.16 ** 75 1543A 8.27 3.68 -0.04
29 1409A x RSV 458 9.94 -1.71 0.09 76 9168A 8.36 4.20 -0.01
30 1409A x RSV 1006 8.53 0.34 0.53 ** 77 RSV 458 7.42 4.39 -0.02 31 1409A x RSV 1093 10.35 2.21 0.23 * 78 RSV 1006 8.62 -4.24 2.06** 32 1409A x RSV 1130 9.67 -3.32 0.45 ** 79 RSV 1093 7.32 -4.11 0.08 33 1409A x RSV 1188 9.60 -3.24 0.40 ** 80 RSV 1130 6.99 -2.07 0.36** 34 1409A x RSV 1200 7.63 4.99 0.97 ** 81 RSV 1188 7.21 2.63* -0.06 35 1409A x RSV 1297 9.41 -2.98 -0.03 82 RSV 1200 7.18 -1.18 2.90** 36 1409A x SPV 1359 9.09 -3.04 0.24 * 83 RSV 1297 7.24 -2.35 0.80** 37 1409A x RSV 1427 7.96 3.11 0.15 84 SPV 1359 8.30 4.59* -0.06 38 1409A x RSV 1460 8.22 2.44* -0.06 85 RSV 1427 8.31 2.93 0.80** 39 1409A x SPV 1546 8.79 2.97 0.91 ** 86 RSV 1460 8.39 6.60 0.29* 40 1409A x SPV 1704 10.57 1.14 0.01 87 SPV 1546 8.45 -0.06* -0.06 41 1409A x RPOSV 3 9.65 4.98 0.30 * 88 SPV 1704 8.59 1.77 -0.00 42 1409A x RSSGV43 11.21 3.02 -0.01 89 RPOSV 3 8.19 0.79 0.66** 43 1543A x RSV 458 8.28 2.03 0.07 90 RSSGV 43 8.19 1.88 3.76** 44 1543A x RSV 1006 8.42 2.44 0.51 ** 91 BP 53 (c) 9.48 -0.51 3.11** 45 1543A x RSV 1093 8.78 3.37 0.02 Mean(Parents) 8.04
46 1543A x RSV 1130 8.76 3.65 0.20 * 47 1543A x RSV 1188 9.29 0.54 1.03 ** 48 1543A x RSV 1200 7.74 -2.33 0.25 *