http://dx.doi.org/10.9717/JMIS.2017.4.3.115
115
I. INTRODUCTION
Educators continually search for better ways to increase student learning outcomes. As the result of a study conducted by Malik and Agarwal [1] to analyse the use of multimedia in several disciplines in higher education, it was discovered that there were many pedagogical issues concerning the failure to increase students’ interest and interaction in the classroom. Hence, it was pointed out that more research was required in the field of multimedia pedagogy so that multimedia form, design and content would not hinder the normal educational process [1]. There exists limited evaluation on the use of multimedia in a blended teaching and learning environment in higher education.
The aim of this research is to evaluate student learning in different multimedia-based classrooms of blended learning in higher education using Kirkpatrick’s model [2]. The different multimedia-based classrooms include face-to-face instruction using PowerPoint slides and problem-based
learning. Since the model is widely used to evaluate training in business and industry, this research aims to evaluate blended learning in higher education using Kirkpatrick’s model.
II. BLENDED LEARNING
In the literature, various definitions can be associated with blended learning. In this research, blended learning is defined as the use of different learning strategies with multimedia that include face-to-face instruction with PowerPoint slides and problem-based learning.
There is considerable support in the literature for blended learning. In a study by Hoic-Bozic [3], the blended e-learning model was used which combined face-to-face environment and online learning via a Learning Management System. It was discovered that the students were in favour of the approach to learning and their academic achievements were improved compared to the previous offerings of the course that were conducted in classical manner. According to Maryam and Marlia [4],
Using Kirkpatrick’s Evaluation Model in a Multimedia-based
Blended Learning Environment
Zarina Che Embi
1, *, Tse-Kian Neo
2, Mai Neo
3Abstract
Over the years, there has been much research in blended learning. However, research regarding its use and evaluation is inconsistent, not following any specific evaluation method, and may not be applicable to local students. In this research, a case study was conducted to evaluate the environment based on three levels of Kirkpatrick’s model. Methodological triangulation was the principle of data collection used in which multiple sources of evidence were triangulated to provide insights into this study. Instruments used include surveys, interviews, questionnaires and pre- and post-tests that are guided by Kirkpatrick’s model. The results revealed that students were positive with the learning environment. Students enjoyed learning with multimedia and motivated to learn as well as engaged in the environment. The tests showed significant difference in their learning. Students also perceived that they have transferred their learning from face-to-face lecture into problem-based learning and learning outcome. This research contributes to the field by providing deeper insights into assessments in multimedia-based blended learning environment and empirical evidence on views, attitudes, learning and knowledge transfer of students in higher education.
Key Words: Blended learning, Evaluation, Higher education, Kirkpatrick’s model.
Manuscript received August 31, 2017; Revised September 8, 2017; Accepted September 14, 2017. (ID No. JMIS-2017-0029)
Corresponding Author (*): Zarina Che Embi, FCI, Multimedia University, Malaysia, 603-83125265, [email protected].
1Faculty of Computing & Informatics,Multimedia University, Selangor, Malaysia, [email protected]
2Multimedia University, Selangor, Malaysia, [email protected]
116
there are several advantages of blended learning over mere face-to-face instruction or online instruction through reviews of the literature, such as increased communication, engagement of face-to-face communication, sense of community, improved academic performance, etc.
III. KIRKPATRICK’S EVALUATION
MODEL
In this study, Kirkpatrick’s model is used for evaluation due to its flexibility which can allow educators to determine multiple assessments and methods which also tallies with the standard practice of higher education institutions in Malaysian universities and other universities around the globe. Kirkpatrick’s model has been used extensively to evaluate training programs and as the basis for evaluation of a variety of educational settings [5, 6]. Kirkpatrick suggested four levels at which training programs should be evaluated that represent a sequence of ways to evaluate programs. The four levels are Level 1: Reaction – How did the participants perceive the program? Level 2: Learning – Did the participants manage to learn? Level 3: Behavior – Were the participants able to transfer what they have learned? Level 4: Results – What are the tangible results from the program? [5].
In order to apply this model, it is most desirable to measure from Level 1 to Level 4, but this is usually not possible. From the literature, it was found that less than 10% conducted Level 4 evaluation [7]. Therefore, for this study, Level 1, 2 and parts of Level 3 where possible, were implemented. Level 4 is not implemented in this study as it is also not relevant to the educational context that the instruction was applied [8].
IV. THE STUDY
The study conducts an evaluation using one of the principles of data collection – the use of multiple sources of evidence [9]. Triangulation is the rationale for using multiple sources of evidence. Methodological triangulation was implemented where multiple methods were used to study a single program to enhance the validity of the research findings [10]. Data were collected from various research instruments including student survey, interview and pre- and post-test. The data collection was also guided by Kirkpatrick’s model. Different data were collected according to the requirements for each level of the model.
This study sought university students where the authors were working through a convenience sample approach as the sample was obtainable or convenient to reach [11]. Participants involved students taking a course offered to students of computing, engineering and management
consisting of 31 students (Malay, Chinese, Indian and International students). Demographics data were collected at the start of the course to gather data on their background, age, gender, computer self-efficacy, attitude towards the internet, previous experience using a computer technology and application, etc. The majority of the students were in the age ranges of 21 to 25 years old. The number of females in the course outweighed the number of males by one. Half of the students were Malays and in their second year of study while the majority of them were management students. The majority of the students have positive attitude towards the internet, high computer self-efficacy and have experience using a computer technology and application.
There are two types of multimedia-based learning environment - Multimedia-based classroom 1 (M1) and Multimedia-based classroom 2 (M2). In M1, the lecturer used multimedia-based content in the form of power point slides presentation which was projected from a PC, onto the white screen in front of the classroom using a projector. In M2, a project was given to them at the start of the course (in the first week of the trimester) and they had to complete it by the end of the course (14 weeks). They would form groups of four to five members and proposed a topic of their choice. Students would have to create an interactive application using multimedia technology. Throughout the development process, they had to utilize any knowledge gained from M1 as well as from other sources mainly the internet in order to transfer the knowledge to the project. Students had to create an interactive multimedia application as a final step of their multimedia project development.
A survey was given to gauge their reaction to both learning experience. Interview with 20% of the sample was conducted to obtain their perceptions. Students were also administered with pre- and post-test to assess learning that had been gained. Questionnaire was given to obtain their perception on any transfer of learning that has occurred at the end of the course as part of the evaluation guided by Kirkpatrick’s model.
V. RESULTS
5.1. Results of Level 1 5.1.1. Survey Results
http://dx.doi.org/10.9717/JMIS.2017.4.3.115
117
Cronbach’s Alpha. The Cronbach’s Alpha coefficients were more than 0.6 in all dimensions, so it was deemed as reliable [18].
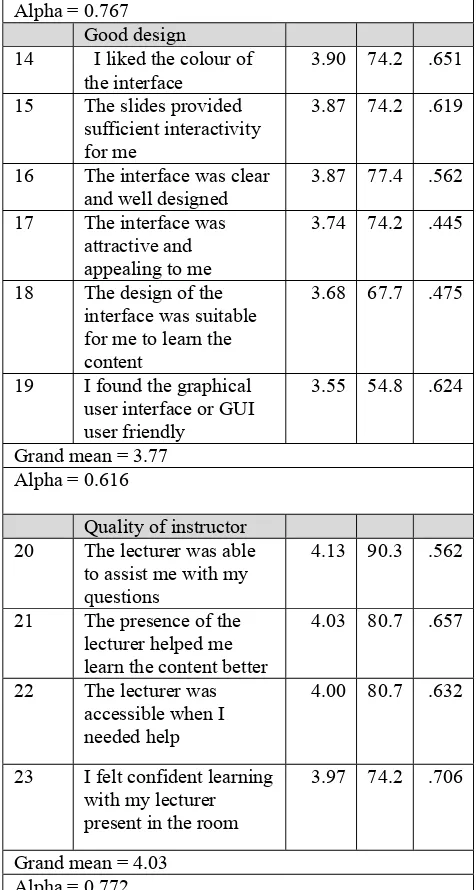
Table 1 and 2 depict the results of the survey on the student’s responses in terms of the five dimensions, with M
representing the mean, p representing percentage of students’ responding positively towards the items and the standard deviation of the responses, in descending order of the mean. The grand mean and Cronbach’s Alpha are also shown for every dimension.
Table 1. Results of Level 1 survey – M1
Item Dimension Mean %
(p) Dev.Std. Learning with
multimedia
1 Multimedia made
understanding the content better
4.06 80.6 .680
2 Multimedia made
learning fun and motivating
4.03 80.6 .657
3 I was able to learn
better with multimedia content
4.00 83.9 .577
4 Learning with
multimedia was appealing to me
3.90 74.2 .651
5 The multimedia
environment managed to hold my attention
3.87 74.2 .619
Grand mean = 3.97 Alpha = 0.834
Motivation
6 Rank your overall
satisfaction of this type of learning (face-to-face instruction using ppt slides)
3.94 74.2 .772
7 I enjoyed learning in
this environment 3.90 80.6 .539
8 I prefer learning in this
environment 3.77 71.0 .669
9 I was motivated to
learn in this environment
3.74 71.0 .631
Grand mean = 3.84 Alpha = 0.771
Engagement
10 I found learning in this
environment interesting 3.87 71.0 .885
11 I found learning in this
environment engaging 3.77 71.0 .560
12 I was not bored with
this method of learning 3.74 61.3 .965
13 I felt excited to learn in
this environment
3.74 71.0 .631
Grand mean = 3.78
Alpha = 0.767 Good design
14 I liked the colour of
the interface 3.90 74.2 .651
15 The slides provided
sufficient interactivity for me
3.87 74.2 .619
16 The interface was clear
and well designed 3.87 77.4 .562
17 The interface was
attractive and appealing to me
3.74 74.2 .445
18 The design of the
interface was suitable for me to learn the content
3.68 67.7 .475
19 I found the graphical
user interface or GUI user friendly
3.55 54.8 .624
Grand mean = 3.77 Alpha = 0.616
Quality of instructor
20 The lecturer was able
to assist me with my questions
4.13 90.3 .562
21 The presence of the
lecturer helped me learn the content better
4.03 80.7 .657
22 The lecturer was
accessible when I needed help
4.00 80.7 .632
23 I felt confident learning
with my lecturer present in the room
3.97 74.2 .706
Grand mean = 4.03 Alpha = 0.772
Table 2. Results of Level 1 survey – M2
Item Dimension Mean
(M)
%
(p) Std. Dev. Learning with multimedia
1 Learning with
multimedia was
appealing to me
4.14 88.9 .593
2 Multimedia projects
made learning fun 4.06 86.1 .583
3 Doing multimedia
projects was a great way to learn
118
4 I prefer learning through
multimedia projects 3.92 86.1 .554
Grand mean = 4.00 Alpha = 0.697
Motivation
5 The project was
challenging yet
stimulating to do
3.97 83.3 .560
6 Rank your overall
satisfaction of this type of
learning (project-based
learning)
3.94 83.3 .532
7 The project motivated me
in learning 3.92 91.7 .280
8 I enjoyed working on a
project like this 3.81 72.2 .577
Grand mean = 3.91 Alpha = 0.645
Engagement
9 I felt excited to learn in
this environment 4.06 94.4 .410
10 I found learning in this
environment interesting 3.94 88.9 .410
11 I was not bored with this
method of learning 3.92 80.6 .554
12 I found learning in this
environment engaging 3.86 80.6 .593
Grand mean = 3.94 Alpha = 0.708
Good design
13 The project was well
designed 4.03 88.9 .506
14 The design of the project
was suitable for me 3.89 80.6 .622
15 The project was good 3.86 77.8 .639
16 All tasks were able to be
completed on time 3.83 83.3 .775
Grand mean = 3.90 Alpha = 0.714
Quality of learning
activity
17 We were able to
contribute our creative ideas in the group
4.03 88.9 .609
18 My group supported and
helped resolve member’s problems
4.03 88.9 .696
19 My group encouraged
positive contributions
from each member
4.03 94.4 .377
20 There was a lot of team
spirit in this group 3.92 83.3 .604
Grand mean = 4.00 Alpha = 0.823
Results showed that students had positive reaction towards all the learning dimensions to enhance learning in M1. Students have positive reactions as the use of multimedia elements and good design of the traditional method provided them with engagement and ease of following. The quality of the instructor could help them learn the course better in face-to-face instruction using the PowerPoint slides.
It can be seen from the survey results that students reacted positively towards M2 in terms of the five dimensions to enhance learning. The findings indicate that students generally liked the environment where they could be engaged and motivated to learn with multimedia to solve a given problem. Good design and quality of learning activity like teamwork were among the important indicators of a well-received problem-based learning environment.
5.1.2. Interview Results
The experiences and perceptions of the blended learning environment as stated by a few students in interviews are reported in this section. This evaluation is in accordance with Level 1 of Kirkpatrick’s model where student’s reaction was further investigated. The interviews occurred after the end of the course. The interviews were semi-structured and following the guide that had been prepared. About 20% (six) of the students were interviewed.
http://dx.doi.org/10.9717/JMIS.2017.4.3.115
119
Table 3. Interview feedback for M1
Students were also asked to further explain on their likes or dislikes of learning in M2. All of them liked the environment because they could gain new experience and gain more knowledge by applying it. Their feedback can be categorised as experience/knowledge, better understanding and quality of learning activity. They could learn better with the help of other group members when working in a group. The topics that have been covered in other environments could be applied in the project. It was perceived to expose them to real world projects in the future, gained the required skills and understand all the other content that they needed to apply in order to finish the project. As such, it could test the lesson that they have acquired through the other learning environments and felt the exposure to real world industries as depicted in Table 4.
5.2. Results of Level 2
5.2.1. Pre- and Post-test Results
Pre-tests and post-tests were conducted for M1 while post-test only was conducted for M2. Pre-test was given in M1 because the knowledge was not totally new to the students based on the findings from the demographics survey. However, knowledge in M2 was considered new as they were never exposed to similar project before. Test is used to measure student’s learning in accordance with Level 2 of Kirkpatrick’s model. The normality test is used to determine whether the sample has a normal distribution before testing the significance of the mean score for the test. As recommended for sample sizes that are less than 50, it is more reliable to use Shapiro-Wilk test [19]. Table 5 and 6 show that the p value is below 0.05 which is statistically
significant, hence it is assumed that the sample is not normally distributed.
Table 4. Interview feedback for M2
Table 5. Normality test result in M1
Shapiro-Wilk
Statistic Df Sig.
Pre-test .944 31 .108
Post-test .910 31 .013**
**Significant at p < 0.05
Table 6. Normality test result in M2
Shapiro-Wilk
Statistic Df Sig.
Post-test .911 31 .013**
**Significant at p < 0.05
Therefore, after the pre-tests and post-tests have been conducted for M1, their means are compared using Wilcoxon Signed-Ranks Test whereas for M2, One-sample Wilcoxon Signed-Ranks Test is used to test the significance
Respondent Feedback Theme
1
2
3
Of course. Whenever you do or in a project team, definitely there's a new experience or knowledge gained in the making process. Whether individual or group project, it depends on the project. For a big project that requires lots of manpower, i could use some hands. This will ensure the project will be efficiently managed.
I like to do a project in this course because it exposes me to the futuristic application using adobe flash specifically so that more knowledge based on multimedia will be obtained for my future undertaking in multimedia courses. I like to do in a group so that team members can share and discuss everything that related to the project application itself.
I like it a lot because it gives me the real experience and hands on experience to do the task on the project. It also kind of the preparation for the real world. I prefer individual, it is easier to manage the work including time management, task, etc.
Experience/knowledge
4
5
Yes, because from here i can understand all other software application to finish the project. All the required software application which is very important in skill next time when i come out to work. I prefer individual project because it’s easier to focus on personal idea and don't have pressure other group member who don't want to do their work
Yes i like it, can learn many things and understand better. I prefer working as a group...bcoz can learn with each other, help each other if we facing problem and finish the project in short period.
Better understanding
6 Yes, it test out what I have learn through the course. And I able to expose myself to real world industries. I like individual, because when you were appointed as the group leader, people expect more from you.
Quality of learning activity
Respondent Feedback Theme
1 From 1 to 10 scale, i would give it an 8. I think it's the best way in learning process. Multimedia makes the process better and easier to be understood.
Learning with multimedia
2 Yes i like it too especially the one with the video. PPT slides also serves as good study notes especially for final exam. It gives student the important parts to focus on exam
Engagement
3
4
Yes. I like this method of learning. It gives better understanding with the guide of lecturer in class.
I like but sometimes it can be good sometimes it can be boring, depending on the lecturer
Quality of instructor
5
6
Not really like it because sometimes it’s very boring when i see all the text inside the slides I hate it, because I have to attend the class and sit down for the whole hours and listen to the lecturer, while I can't even imagine what if it is look like on the pc, and thinking either I can handle the software or not. I think lecture should be in lab later on. More convenient.
120
of the means against the hypothetical mean of 10.00 (50% of post-test score). It is assumed that the means are equal to the medians when using this test. Table 7 and 8 show the results of the tests.
Using this method, statistical significance is accepted where p is less than 0.05 (p<0.05) when testing for 95%
confidence. Hence, there is a statistically significant difference of pre-test/hypothetical mean and post-test in M1 and M2 as p values are less than 0.05. This indicates that
students have actually made significant progress in their learning process after being exposed to this blended learning environment. This result is similar with existing literature where students have shown significant learning. This result is consistent with their positive reaction found in Level 1.
Table 7. Wilcoxon Signed Ranks test of learning in M1
Pre-test (M =8.06)
Post-test (M =10.87)
Z = -4.896a p = 0.000**
a. Based on negative ranks. **Significant at p < 0.05
Table 8. One-sample Wilcoxon Signed Ranks test of learning in M2
Hypothetical Mean (M = 10.00)
Post-test (M = 10.90)
Z = -2.069a p = 0.039**
a. Based on negative ranks. **Significant at p < 0.05
5.3. Results of Level 3 5.3.1. Questionnaire Results
In order to gain insight on whether students have transferred the knowledge from the lectures to the project and learning outcome, questionnaire was used to obtain their perception on their transfer of learning according to Level 3 of Kirkpatrick’s model. Most of them felt that all or some of the learning has been transferred. There were a small number of students who did not feel that they have transferred the knowledge due to various reasons including slow learner and confusion.
Students perceived that all of the knowledge was transferred to the project and learning outcome as they could relate and apply the concepts learned in the face-to-face instruction using PowerPoint slides. The content learned was applied into the problem-based learning and learning outcome was perceived to be achieved:
Student 1: “Of course, we have applied all of the
principles on the project”
Student 2: “Yes because it made me understand
more and apply animation from face-to-face”
Student 3: “Yes I've transferred the principles and technique learned”
Students felt that they could only transfer some of the knowledge because they wanted to keep it simple or did not understand how to apply in the project and learning outcome:
Student 1: “Yes but not all as we keep our work simple and use less colour”
Student 2: “Some sort of it. We use basic animation only”
Student 3: “Yes, I think half only because cannot
understand some parts to apply”
However, there were five students who did not feel that they have transferred the knowledge but did not give any comment, not sure or due to being slow learner or it was confusing:
Student 1: “Not sure, I admit I'm a bit slow in this” Student 2: “Not really, even though it is helpful but
sometimes confusing” Student 3: “No, did not understand well”
VI. CONCLUSION
The study has demonstrated that it is possible to evaluate a blended learning environment using Kirkpatrick’s model by combining several methods of data collection. Overall, students were generally satisfied with the learning environment. They were found to significantly learn from the test results. They also perceived that they were able to transfer the knowledge gained from the lectures. As such, research contribution that resulted from this study include the deeper insights into assessments in multimedia-based blended learning environment and the empirical evidence on the evaluation of the learning environment in higher education that has been demonstrated based on the three levels of Kirkpatrick’s model. Although there are some limitations in this study, it has provided empirical evidence on views, attitudes, learning and knowledge transfer of students in blended learning.
Acknowledgement
http://dx.doi.org/10.9717/JMIS.2017.4.3.115
121
REFERENCES
[1] Malik, S. and Agarwal, A. (2012). Use of Multimedia
as a New Educational Technology Tool–A Study.
International Journal of Information and Education Technology, 2(5), 468-471.
[2] Kirkpatrick, D.L. (1996). Evaluating Training
Programs. San Francisco: Berrett-Koehler.
[3] Hoic-Bozic, N., Vedran, M. and Ivica, B. (2009). A Blended Learning Approach to Course Design and
Implementation. IEEE transactions on
education(0018-9359), 52 (1), 19-30.
[4] Maryam Tayebinik and Marlia Puteh (2012). Blended
Learning or E-learning? International Magazine on
Advances in Computer Science and Telecommunications, 3(1), 103-110.
[5] Chrysafiadi, K., and Virvou, M. (2013). PeRSIVA: An
empirical evaluation method of a student model of an intelligent e-learning environment for computer programming. Computers & Education, 68. 322-333. doi:10.1016/j.compedu.2013.05.020
[6] Diefes-Dux, H.A., C. Samant, T.E. Johnson, and O’Connor, D. (2004). Kirkpatrick’s level 1 evaluation of the implementation of a computer-aided process design tool in a senior-level engineering course. Journal of Engineering Education 93(4): 321-31.
[7] Wittenborn, D (2008). PhD thesis. Assessment of a Blended Instructional Delivery System for Product Lifecycle Management Education. Purdue University, U.S.A.
[8] Winfrey, E.C. (2002). Kirkpatrick’s Four Levels of Evaluation. Retrieved September 7, 2011 from
http://coe.sdsu.edu/eet/Atricles/k4levels/index.htm [9] Yin, R.K. (2009). Case Study Research: Design and
Methods (4th ed.). Thousand Oaks, CA: Sage.
[10]Cohen, L., Manion, L., and Morrison, K., (2000) (5th Edition), Research Methods in Education, London: RoutledgeFalmer
[11]Alreck, P. L., and Settle, R. B. (1995). The survey research handbook: Guidelines and strategies for conducting a survey (2nd). Burr Ridge, IL: Irwin. [12]Alsadhan, A., Alhomod, S. and Shafi, M. (2014).
Multimedia Based E-learning : Design and Integration of Multimedia Content in E-learning. International Journal of Emerging Technologies in Learning (iJET),
9(3), 26-30. Kassel, Germany: Kassel University Press GmbH.
[13]Hailikari, T.K. and Parpala, A. (2014). What impedes or enhances my studying? The interrelation between approaches to learning, factors influencing study
progress and earned credits. Teaching in Higher
Education. 19(7).
http://dx.doi.org/10.1080/13562517.2014.934348 [14]Jereb, E., and Šmitek, B. (2006). Applying multimedia
instruction in e-learning. Innovations in Education & Teaching International, 43(1), 15-27.
[15]Kang, M., Hahn, J., Yoo, E. and Kim, B. (2011). Validating a Technology Enhanced Student-Centered Learning Model. In T. Bastiaens & M. Ebner (Eds.), Proceedings of World Conference on Educational Multimedia, Hypermedia and Telecommunications 2011 (pp. 3025-3034). Chesapeake, VA: AACE. [16]Lim, D. H., and Morris, M. L. (2009). Learner and
Instructional Factors Influencing Learning Outcomes
within a Blended Learning Environment. Educational
Technology & Society, 12 (4), 282–293
[17]Moos, D.C and Marroquin, E (2010). Multimedia, hypermedia, and hypertext: Motivation considered and
reconsidered, Computers in Human Behavior, 26(3),
265-276.
10.1016/j.chb.2009.11.004.(http://www.sciencedirect.c
om/science/article/pii/S0747563209001757)
[18]Lim C.P., Khine M. S., Hew, T., Wong, P., Shanti, D. and Lim, B. (2003). Exploring critical aspects of information technologies integration in Singapore schools. Australian Journal of Educational Technology,
19(1), 1-24.
http://www.ascilite.org.au/ajet/ajet19/lim.html
122
Authors
Zarina Che Embi is a lecturer at
Multimedia University, Cyberjaya. She obtained Bachelor of Computer Science (Hons) from University of Malaya and Master of Science (Creative Multimedia) from Multimedia University. She is currently pursuing PhD in the areas of blended learning and evaluation. She is a member of Assistive Technology Special Interest Group and CAMELOT Research Centre.
Prof. Dr. Neo Tse Kian is a Professor
at the Faculty of Creative Multimedia, specializing in Multimedia Technology in Education and Constructivist Learning Environment. He is currently the Dean of the Faculty of Creative Multimedia and a member of the CAMELOT Research Centre.
Prof. Dr. Mai Neo is the Director of