ASSESSMENT OF WATER QUALITY INDEX OF BETWA RIVER IN VIDISHA
CITY, MADHYA PRADESH, INDIA
1 Aarti Patel, 2 Dr. Manoj Datar
1Research Scholar, Applied Chemistry, Samrat Ashok Technological Institute Vidisha, India 2Professor of Chemistry, Samrat Ashok Technological Institute Vidisha, India
1Email - [email protected] 2Email - [email protected]
1. INTRODUCTION:
Water is an essential need of human being and industrial developments. It is one the most delicate and important part of the environment.1 Human use different types of water resources like ponds, lakes and rivers for various purposes including municipal and industrial water supply, agricultural irrigation, hydroelectric power generation and waste assimilation etc.2 Renewable fresh water is an indispensable resource for all life forms. This is why it deserves special attention because it is very impaired and seriously threatened by different types of human activities.3 Rivers are the most important natural resource for development but now a day it is being polluted by indiscriminate disposal of sewage, industrial wastes, which affects its physicochemical and microbiological quality. Human health is also threatened by the modern techniques using in agricultural development particularly to excessive application of fertilizers and unsanitary conditions.4
Water Quality is an important factor to finding environmental changes, which are strongly associated with our social and economic development. Fresh water in the developing countries has become a critical issue. Scarcity of fresh water may be possible in future. It may be good for irrigating certain crops but not for some other crops.5 Quality of water is an important consideration in any assessment of pH or alkali conditions in an irrigated area. A good quality of water has the potential to yield maximum. Poor quality of water can develop various soil and cropping problems and abnormalities.6
It is very common that people who are most vulnerable to water-borne diseases are those who use polluted and infected drinking water sources. Access to safe drinking water remains an urgent necessity, as 30 % of urban and 90 % of the rural Indian population still depends completely on untreated surface or groundwater resources. The factor leads to less suitability to water needed by the household for consumption. Maintaining the quality of water is very essential in order to utilize the resource effectively for a long time. The objective of this research is to provide information on the physico-chemical properties of River Betwa in order to create awareness about the impacts of unregulated waste discharge on the river water.7, 8
2. LITERATURE REVIEW
A lot of works have been done since few decades about water quality analysis. In these works, it has to try to estimate the quality of water and level of pollution. Research works have also done on new techniques or methods for evaluation and interpretation of quality of water. Few techniques or methods are related to seasonal and spatial variations and multivariate analysis (water quality index) etc.
Abstract: The aim of present study is to calculate the Water Quality Index (WQI) of River Betwa at its source in
2017. A Water Quality Index provides a single number or grade that expresses overall water quality at a certain location and time. Weighted Arithmetic Water Quality Index method was used in this study. It has been calculated by some important physico-chemical parameters. The sampling station which is located in middle of Vidisha city was selected on the basis of its importance. Eleven Different physico-chemical parameters like pH, Electrical Conductivity, Total Dissolved Solids, Total Suspended Solids, Nitrates, Chloride, Sulphate, Total Alkalinity, Total Hardness, Dissolved Oxygen and Biochemical Oxygen Demand were examined for a period of three seasons summer, rainy and winter. The overall results of the study were concluded in the form of Water Quality Index. Highest value of Water Quality Index was 117.41 found in summer season which indicates the unsuitability of water for domestic uses and the lowest value was 65.71 in rainy season which also shows the Bad quality of water. The analysis reveals that the river water requires treatment prior to use.
3. METHODOLOGY:
3.1 STUDY AREA
For the assessment of water quality of Betwa River, Vidisha town was selected. Vidisha town is the district head quarter located in Eastern part of the Malwa Region. It is near the state capital Bhopal and east of Betwa River in the fork of the Betwa and Bais River, 10 km from Sanchi.9
The Betwa is a river of great ancient past and immense legendary and region values for the people of the Malwa region of Madhya Pradesh for many years. It is a main river of the Vidisha town which takes its birth from south west 23o02’ north 77o20’ south. It enters about 6 km away from Vidisha town towards south and flows for about 96 km in this district. Betwa is the lifeline for the region along which it passes. It plays an important role in the all-round growth and development of the terrain the river flowing through the region. The river by all means acts as a main lifeline for all the activities related to irrigation, domestic water supply, industrial water needs, and other minor activities.
3.2 MATERIALS AND METHODS
The present work was undertaken in 2017. Sampling was done in month April, August and December to determine the seasonal variations. Each of the water samples was analyzed for eleven parameters such as pH, Electrical Conductivity (EC), Total Dissolved Solids (TDS), Total Suspended Solids (TSS), Nitrates (NO3ˉ), Chlorides (Clˉ), Sulphates (SO42ˉ), Total Alkalinity (TA), Total Hardness (TH), Dissolved Oxygen (DO) and Biochemical Oxygen Demand (BOD).
3.2.1 Sample Collection
The water samples were collected in the polyethylene bottles. The samples were collected from different points and were mixed together to prepare a uniform sample.
3.2.2 Sample Analysis
All parameters were estimated by using standard procedures recommended by APHA.10 pH was measured by pH meter. Conductivity was measured by Conductivity meter. TDS and TSS were determined by evaporation of water sample. Chloride content was calculated by Mohr’s method. Total alkalinity was measured by acid-base titration. For the determination of Total hardness, complexometric titration was performed on all samples. Dissolved oxygen was
determined by Winkler’s method. The BOD test was carried out by 5 days incubation method. The BOD level was estimated by comparing the DO level of a water sample taken immediately. Nitrates and sulphates were determined by instrumental methods. To minimize the changes in pH and DO of water, in-situ measurements were carried out at the same time of sample collection.
3.3 DATA ANALYSIS
3.3.1 Calculation of Standard Deviation
The standard deviation (SD) was calculated to quantify the amount of variation or dispersion of values of parameter.
3.3.2 Study of seasonal variations of different Physico-Chemical Parameters
Concentration of different physico-chemical parameters in different seasons have compared to know the influence of different seasons on parameters.
3.3.3 Calculation of Water Quality Index
Water Quality Index of the present watershed has been established from important various physico- chemical parameters in different seasons. WQI represent the quality of water in terms of index number which represents overall quality of water for any intended use. Weighted Arithmetic Water Quality Index (WA-WQI) method categorizes the water quality according to the degree of purity by using the most commonly measured water quality variable.11
Qi = 100[(Va-Vi)/ (Vs-Vi) Overall WQI = [∑ (Qi Wi) / ∑ Wi] Where,
Qi = Quality rating of a particular parameter Wi = Unit weight of same parameter
Vs = Standard value of a particular parameter
Generally, Vi = 0 (except in certain parameters like pH, dissolved oxygen.)
TABLE 1. SUITABILITY OF WQI VALUES FOR HUMAN CONSUMPTION ACCORDING TO WA-WQI
4. RESULTS AND DISCUSSION
The water environment is a dynamic system. Occasional review of assessing requirements, effluent discharge standards and water quality indices is deemed necessary for the sustainable management of water resources. 12
4.1 SEASONAL VARIATIONS AND STANDARD DEVIATIONS
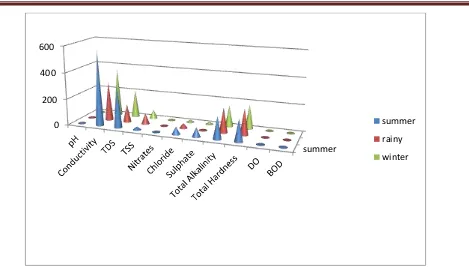
Electrical conductivity and Total Dissolved Solids was showing comparatively higher deviation in this study. (Table 2) Seasonal variations were also observed in few parameters which have shown in Figure 1.
TABLE 2. SEASONAL VARIATIONS AND STANDARD DEVIATIONS OF PHYSICO-CHEMICAL PARAMETERS OF RIVER BETWA
S.No. Parameters EV-1 EV-2 EV-3 Min. Max. SD
1 pH 7.8 6.8 7.8 6.8 7.8 0.471405
2 EC 571 300 373 300 571 114.4911
3 TDS 315 136 214 136 315 73.27725
4 TSS 25 82 68 25 82 24.25329
5 NO3ˉ 3.05 5.5 2.5 2.5 5.5 1.304054
6 Clˉ 58.4 38 19 19 58.4 16.08837
7 SO42ˉ 71.2 9 17.6 9 71.2 27.51921
8 TA 169 190 162 162 190 11.89771
9 TH 168 196 184 168 196 11.46977
10 DO 5.5 4.5 4 4 5.5 0.62361
11 BOD 7.2 2.2 3.8 2.2 7.2 2.084866
EV-1= estimated values in summer season, EV-2= estimated values in rainy season, EV-3=estimated values in winter season, Min. =minimum value, Max.= maximum value, SD= Standard deviation. Unit of all values is mg/l
except pH and Electrical conductivity.
The pH level is a measure of the acidic or basic nature of the water. Water containing a great deal of organic pollution will normally tend to be somewhat acidic.13 pH is one of the most important component that serve as an index of the pollution.14 The higher range of pH indicates higher productivity of a water body.15 In the present study PH was found between 6.8 to 7.8.
High or low Electrical Conductivity (EC) in water is result of an elevated or reduced level of dissolved ions.16 In this study, Electrical conductivity was found to be very high in summer season which indicates presence of higher amount of ions in water.
Total Dissolved Solids (TDS) were also found high in summer season. It may be due to the less flow of water. It also confirms the relationship between EC and TDS. Waters with higher solids content have laxative and sometimes the reverse effect upon people whose bodies are not adjusted to them and cause the water to have an unpleasant mineral taste. TDS consists of oxygen-demanding wastes, disease-causing agents, which can cause immense harm to public health.17
Water Quality Index Level Water Quality status 0-25 Excellent
26-50 Good
51-75 Bad
76-100 Very Bad
FIGURE 1. Seasonal variations of different physico-chemical parameters of River Betwa
Highest Total Suspended Solids (TSS) 82 mg/l was observed in rainy season. The total suspended solids in surface waters occur primarily from water runoff during rainy days, stream bank and channel erosion, dead plant matter, plankton, resuspension of sediment into the water. During dry days where rainfall is less or nothing at all, TSS amount in rivers is expected to curve down.18
Nitrate and Nitrite are natural ions that are the part of nitrogen cycle. In the ecosystem, nitrate is the most important nutrient. A higher value of Nitrate is due to water bodies polluted by organic matter.19 Nitrate ion in water is undesirable. A high nitrate level also cause of eutrophication.20 The high level of those ions may be attributed to the discharge of wastewater from domestic activities and hazardous waste of industrial and agricultural activities.21 In this study, Nitrates were found well within the permissible limit in all seasons.
Chloride is one of the most important parameter in evaluating the water quality. The higher concentrations of chlorides signify higher degree of organic pollution.22 Highest amount of chloride 58.4 mg/l was found in summer season which is under the permissible limit. Chloride concentration in river water may result due to pollution by sewage waste and common salt added.
Presence of Sulphate in water may be due to the used of detergent and soap by the neighbors and the city inhabitants. High sulphate loads in polluted rivers and groundwater have led to increased sulphur fluxes and concentrations in fens and marshes. Higher concentration of sulphates may result of high atmospheric deposition, fertilizers etc. It also may due to oxidation of pyrite deposits in the deeper subsoil.23, 24 Higher amount of sulphates mark the unsuitability of water for domestic uses. The range of sulphate in this study was 9 mg/l to 71.2 mg/l. All values were well within the permissible limit.
The alkalinity of water is usually generated by carbonates, bicarbonates and hydroxyl ions and less frequently by borates, silicates and phosphates. This may be used as a tool for the quantification of productivity conditions of water bodies.25 In all observations, Total Alkalinity was found very high. The highest amount of Total Alkalinity was 190 mg/l in rainy season which indicate the excess amount of salts.
Hardness implies the lather forming capacity of a water sample and the two cations mainly responsible for hardness of water are calcium and magnesium.26 Total Hardness might be due to the dissolution of land acquired carbonates and bicarbonates in the water.27 Highest amount of Total Hardness was investigated 196 mg/l in rainy season.
The level of Dissolved Oxygen (DO) acts a sign of the oxygen level of the water body. Large depletion of DO is evocative of the existence of significant amount of bio degradable organic matter in the watershed. Dissolved Oxygen depletion can also be ascribed to the phytoplankton respiration and sediment oxygen demand.28 The concentration of DO was more during summer and least during winter season.
Bio-chemical Oxygen Demand (BOD) introduce to the amount of oxygen that would be consumed by bacteria and protozoa to oxidize organics. BOD test help to measure the amount of biodegradable organic material of water sample.29 In this estimation, BOD concentration ranged between 2.2 mg/l to7.2 mg/l. Highest value of BOD was found in summer season and lowest value was found in rainy season.
summer 0
200 400 600
summer
rainy
4.2 QUALITY RATINGS AND WATER QUALITY INDECES
The Water Quality Indices for all three samples in different months of 2017 ranges from 65.71 to 117.41. Highest value of WQI was found in summer season which indicate grade V of river water that is unsuitable for drinking while lowest value 65.71 was found in rainy season which shows bad quality of water (grade III). Study of WQI reveals higher pollution level in summer season.The quality was improved in rainy season may be due to flow of fresh water during and after rainy season. At that time concentration of different ions is also decreased.
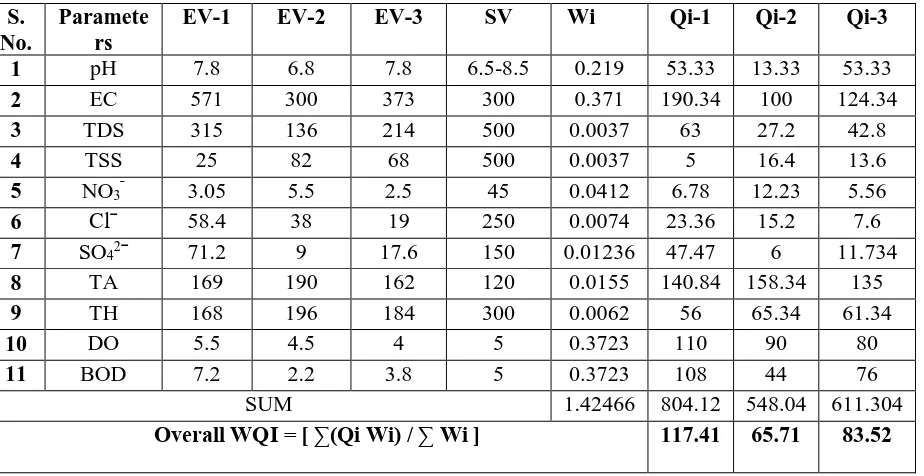
TABLE 3. QUALITY RATINGS AND WATER QUALITY INDECES OF RIVER BETWA
S. No.
Paramete rs
EV-1 EV-2 EV-3 SV Wi Qi-1 Qi-2 Qi-3
1 pH 7.8 6.8 7.8 6.5-8.5 0.219 53.33 13.33 53.33
2 EC 571 300 373 300 0.371 190.34 100 124.34
3 TDS 315 136 214 500 0.0037 63 27.2 42.8
4 TSS 25 82 68 500 0.0037 5 16.4 13.6
5 NO3ˉ 3.05 5.5 2.5 45 0.0412 6.78 12.23 5.56
6 Clˉ 58.4 38 19 250 0.0074 23.36 15.2 7.6
7 SO42ˉ 71.2 9 17.6 150 0.01236 47.47 6 11.734
8 TA 169 190 162 120 0.0155 140.84 158.34 135
9 TH 168 196 184 300 0.0062 56 65.34 61.34
10 DO 5.5 4.5 4 5 0.3723 110 90 80
11 BOD 7.2 2.2 3.8 5 0.3723 108 44 76
SUM 1.42466 804.12 548.04 611.304
Overall WQI = [ ∑(Qi Wi) / ∑ Wi ] 117.41 65.71 83.52
EV-1= estimated values in summer season, EV-2= estimated values in rainy season, EV-3=estimated values in winter season, Qi-1=quality ratings in summer season, Qi-2=quality ratings in rainy season, Qi-3=quality ratings in winter season, Wi =Unit weight, SV=standard values. Standard values and Unit weight (Wi) for the parameters
are recommended by ICMR (Indian Council for Medical Research) and BIS (Bureau of Indian Standards).
5. CONCLUSION:
The present study revealed that the physico-chemical water quality of river Betwa was not satisfactory in studying time. According to Water Quality Indices it was unfit for human health. The high value of WQI has been found to be mainly from the higher value of total dissolved solids, total suspended solids, Total hardness and chlorides in the river water. It needs treatment to minimize the contamination of excess amount of dissolved compounds. The present study may prove to be beneficial for its better management. It will be also helpful to protect and conserve the river at area of study.
6. RECOMMENDATIONS:
Well-designed sewage treatment plant can improve the present condition of the river. Solid waste management should also follow a proper manner so that surface and ground water sources may protect from contaminations by solid wastes. Awareness and participation of the people may be determining factor to control pollution and improve water quality of the river.
REFERENCES
1. Das J., Acharya B.C.,(2003): Hydrology and assessment of lotic water quality in Cuttack city, India: Water, Air,
Soil Pollution, 150(1-4), 163-175.
2. Massoud M.A. (2012): Assessment of water quality along a recreational section of the Damour River in Lebanon using the water quality index: Environmental Monitoring and Assessment, 184, 4151–4160.
3. Togue F.K., Kuate G.L.O., Oben L.M.(2017): Physico-Chemical characterization of the surface water of Nkam River using the Principal Component Analysis: Journal of Materials and Environmental Sciences, 8(6), 1910-1920. 4. Okeke O.K., Igboanua A.H. (2003): Characteristics and quality assessment of surface water and groundwater
5. Srikanth S.K.D., Sudhakar B., Siva Rama Krishna K., Vasudeva R.P., Chandra Sekhar M. (2014): Determining Water Quality Index for the Evaluation of Water Quality of River Godavari, India: International Journal of
Engineering Research and Applications, 1(2), 174-182.
6. Gupta P., Choudhary R., Vishwakarma M. (2009): Assessment of water quality of Kerwa and Kaliasote rivers at Bhopal district for irrigation purpose, NIIST, Bhopal, (MP) India: International journal of theoretical and applied
science, 1(2), 27-30.
7. Kumar R., Singh R.D., Sharma K.D. (2005): Water resources of India: Current Science, 89, 794–81.
8. Gajendran, Jesumi (2013): Assessment of Water Quality Index in Cauvery River Basin: A Case Study on Tiruchchirappalli District, Tamil Nadu, India: Universal Journal of Environmental Research and Technology, 3(2), 137-140.
9. Vishwakarma S., Varma A., Saxena G. (2013): Assessment of water quality of Betwa River, Madhya Pradesh, India: International Journal of Water Resources and Environmental Engineering, 5(4), 217-222.
10.APHA (2005): Standrad methods for the examination of waters and waste water analysis, 21th Edn., Washigton. D. C.
11.Tyagi S., Sharma B., Singh P., Dobhal R. (2013): Water Quality Assessment in Terms of Water Quality Index:
American Journal of Water Resources, 1(3), 34-38.
12.Abdullah- Al- Mamun,(2008): Revised water quality indices for the protection of rivers in Malaysia: Twelfth
International Water Technology Conference, 1687-1698.
13.Srivastava G., Kumar P. (2013): Water Quality Index with missing parameters: International Journal of Research
in Engineering and Technology, 2(4), 609-614.
14.Varunprasath K., Daniel N.A. (2010): Physico – chemical parameters of River Bhavani in three stations, Tamilnadu , India: Iranica Journal of Energy and Environment, 1(4), 321-325.
15.Khan I.A., Khan A.A. (1985): Physical and chemical condition in Seika Jheelat: Aligarh, Ecol, 3, 269-274. 16.Lamare R.E., Singh O.P. (2016): Seasonal Variation in Water Quality of Lukha River, Meghalaya, India: Current
World Environment, 11(1), 101-113.
17.Shah K.A., Joshi G.S. (2016): Development of Water Pollution Model: A Case Study of Mahi River Basin, Gujarat, India: Journal of Environmental Science, Toxicology and Food Technology, 10(12), 59-64.
18.Cuivillas D.A.V., Naguit M.R., Cuivillas A.M. (2016): Physico-Chemical Characterization of Layawan River:
Journal of Environmental Science, Toxicology and Food Technology, 10(6), 69-75.
19.Hariharan A.V.L.N.S.H., Purnima K.C. (2015): Studies on water samples for the Physico- chemical characteristics near Chodavaram, Visakhapatnam Dt., A.P: Journal of Chemical, Biological and Physical Sciences, 5(3), 3108-3113.
20.Yisa J., Jimoh T. (2010): Analytical Studies on Water Quality Index of River Landzu: American Journal of Applied
Sciences, 7(4), 453-458.
21.Khwakaram A.I., Majid S.N., Hama N.Y. (2012): Determination of Water Quality Index (WQI) for Qalyasan Stream in Sulaimani City/ Kurdistan Region of IraQ: International Journal of Plant, Animal and Environmental
Sciences, 2(4), 148-157.
22.Yogendra K., Puttaiah E.T. (2007): Determination of Water Quality Index and Suitability of an Urban Water body in Shimoga Town, Karnataka: Proceeding of Taal The 12th World lake Conference, 342-346.
23.Bates A.L., Orem W.H., Harvey J.W., Spiker E.C. (2002): Tracing sources of sulfur in the Florida Everglades:
Journal of Environmental Quality, 31, 287–299.
24.Roelofs J.G.M. (1991): Inlet of alkaline river water into peaty lowlands: effects on water quality and Stratiotes aloides L. stands: Aquatic Botany, 39, 267–293.
25.Yadav N.S., Sharma M.P., Kumar A., Pani S. :Water Quality Assessment of Chambal River in National Chambal Sanctuary of Madhya Pradesh: Environmental Sustainability: Concepts, Principles, Evidences and Innovations -
ISBN: 978-93-83083-75-6, 24-35.
26.Bora M., Goswami D.C. (2017): Water quality assessment in terms of water quality index (WQI): case study of the Kolong River, Assam, India: Applied Water Science, 7, 3125–3135.
27.Prasanna M.B., Panda C. (2010): Physico chemical properties of water collected from Dhamra Estuary
International Journal of Environmental Sciences, 1(3), 334-342.
28.Raja P., Amarnath M., Elengovan R. and Palanive M. (2008): Evaluation of physical and chemical parameters of River Kaveri, Tiruchirappalli, Tamilnadu, India; Journal of Environmental Biology, 29(5), 765-768.
29.Sharma V. and Walia Y.K. (20150: Water Quality Assessment Using Physico-Chemical Parameters and Heavy Metals of Gobind Sagar Lake, Himachal Pradesh (India): Current World Environment, 10(3), 967-974.