Ames Laboratory Accepted Manuscripts Ames Laboratory
7-2018
A self-contained algorithm for determination of
solid-liquid equilibria in an alloy system
L. Yang
Iowa State University and Ames Laboratory Y. Sun
Ames Laboratory Z. Ye
Ames Laboratory F. Zhang Ames Laboratory M. I. Mendelev Ames Laboratory
See next page for additional authors
Follow this and additional works at:https://lib.dr.iastate.edu/ameslab_manuscripts
Part of theMetallurgy Commons, and thePhysics Commons
This Article is brought to you for free and open access by the Ames Laboratory at Iowa State University Digital Repository. It has been accepted for inclusion in Ames Laboratory Accepted Manuscripts by an authorized administrator of Iowa State University Digital Repository. For more information, please [email protected].
Recommended Citation
Yang, L.; Sun, Y.; Ye, Z.; Zhang, F.; Mendelev, M. I.; Wang, Cai-Zhuang; and Ho, Kai-Ming, "A self-contained algorithm for determination of solid-liquid equilibria in an alloy system" (2018).Ames Laboratory Accepted Manuscripts. 200.
A self-contained algorithm for determination of solid-liquid equilibria in
an alloy system
Abstract
We describe a self-contained procedure to evaluate the free energy of liquid and solid phases of an alloy system. The free energy of a single-element solid phase is calculated with thermodynamic integration using the Einstein crystal as the reference system. Then, free energy difference between the solid and liquid phases is calculated by Gibbs-Duhem integration. The central part of our method is the construction of a reversible alchemical path connecting a pure liquid and a liquid alloy to calculate the mixing enthalpy and entropy. We have applied the method to calculate the free energy of solid and liquid phases in the Al-Sm system. The driving force for fcc-Al nucleation in Al-Sm liquid and the melting curve for fcc-Al and Al3Sm are also calculated.
Keywords
Free energy calculations, Sold-liquid equilibria, Thermodynamics integration, Alchemical path
Disciplines
Materials Science and Engineering | Metallurgy | Physics
Authors
L. Yang, Y. Sun, Z. Ye, F. Zhang, M. I. Mendelev, Cai-Zhuang Wang, and Kai-Ming Ho
A self-contained algorithm for determination of solid-liquid equilibria
in an alloy system
L. Yang a,b, Y. Sun a, Z. Ye a, F. Zhang a,*, M. I. Mendelev a, C. Z. Wang a,b, and K. M. Ho a,b,c
a Ames Laboratory, US Department of Energy, Ames, Iowa 50011, USA
b Department of Physics, Iowa State University, Ames, Iowa 50011, USA
c Hefei National Laboratory for Physical Sciences at the Microscale and Department of Physics, University of
Science and Technology of China, Hefei, Anhui 230026, China
Abstract: We describe a self-contained procedure to evaluate the free energy of liquid and solid
phases of an alloy system. The free energy of a single-element solid phase is calculated with
thermodynamic integration using the Einstein crystal as the reference system. Then, free energy
difference between the solid and liquid phases is calculated by Gibbs-Duhem integration. The
central part of our method is the construction of a reversible alchemical path connecting a pure
liquid and a liquid alloy to calculate the mixing enthalpy and entropy. We have applied the
method to calculate the free energy of solid and liquid phases in the Al-Sm system. The driving
force for fcc-Al nucleation in Al-Sm liquid and the melting curve for fcc-Al and Al3Sm are also
calculated.
Keywords: Free energy calculations, Sold-liquid equilibria, Thermodynamics integration,
Alchemical path.
* Corresponding author at: Ames Laboratory, Ames, IA, 50011, USA. E-mail address: [email protected] (F.
Zhang)
1 Introduction
Reliable free energy for both solid and liquid phases of an alloy is fundamental to achieving a
microscopic understanding of freezing and melting phenomena, which remains a significant
challenge in condensed matter physics and materials science [1]. The origin of the difficulty in
free energy calculations is that free energy cannot be expressed as a simple average of a physical
quantity over the phase space that can be conveniently evaluated in a single simulation with a
standard sampling technique, such as Monte Carlo (MC) or Molecular Dynamics (MD) [2]. A
variety of methods have been proposed for free energy calculations, emphasizing on computing
include multistage free energy perturbation [3], particle insertion/deletion [4–6], thermodynamic
integration (TI) [7], Bennett analysis [8,9], weighted histogram [10], umbrella sampling [11],
and adiabatic switching [12]. In addition to these equilibrium approaches, Jarzynski established a
nonequilibrium equality to express the free energy difference in terms of the irreversible work
along paths connecting the two systems. A path-sampling technique with the application of
umbrella sampling has been formulated to improve the convergence of the original Jarzynski
method [13], and has been applied on clusters [14], glasses [15] and crystalline alloys [16]. For
binary fluids, alternatively, people have used relatively efficient methods such as energy
partitioning method [17] and classical density-functional approach [18] to estimate the free
energy.
When selecting a specific method, one strikes a balance between efficiency and accuracy
according to the problem at hand. The main objective of the current paper is to develop a
self-contained algorithm to accurately determine the free energy of both liquid and solid phases, in
order to establish phase equilibria. The algorithm will be developed within the framework of TI,
coupled with extensive GPU-accelerated MD simulations [19,20]. TI is based on the idea that
derivatives of free energy are often well-defined ensemble averages that are measurable in a
single MC or MD simulation. In this method, one evaluates the derivative of free energy along a
reversible path connecting the reference system and a target realistic system. The integration of
the derivative along this path gives the free energy difference between the two systems [2,7].
In principle, one can obtain the absolute free energy of solid and liquid phases by referencing
to a harmonic crystal and the ideal gas, respectively, whose free energy can be analytically
derived. However, it is generally not a good idea to treat the liquid and solid phases in separate
frameworks when it is the free energy difference that controls phase stability [18]. Furthermore,
many phenomena of interest such as crystal nucleation and growth occur when the liquid
becomes supercooled, when it behaves so differently from the ideal gas that one needs to be very
careful to obtain the required accuracy by using the ideal gas as the starting point. Here, we
choose the harmonic crystal, such as the Einstein crystal [21,22] as a global initial reference
system, since it can provide a reliable reference for pure solid phases in most cases. The general
strategy is as follows: first, we calculate the absolute free energy of the solid phase directly using
and liquid phases at a specific state point; and finally, we use Gibbs-Duhem integration [23] to
extend to other state points, such that all the free energy calculations are based on the same initial
reference system. While the free energy difference at an arbitrary state point can be calculated by
methods such as pseudosupercritical path integration [24,25], in this paper, we choose a special
state point: the melting point, at which the free energy difference is zero. The accurate melting
point is determined by monitoring the migration of a solid-liquid interface.
Next, we construct an “alchemical” path to transform a pure liquid to a liquid alloy, and
apply TI to evaluate the mixing enthalpy and entropy during the process. Similar methods were
frequently used previously to analyze affinity change upon substitution of certain atoms or
functional groups in chemical or biochemical systems [26–28]. This strategy, together with a
reliable method of determining solid/liquid free energy difference in single-element systems,
forms a self-contained way of establishing phase equilibria in alloys. The algorithm is
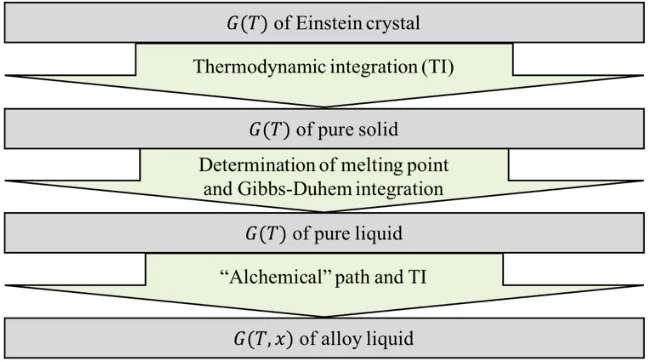
[image:5.612.153.478.360.541.2]summarized in a flowchart shown in Fig. 1.
Fig. 1. Flowchart summarizing the algorithm for our free energy calculation.
We choose the Al-Sm system for the current study, which is a typical member of Al-RE
systems (RE: rare earth). At ~10 at.% Sm, this system can form metallic glasses or
nanocomposite materials with low-density-high-strength properties [29]. The evaluation of
thermodynamic stability of relevant phases is necessary to understand the complicated phase
selection of this system especially under supercooling, which is key to achieving the desired
2 Computational details
All simulations are performed using the MD technique with a timestep of 2 fs, as
implemented in LAMMPS GPU-accelerated package [19,20]. Systems are fully equilibrated in
500,000 timesteps in canonical ensemble (𝑁𝑁𝑁𝑁𝑁𝑁) or isothermal-isobaric ensemble (𝑁𝑁𝑁𝑁𝑁𝑁) with the
Nose-Hoover thermostat [30,31]. The main purpose of performing MD simulations in this work
is to calculate the ensemble average of certain quantities (details are shown below), which is
equivalent to the temporal average under the ergodic hypothesis. The average is collected in
another 500,000 timesteps after the equilibrium is reached. For efficient energy and force
calculations, we use semi-empirical interatomic potential in the Finnis-Sinclair form [32], which
was developed to reproduce pure Al properties, energetics of Sm intermetallic alloys and
Al-Sm liquid structures [33]. This potential was particularly designed to treat Al-rich alloys (at.%
Sm < ~ 10%).
3 Pure fcc-Al and Al liquid
We start with the calculation of free energy of the fcc-Al phase with TI, using the Einstein
crystal as a reference system. The Helmholtz free energy of a classical Einstein crystal can be
determined analytically as 𝐹𝐹0 = 3𝑁𝑁𝑁𝑁𝐵𝐵𝑁𝑁ln (ℎ𝜈𝜈 𝑁𝑁⁄ B𝑁𝑁), with 𝑁𝑁 the number of atoms, ℎ the Planck
constant, 𝜈𝜈 the vibrational frequency and 𝑁𝑁B the Boltzmann constant. To implement TI, one
generates intermediate systems with potentials𝑈𝑈(𝜆𝜆) = (1− 𝜆𝜆)𝑈𝑈E+𝜆𝜆𝑈𝑈Al , where 𝑈𝑈E and
𝑈𝑈Alstand for the potentials for the Einstein crystal and the real Al system, respectively. Then, the
difference in Helmholtz free energy between the two systems can be expressed as
𝐹𝐹Al,𝑠𝑠− 𝐹𝐹0 =� 〈𝑑𝑑𝑈𝑈𝑑𝑑𝜆𝜆(𝜆𝜆)〉𝜆𝜆,𝑁𝑁𝑁𝑁𝑁𝑁𝑑𝑑𝜆𝜆 1
0 = � 〈𝑈𝑈Al− 𝑈𝑈E〉𝜆𝜆,𝑁𝑁𝑁𝑁𝑁𝑁𝑑𝑑𝜆𝜆
1
0 . (1)
In Eq. (1), the subscript 𝑠𝑠 stands for solid, and 〈⋯ 〉𝜆𝜆,𝑁𝑁𝑁𝑁𝑁𝑁 denotes the canonical ensemble
(𝑁𝑁𝑁𝑁𝑁𝑁) average of fcc-Al with respect to the intermediate potential 𝑈𝑈(𝜆𝜆). The volume is fixed at
the equilibrium volume at ambient pressure, which is determined separately via MD simulation
with the real FS potential for Al under 𝑁𝑁𝑁𝑁𝑁𝑁 conditions. In this way, the Helmholtz free energy is
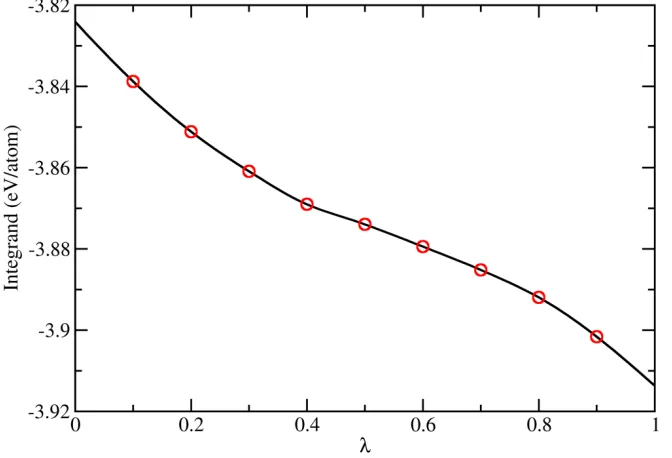
As an example, we show in Fig. 1 the integrand of Eq. (1) for the implementation of TI at
800 K. The vibrational frequency 𝜈𝜈 for the Einstein crystal is chosen to be 5 THz, which is close
to the principal peak of Al phonon density of states [34]. The integration, performed based on
cubic spline interpolation of discrete data points collected by separate MD runs (red open circles),
gives the free energy difference between fcc-Al and Einstein crystal reference Δ𝐹𝐹= −3.872
[image:7.612.132.468.217.446.2]eV/atom.
Fig. 2. The integrand of Eq. (1) for fcc Al at T = 800 K. Open circles are data points collected in separated MD runs. The solid line is a cubic spline interpolation.
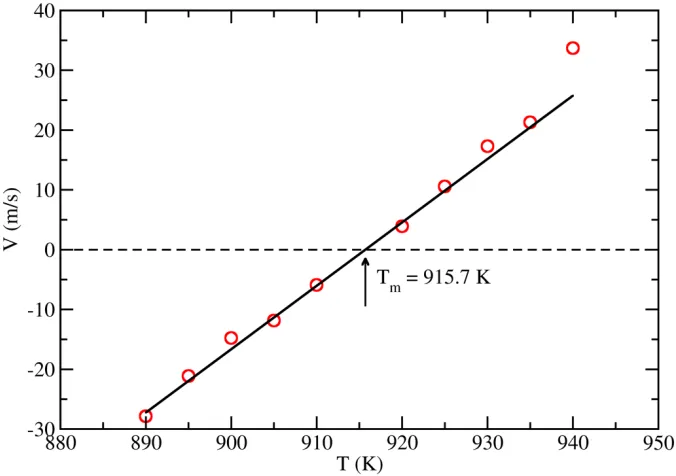
To calculate the free energy of Al liquid, we first determine the melting point (𝑁𝑁𝑚𝑚) of fcc-Al
under ambient pressure, at which the difference in Gibbs free energy between the solid and liquid
phases Δ𝐺𝐺= 0. Following the method described in Ref. [35], we plot the solid-liquid interface
(SLI) velocity, obtained from MD simulation for the [100] direction, as function of temperature
(see Fig. 3). The melting temperature determined from these data is 915.7±0.5 K, which is
slightly lower than the experimental value (933 K). The Gibbs free energy difference at other
temperatures is readily available by integrating the Gibbs-Helmholtz equation
�𝜕𝜕(Δ𝐺𝐺𝜕𝜕𝑁𝑁 �/𝑁𝑁) 𝑃𝑃 =−
Δ𝐻𝐻
where Δ𝐻𝐻 is the enthalpy change in the liquid and solid phases, or, the latent heat. The absolute
free energy for Al liquid can be obtained by combining the information on solid-liquid free
energy difference and the absolute free energy for the solid fcc-Al calculated previously. The
[image:8.612.130.468.171.409.2]final results are shown in Fig. 4.
Fig. 3. The solid-liquid interface velocity for pure Al in the [100] direction as a function of temperature.
Fig. 4. Absolute Gibbs free energy of fcc and liquid Al as a function of temperature under the ambient pressure.
[image:8.612.155.458.453.650.2]First, we introduce an auxiliary system Al1−𝑥𝑥Sm′𝑥𝑥, in which the factitious Sm′ atom has the
mass of Sm but interacts with other atoms as Al. Thus, the Hamiltonian of Al1−𝑥𝑥Sm′𝑥𝑥 can be
written as
𝐻𝐻(𝑝𝑝,𝑞𝑞) = � 2𝑝𝑝𝑚𝑚𝑖𝑖2 Al 3𝑁𝑁(1−𝑥𝑥)
𝑖𝑖=1
+�2𝑚𝑚𝑝𝑝𝑖𝑖2 Sm 3𝑁𝑁𝑥𝑥
𝑖𝑖=1
+𝑈𝑈Al(𝑞𝑞), (3)
where 𝑁𝑁 is the number of atoms in the system, 𝑚𝑚Al and 𝑚𝑚Sm are the mass for Al and Sm atoms,
respectively, and (𝑝𝑝,𝑞𝑞) refers to a point in the phase space (𝑝𝑝1,𝑝𝑝2,⋯,𝑝𝑝3𝑁𝑁,𝑞𝑞1,𝑞𝑞2,⋯,𝑞𝑞3𝑁𝑁). The
Helmholtz free energy for the liquid phase is defined as
𝐹𝐹AlSm′ = −𝑁𝑁B𝑁𝑁ln�[𝑁𝑁(1− 𝑥𝑥)]! (1 𝑁𝑁𝑥𝑥)!ℎ3𝑁𝑁� 𝑑𝑑𝑝𝑝𝑑𝑑𝑞𝑞𝑒𝑒−𝛽𝛽𝛽𝛽(𝑝𝑝,𝑞𝑞)�
=−𝑁𝑁B𝑁𝑁ln� 1
[𝑁𝑁(1− 𝑥𝑥)]! (𝑁𝑁𝑥𝑥)!Λ3𝑁𝑁Al(1−𝑥𝑥)Λ3𝑁𝑁𝑥𝑥Sm
� 𝑑𝑑𝑞𝑞𝑒𝑒−𝛽𝛽𝑈𝑈Al(𝑞𝑞)�, (4)
where 𝛽𝛽 = 1⁄𝑁𝑁B𝑁𝑁, and Λ𝛼𝛼 is the de Broglie wavelength for species 𝛼𝛼, which is defined as Λ𝛼𝛼 =
(ℎ2/2π𝑚𝑚
𝛼𝛼𝑁𝑁B𝑁𝑁)1/2. For pure Al liquid,
𝐹𝐹Al =−𝑁𝑁B𝑁𝑁ln�𝑁𝑁!1Λ Al
3𝑁𝑁� 𝑑𝑑𝑞𝑞𝑒𝑒−𝛽𝛽𝑈𝑈Al(𝑞𝑞)�. (5)
Comparing Eqn. (4) and (5), one can obtain the Helmholtz free energy difference between
Al1−𝑥𝑥Sm′𝑥𝑥 liquid and pure Al liquid:
𝐹𝐹AlSm′ − 𝐹𝐹Al =𝑁𝑁𝑁𝑁B𝑁𝑁 �32𝑥𝑥ln 𝑚𝑚Al
𝑚𝑚Sm+𝑥𝑥ln𝑥𝑥+ (1− 𝑥𝑥) ln(1− 𝑥𝑥)�. (6)
Since Al1−𝑥𝑥Sm′𝑥𝑥 liquid and pure Al liquid share the same interaction potential, the
equilibrium volume should also be the same under the same pressure. Thus, Eq. (6) also
describes the Gibbs free energy difference between the two systems (the 𝑁𝑁𝑁𝑁 term cancels out).
Next, we use TI to transform the factitious Al1−𝑥𝑥Sm′𝑥𝑥 system to the real Al1−𝑥𝑥Sm𝑥𝑥 system.
To do that, we introduce intermediate systems interacting as 𝑈𝑈(𝜆𝜆) = (1− 𝜆𝜆)𝑈𝑈Al+𝜆𝜆𝑈𝑈𝐴𝐴lSm. Then,
𝐺𝐺AlSm− 𝐺𝐺AlSm′ = � 〈𝑑𝑑𝑈𝑈𝑑𝑑𝜆𝜆(𝜆𝜆)〉𝜆𝜆,𝑁𝑁𝑃𝑃𝑁𝑁𝑑𝑑𝜆𝜆 1
0 =� 〈𝑈𝑈𝐴𝐴lSm− 𝑈𝑈Al〉𝜆𝜆,𝑁𝑁𝑃𝑃𝑁𝑁𝑑𝑑𝜆𝜆
1
0 , (7)
where 〈⋯ 〉𝜆𝜆,𝑁𝑁𝑃𝑃𝑁𝑁 stands for the isothermal-isobaric (𝑁𝑁𝑁𝑁𝑁𝑁) ensemble average with respect to the
intermediate potential 𝑈𝑈(𝜆𝜆).
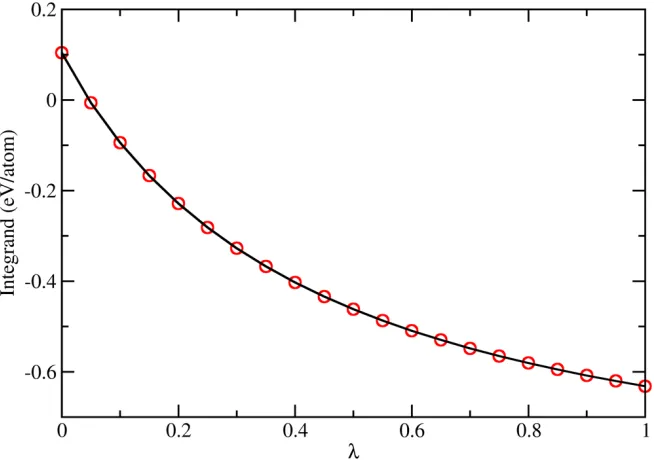
We use 𝑥𝑥= 0.25 and T = 1500 K as an example to describe the free energy calculation of
liquid Al1−𝑥𝑥Sm𝑥𝑥 alloys. The transformation from Al liquid into the factitious Al-Sm′ liquid
results in a free energy change Δ𝐹𝐹= −0.156 eV/atom, as calculated according to Eq. (6). The
implementation of TI to transform Al-Sm′ into the real Al-Sm system is shown in Fig. 5, which
gives 𝐺𝐺AlSm− 𝐺𝐺AlSm′ = −0.404 eV/atom. Thus, the net difference of Gibbs free energy between
the Al0.75Sm0.25 liquid and pure Al liquid is −0.560 eV/atom.
Fig. 5. The integrand of Eq. (7) for 𝑥𝑥= 0.25 and 𝑁𝑁= 1500 K. Open circles are data points collected in separated MD runs. The solid line is a cubic spline interpolation.
5 Applications
In the following, we demonstrate two applications of free energy calculations outlined in the
above, namely, the determinations of driving force for fcc-Al nucleation in supercooled
Al1−𝑥𝑥Sm𝑥𝑥 liquid and the melting curve for fcc-Al and Al3Sm crystals.
[image:10.612.139.466.318.550.2]Crystal nucleation in supercooled liquid is an important process in numerous areas of physical
science [36]. It is also an important factor for glass formation, since glass is formed by
suppressing crystal nucleation during fast quenching. As a marginal glass former, the glass
formability of Al-Sm has a strong dependence on the Sm concentration [37]. When as-quenched
Al-Sm glass is gradually heated, the devitrification process often starts with the deposit of Al
nanocrystals [38,39]. Thus, study of the effect of Sm concentration on Al nucleation in
supercooled Al-Sm liquids can provide useful information for both glass formation and
devitrification processes [40]. The driving force is a fundamental parameter that describes the net
bulk free energy gain upon the formation of a crystalline nucleus. For fcc-Al nucleation in
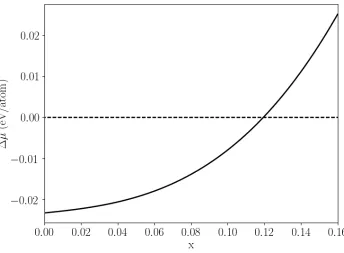
supercooled Al1−𝑥𝑥Sm𝑥𝑥 liquid, the driving force is defined as the free energy change in the liquid
system when a single fcc-Al is nucleated according to the “reaction” 𝑁𝑁Al1−𝑥𝑥Sm𝑥𝑥 →Al𝑓𝑓𝑓𝑓𝑓𝑓+
(𝑁𝑁 −1)Al1−𝑥𝑥−𝛿𝛿𝑥𝑥Sm𝑥𝑥+𝛿𝛿𝑥𝑥, where N is the total number of atoms, and 𝛿𝛿𝑥𝑥 = 𝑁𝑁−1𝑥𝑥 based on mass
conservation. Thus as 𝑁𝑁 → ∞,
Δ𝜇𝜇= 𝐺𝐺𝑠𝑠+ (𝑁𝑁 −1)𝐺𝐺𝑙𝑙(𝑥𝑥+𝛿𝛿𝑥𝑥)− 𝑁𝑁𝐺𝐺𝑙𝑙(𝑥𝑥)
= 𝐺𝐺𝑠𝑠+ (𝑁𝑁 −1)𝐺𝐺𝑙𝑙(𝑥𝑥) + (𝑁𝑁 −1)𝜕𝜕𝐺𝐺𝑙𝑙𝜕𝜕𝑥𝑥 𝛿𝛿𝑥𝑥 − 𝑁𝑁𝐺𝐺𝑙𝑙(𝑥𝑥)
= 𝑥𝑥𝜕𝜕𝐺𝐺𝑙𝑙𝜕𝜕𝑥𝑥 +𝐺𝐺𝑠𝑠 − 𝐺𝐺𝑙𝑙(𝑥𝑥), (8)
where 𝐺𝐺𝑙𝑙(𝑥𝑥) and 𝐺𝐺𝑠𝑠 refer to the Gibbs free energy per atom of Al1−𝑥𝑥Sm𝑥𝑥 liquid and fcc-Al,
respectively. In Fig. 6, we plot ∆𝜇𝜇 as a function of 𝑥𝑥 at a temperature of 700 K, where one can
see that the driving force decreases as the Sm composition increases, but remains negative within
the range of 𝑥𝑥< 0.12, showing that nucleation of fcc-Al is thermodynamically favored within
this composition range. However, it should be noted that fcc-Al is the only solid phase
considered in Fig. 6. When 𝑥𝑥 becomes large (before reaching 0.12), nucleation of other solid
Fig. 6. Driving force for nucleation of fcc-Al in 𝐴𝐴𝐴𝐴1−𝑥𝑥𝑆𝑆𝑚𝑚𝑥𝑥 liquid at 700 K as a function of the Sm composition.
5.2 Melting curve (liquidus line) for fcc-Al and 𝑨𝑨𝑨𝑨𝟑𝟑𝑺𝑺𝑺𝑺
We also perform the free-energy calculation for the hexagonal Al3Sm phase, and traced out
the melting curve (liquidus line) for both fcc-Al and Al3Sm. We focus on the technologically
important Al-rich region for this system, in which fcc-Al and Al3Sm are the only two relevant
solid phases according to the Al-Sm phase diagram [41,42]. Each coexistence point on the
melting curve (𝑥𝑥,𝑁𝑁) of a solid phase denotes a coexistence state, which satisfies
(𝑥𝑥 − 𝑥𝑥𝑠𝑠)𝜕𝜕𝐺𝐺𝑙𝑙𝜕𝜕𝑥𝑥(𝑥𝑥,𝑁𝑁)+𝐺𝐺𝑠𝑠(𝑁𝑁) =𝐺𝐺𝑙𝑙(𝑥𝑥,𝑁𝑁) (9)
where 𝐺𝐺𝑙𝑙 and 𝐺𝐺𝑠𝑠 are the Gibbs free energy of the liquid and solid phases, respectively, and 𝑥𝑥𝑠𝑠 is
the Sm composition in the solid phase. Mathematically, the coexistence composition at a specific
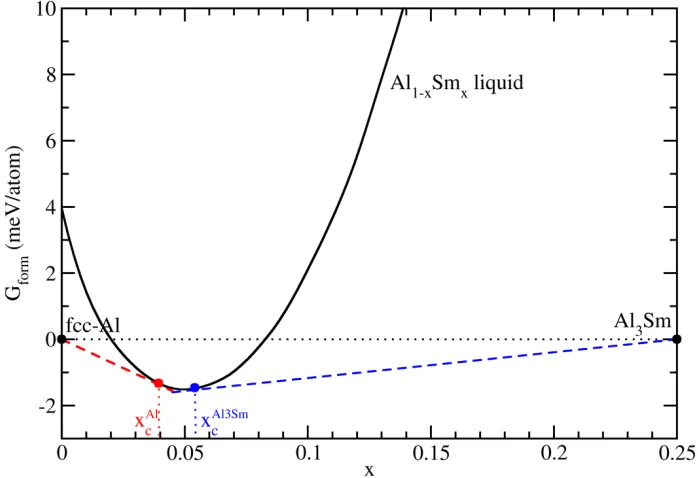
temperature can be determined by the “tangent” construction as shown in Fig. 7, in which the
formation Gibbs free energy of Al1−𝑥𝑥Sm𝑥𝑥 liquid 𝐺𝐺f is plotted as a function of the Sm
composition 𝑥𝑥, at a supercooled temperature of 880 K. 𝐺𝐺f is calculated using the Gibbs free
energy of fcc-Al and Al3Sm at the same temperature as reference states. In this way, 𝐺𝐺f for the
[image:12.612.134.478.81.334.2]phases to the liquid curve, shown as the red and blue lines in Fig. 7, respectively. From the
position of the tangential points, one can determine the coexistence liquid composition with the
two solid phases to be 0.039 and 0.054, respectively.
Fig. 7. The formation free energy of Al1−𝑥𝑥Sm𝑥𝑥 liquid, referenced to solid phases fcc-Al and Al3Sm, at 𝑁𝑁=
880 K. The smooth curve is interpolated among 26 data points at increments of 0.01 using the cubic splining technique. The red and blue lines denote the tangential lines from fcc-Al and Al3Sm to the liquid curve, respectively. The tangential points give the coexistence liquid composition with the two solid phases, respectively.
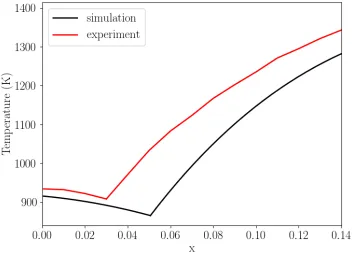
The above procedure is repeated for various other temperatures to map out the melting curve
for fcc-Al and Al3Sm, as shown in Fig. 8. Our calculations predict a eutectic point at 𝑁𝑁= 863 K
and 𝑥𝑥 = 0.051, while the eutectic point from previous experiments [41,42] is located at 𝑁𝑁= 908
K and 𝑥𝑥= 0.03. At compositions away for the calculated eutectic point, our calculations
generally underestimate the liquidus temperature by less than 100 K. Since the only energetics
data used in fitting the Al-Sm FS potential was generated by density-functional theory (DFT)
calculations at 0 K [33], we do expect some discrepancy with experiments in thermodynamic
properties at finite temperatures. In this regard, a systematic way of determining solid-liquid
phase equilibria, as outlined in the current paper, is valuable if one wants to refine a classical
[image:13.612.128.477.154.393.2]Fig. 8. Melting curve for fcc-Al and Al3Sm from experiments [41,42] and the current calculations for
𝐴𝐴𝐴𝐴1−𝑥𝑥𝑆𝑆𝑚𝑚𝑥𝑥 in the Al-rich region of the Al-Sm system.
6 Conclusions
We establish a self-contained algorithm to rigorously evaluate the free energy for solid and
liquid phases of an alloy system, based on thermodynamic integration. The algorithm starts from
calculating the free energy of a single-element solid phase by referencing to a harmonic crystal.
By monitoring the solid-liquid interface migration at different temperatures, we determine the
melting point of the solid phase, which establishes a state of equality between the solid and
liquid free energy. The free energy difference at other state points between solid and liquid
phases can be obtained by integrating ∆𝐻𝐻 𝑁𝑁⁄ 2 with temperature, where ∆𝐻𝐻 is the latent heat
during melting. Then, we generate an alchemical path connecting a pure liquid to a liquid alloy,
and use thermodynamic integration to evaluate the mixing enthalpy and entropy. As an example,
we apply this method on the Al-Sm system to determine the driving force for Al nucleation in
Al-Sm liquid and the melting curve for the solid phases Al and Al3Sm.
[image:14.612.130.482.83.337.2]This work was supported by the U.S. Department of Energy (DOE), Office of Science, Basic
Energy Sciences, Materials Science and Engineering Division, including the grant of computer
time at the National Energy Research Scientific Computing Center (NERSC) in Berkeley, CA.
The research was performed at Ames Laboratory, which is operated for the U.S. DOE by Iowa
State University under contract # DE-AC02-07CH11358. F.Z. and L.Y. also acknowledge the
support by the Laboratory Directed Research and Development (LDRD) program of Ames
Laboratory for developing software and performing computation with GPU acceleration.
Data Availability
The raw data (Al-Sm interatomic potential) required to reproduce these findings are available
to download from https://www.ctcms.nist.gov/potentials/Al.html#Al-Sm.
References
[1] J.P. Hansen, D. Levesque, J. Zinn-Justin, Liquids, Freezing, and the Glass Transition, Les
Houches session 51, North-Holland, Amsterdam, Amsterdam, 1991.
[2] D. Frenkel, B. Smit, Understanding Molecular Simulation: From Algorithms to
Application, Academic Press, 2007.
[3] R.W. Zwanzig, High-Temperature Equation of State by a Perturbation Method. I.
Nonpolar Gases, J. Chem. Phys. 22 (1954) 1420–1426. doi:10.1063/1.1740409.
[4] B. Widom, Some Topics in the Theory of Fluids, J. Chem. Phys. 39 (1963) 2808–2812.
doi:10.1063/1.1734110.
[5] I. Nezbeda, J. Kolafa, A new version of the insertion particle method for determining the
chemical potential by monte carlo simulation, Mol. Simul. 5 (1991) 391–403.
doi:10.1080/08927029108022424.
[6] M. Athènes, Computation of a chemical potential using a residence weight algorithm,
Phys. Rev. E - Stat. Physics, Plasmas, Fluids, Relat. Interdiscip. Top. 66 (2002) 14.
doi:10.1103/PhysRevE.66.046705.
[7] J.G. Kirkwood, Statistical Mechanics of Fluid Mixtures, J. Chem. Phys. 3 (1935) 300–313.
[8] C.H. Bennett, Efficient estimation of free energy differences from Monte Carlo data, J.
Comput. Phys. 22 (1976) 245–268. doi:10.1016/0021-9991(76)90078-4.
[9] N. Lu, J.K. Singh, D.A. Kofke, Appropriate methods to combine forward and reverse
free-energy perturbation averages, J. Chem. Phys. 118 (2003) 2977–2984.
doi:10.1063/1.1537241.
[10] S. Kumar, J.M. Rosenberg, D. Bouzida, R.H. Swendsen, P.A. Kollman, THE weighted
histogram analysis method for free-energy calculations on biomolecules. I. The method, J.
Comput. Chem. 13 (1992) 1011–1021. doi:10.1002/jcc.540130812.
[11] G.M.G.M.M. Torrie, J.P.J.P.P. Valleau, Nonphysical sampling distributions in Monte
Carlo free-energy estimation: Umbrella sampling, J. Comput. Phys. 23 (1977) 187–199.
doi:10.1016/0021-9991(77)90121-8.
[12] M. Watanabe, W.P. Reinhardt, Direct dynamical calculation of entropy and free energy by
adiabatic switching, Phys. Rev. Lett. 65 (1990) 3301–3304.
doi:10.1103/PhysRevLett.65.3301.
[13] G. Adjanor, M. Athènes, Gibbs free-energy estimates from direct path-sampling
computations, J. Chem. Phys. 123 (2005). doi:10.1063/1.2137698.
[14] G. Adjanor, M. Athenes, F. Calvo, Free energy landscape from path-sampling: application
to the structural transition in LJ(38), Eur. Phys. J. B. 53 (2006) 47–60. doi:DOI
10.1140/epjb/e2006-00353-0.
[15] G. Adjanor, M. Athènes, Thermodynamic modelling of glasses at atomistic scale, AIP
Conf. Proc. 999 (2008) 186–201. doi:10.1063/1.2918104.
[16] G. Adjanor, M. Athènes, J.M. Rodgers, Waste-recycling Monte Carlo with optimal
estimates: Application to free energy calculations in alloys, J. Chem. Phys. 135 (2011).
doi:10.1063/1.3610423.
[17] H. Do, J.D. Hirst, R.J. Wheatley, Calculation of Partition Functions and Free Energies of a
Binary Mixture Using the Energy Partitioning Method: Application to Carbon Dioxide
and Methane, J. Phys. Chem. B. 116 (2012) 4535–4542. doi:10.1021/jp212168f.
the melting curve of Cu-Zr binary alloys, Phys. Rev. E - Stat. Nonlinear, Soft Matter Phys.
90 (2014) 1–8. doi:10.1103/PhysRevE.90.052403.
[19] S. Plimpton, Fast Parallel Algorithms for Short-Range Molecular Dynamics, J. Comput.
Phys. 117 (1995) 1–19. doi:10.1006/jcph.1995.1039.
[20] W.M. Brown, P. Wang, S.J. Plimpton, A.N. Tharrington, Implementing molecular
dynamics on hybrid high performance computers - Short range forces, Comput. Phys.
Commun. 182 (2011) 898–911. doi:10.1016/j.cpc.2010.12.021.
[21] D. Frenkel, A.J.C. Ladd, New Monte Carlo method to compute the free energy of arbitrary
solids. Application to the fcc and hcp phases of hard spheres, J. Chem. Phys. 81 (1984)
3188–3193. doi:10.1063/1.448024.
[22] M. de Koning, A. Antonelli, Einstein crystal as a reference system in free energy
estimation using adiabatic switching, Phys. Rev. E. 53 (1996) 465–474.
doi:10.1103/PhysRevE.53.465.
[23] D.M. Eike, E.J. Maginn, Atomistic simulation of solid-liquid coexistence for molecular
systems: Application to triazole and benzene, J. Chem. Phys. 124 (2006).
doi:10.1063/1.2188400.
[24] G. Grochola, Constrained fluid λ-integration: Constructing a reversible thermodynamic
path between the solid and liquid state, J. Chem. Phys. 120 (2004) 2122–2126.
doi:10.1063/1.1637575.
[25] D.M. Eike, J.F. Brennecke, E.J. Maginn, Toward a robust and general molecular
simulation method for computing solid-liquid coexistence, J. Chem. Phys. 122 (2005).
doi:10.1063/1.1823371.
[26] T.P. Straatsma, J.A. McCammon, Multiconfiguration thermodynamic integration, J. Chem.
Phys. 95 (1991) 1175–1188. doi:10.1063/1.461148.
[27] A. Blondel, Ensemble variance in free energy calculations by thermodynamic integration:
Theory, optimal “Alchemical” path, and practical solutions, J. Comput. Chem. 25 (2004)
985–993. doi:10.1002/jcc.20025.
Affinity Prediction with pmemdGTI: An Efficient Implementation of GPU-Accelerated
Thermodynamic Integration, J. Chem. Theory Comput. 13 (2017) 3077–3084.
doi:10.1021/acs.jctc.7b00102.
[29] N. Wang, Y.E. Kalay, R. Trivedi, Eutectic-to-metallic glass transition in the Al–Sm
system, Acta Mater. 59 (2011) 6604–6619. doi:10.1016/j.actamat.2011.07.015.
[30] W.G. Hoover, Canonical dynamics: Equilibrium phase-space distributions, Phys. Rev. A.
31 (1985) 1695.
[31] G.J. Martyna, M.L. Klein, M. Tuckerman, Nosé–Hoover chains: The canonical ensemble
via continuous dynamics, J. Chem. Phys. 97 (1992) 2635–2643.
doi:doi:http://dx.doi.org/10.1063/1.463940.
[32] M.W. Finnis, J.E. Sinclair, A simple empirical N-body potential for transition metals,
Philos. Mag. A. 50 (1984) 45–55.
[33] M.I. Mendelev, F. Zhang, Z. Ye, Y. Sun, M.C. Nguyen, S.R. Wilson, C.Z. Wang, K.M.
Ho, Development of interatomic potentials appropriate for simulation of devitrification of
Al90Sm10 alloy, Model. Simul. Mater. Sci. Eng. 23 (2015).
doi:10.1088/0965-0393/23/4/045013.
[34] M. Kresch, M. Lucas, O. Delaire, J.Y.Y. Lin, B. Fultz, Phonons in aluminum at high
temperatures studied by inelastic neutron scattering, Phys. Rev. B - Condens. Matter
Mater. Phys. 77 (2008) 1–9. doi:10.1103/PhysRevB.77.024301.
[35] S.R. Wilson, K.G.S.H. Gunawardana, M.I. Mendelev, Solid-liquid interface free energies
of pure bcc metals and B2 phases Solid-liquid interface free energies of pure bcc metals
and B2 phases, 134705 (2016). doi:10.1063/1.4916741.
[36] K.F. Kelton, A.L. A. L. Greer, Nucleation in condensed matter: application in materials
and biology, Elsevier, Amsterdam, 2010.
[37] A. Inoue, Amorphous, nanoquasicrystalline and nanocrystalline alloys in Al-based
systems, Prog. Mater. Sci. 43 (1998) 365–520.
[38] P. Rizzi, M. Baricco, S. Borace, L. Battezzati, Phase selection in Al-TM-RE alloys:
doi:10.1016/S0921-5093(00)01537-9.
[39] Z. Ye, F. Zhang, Y. Sun, M.I. Mendelev, R.T. Ott, E. Park, M.F. Besser, M.J. Kramer, Z.
Ding, C.-Z. Wang, K.-M. Ho, Discovery of a metastable Al20Sm4 phase, Appl. Phys. Lett.
106 (2015) 101903. doi:10.1063/1.4914399.
[40] G.B. Bokas, L. Zhao, J.H. Perepezko, I. Szlufarska, On the role of Sm in solidification of
Al-Sm metallic glasses, Scr. Mater. 124 (2016) 99–102.
doi:10.1016/j.scriptamat.2016.06.045.
[41] V.I. Kononenko, S. V. Golubev, On phase diagrams for binary systems of aluminium with
la ce p, Izv. Akad. Nauk SSSR, Met. (1990) 197–199.
[42] A. Saccone, G. Cacciamani, D. Maccio, G. Borzone, R. Ferro, D. Macciò, G. Borzone, R.
Ferro, Contribution to the study of the alloys and intermetallic compounds of aluminium
with the rare-earth metals, Intermetallics. 6 (1998) 201–215.