Middlesex University Research Repository
An open access repository of
Middlesex University research
http://eprints.mdx.ac.uk
Harzing, Anne-Wil ORCID: https://orcid.org/0000-0003-1509-3003 (2014) A longitudinal study of Google Scholar coverage between 2012 and 2013. Scientometrics, 98 (1). pp. 565-575.
ISSN 0138-9130
Final accepted version (with author’s formatting)
This version is available at:http://eprints.mdx.ac.uk/14504/
Copyright:
Middlesex University Research Repository makes the University’s research available electronically.
Copyright and moral rights to this work are retained by the author and/or other copyright owners unless otherwise stated. The work is supplied on the understanding that any use for commercial gain is strictly forbidden. A copy may be downloaded for personal, non-commercial, research or study without prior permission and without charge.
Works, including theses and research projects, may not be reproduced in any format or medium, or extensive quotations taken from them, or their content changed in any way, without first obtaining permission in writing from the copyright holder(s). They may not be sold or exploited commercially in any format or medium without the prior written permission of the copyright holder(s).
Full bibliographic details must be given when referring to, or quoting from full items including the author’s name, the title of the work, publication details where relevant (place, publisher, date), pag-ination, and for theses or dissertations the awarding institution, the degree type awarded, and the date of the award.
If you believe that any material held in the repository infringes copyright law, please contact the Repository Team at Middlesex University via the following email address:
The item will be removed from the repository while any claim is being investigated.
A longitudinal study of Google Scholar
coverage between 2012 and 2013
Anne-Wil Harzing
Version January 2013
To be published in Scientometrics in 2013 or 2014
Copyright © 2012-2013 Anne-Wil Harzing. All rights reserved.
Prof. Anne-Wil Harzing Email: [email protected] University of Melbourne Web: www.harzing.com Department of Management & Marketing
Faculty of Business & Economics Parkville Campus
1 | P a g e
A LONGITUDINAL STUDY OF GOOGLE SCHOLAR
COVERAGE BETWEEN 2012 AND 2013
ANNE-WIL HARZING
University of Melbourne
Department of Management and Marketing Parkville Campus, Victoria 3010, Australia Tel: +61 3 8344 3724, E-mail:
ABSTRACT
Harzing (2013) showed that between April 2011 and January 2012, Google Scholar has very signifi-cantly expanded its coverage in Chemistry and Physics, with a more modest expansion for Medi-cine and a natural increase in citations only for Economics. However, we do not yet know whether this expansion of coverage was temporary or permanent, nor whether a further expansion of cov-erage has occurred. It is these questions we set out to respond in this research note.
2 | P a g e
A LONGITUDINAL STUDY OF GOOGLE SCHOLAR
COVERAGE BETWEEN 2012 AND 2013
INTRODUCTION
Despite a growing concern about the potentially perverse impact of research evaluation and uni-versity rankings (see e.g. Marginson, 2007; Adler & Harzing, 2009), most universities and academ-ics world-wide are now subject to increased monitoring and evaluation of research outputs. Many university rankings and government research assessments use bibliometric indicators, drawing on either the Web of Science or Scopus database, rather than peer review. This might be problematic for the Social Sciences as the Web of Science and Scopus do not generally cover citations in books, book chapters, or conference papers. Journal coverage in these databases is also dramatically lower in the Social Sciences than in the Sciences. For instance, Kousha & Thelwall (2007) found that around 77% (49 of 64) of their selected journals in science disciplines, but only 13% (6 of 44) of social science journals were indexed in the Web of Science.
In this short research note, we will therefore assess to what extent Google Scholar, which includes publications and citations in any academic outlet, can be used as an alternative source of citation data. Google Scholar does not offer the authority structure or transparency of coverage that librar-ians and bibliometriclibrar-ians expect from a scientific information resource. However, it might well be of considerable use for individual academics interested in citation analysis, as well as higher level bibliometric analyses such as government research assessments. In this research note, we report on a longitudinal study of Google Scholar coverage for a select group of 20 Nobel Prize winners in Chemistry, Economics, Medicine and Physics. There are a large number of prior studies that have studied Google Scholar coverage at one particular point in time (for a comprehensive overview see Harzing, 2013). However, to the best of our knowledge, there have been no prior studies that in-vestigated the stability of Google Scholar coverage on a longitudinal basis.
The only exception is our earlier study (Harzing, 2013) using the same sample of Nobel Prize win-ners. In that study, we showed that between April 2011 and January 2012, Google Scholar had very significantly expanded its coverage in Chemistry and Physics, with a more modest expansion for Medicine. For Economics, the average monthly citation increase found over the nine months was similar to the increase in ISI citations, hence confirming our earlier observations (Harzing & van der Wal, 2008) that Google Scholar had a competitive advantage in the Social Sciences. The expansion of Google Scholar coverage for the Sciences and Medicine between April 2011 and Jan-uary 2012 is very encouraging. However, we do not yet know whether this expansion of coverage was temporary or permanent, nor whether a further expansion of coverage has occurred. It is the-se questions we the-set out to respond in this rethe-search note.
METHODS
Sample
3 | P a g e
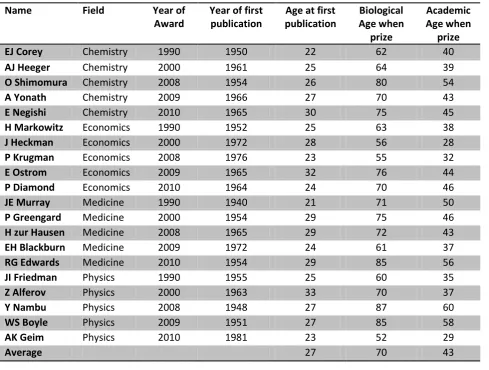
unless this Nobelist had a particularly common name. Our final sample of Nobelists is shown in Table 1, listing name, field, year of award, and the year of their first publication. Our sample repre-sents a very wide range of publication ages, with the year of first publication ranging from 1940 to 1981. Hence, our sample is very suitable to assess Google Scholar coverage. Table 1 also shows that on average Nobelists started to publish in their late twenties and received their Nobel Prize around the age of seventy, after more than four decades of academic activity.
Table 1: List of Nobel Prize winners included in our study
Name Field Year of
Award Year of first publication publication Age at first Age when Biological prize
Academic Age when
prize
EJ Corey Chemistry 1990 1950 22 62 40
AJ Heeger Chemistry 2000 1961 25 64 39
O Shimomura Chemistry 2008 1954 26 80 54
A Yonath Chemistry 2009 1966 27 70 43
E Negishi Chemistry 2010 1965 30 75 45
H Markowitz Economics 1990 1952 25 63 38
J Heckman Economics 2000 1972 28 56 28
P Krugman Economics 2008 1976 23 55 32
E Ostrom Economics 2009 1965 32 76 44
P Diamond Economics 2010 1964 24 70 46
JE Murray Medicine 1990 1940 21 71 50
P Greengard Medicine 2000 1954 29 75 46
H zur Hausen Medicine 2008 1965 29 72 43
EH Blackburn Medicine 2009 1972 24 61 37
RG Edwards Medicine 2010 1954 29 85 56
JI Friedman Physics 1990 1955 25 60 35
Z Alferov Physics 2000 1963 33 70 37
Y Nambu Physics 2008 1948 27 87 60
WS Boyle Physics 2009 1951 27 85 58
AK Geim Physics 2010 1981 23 52 29
Average 27 70 43
Data sources
The main data source used in this article is Google Scholar. Google Scholar is not without its critics. Jacsó’s many studies (see e.g. Jacsó 2010) have documented serious doubts about the level of ac-curacy of citation counts in Google Scholar. However, recent large-scale investigations of Google Scholar accuracy (e.g, the LSE project on impact in the Social Sciences, 2011, and Harzing, 2013) suggest that the level of accuracy, stability and comprehensiveness displayed by Google Scholar is sufficient for broad-level comparisons. Google Scholar on its own is not very suitable for biblio-metric analyses. Therefore, Publish or Perish (Harzing, 2007) was used to collect citation data from Google Scholar. Publish or Perish is a software program that retrieves and analyses academic cita-tions. It uses range of citation metrics in a user-friendly format. The results can also be exported to Excel, an option that was used to perform various calculations and create the graphs in this note.
4 | P a g e
titles. Publications included in the h-index were verified individually to ensure they were published by the Nobelist in question. Any publications with substantial stray records were merged, especial-ly if they were on the index threshold. The merging process did not substantialespecial-ly change the h-index. In most cases it stayed the same, for half a dozen Nobelists it increased or decreased by one. The verification and merging process was surprisingly quick, thanks to the flexible user inter-face of Publish or Perish, that allows sorting publications by author, year, title, source and publish-er, and performs a publication merge with a simple drag and drop. The whole process took well under half an hour for most Nobelists and, because of the learning effect, took even less time for the repeat searches. Only Nobelists with namesakes in other disciplines required a bit more time.
Measures
In order to test the stability of Google Scholar coverage over time, we collected the total number of citations, the g-index and the h-index for each of our 20 Nobelists every month between Janu-ary 2012 and JanuJanu-ary 2013. As in Harzing (2013), we chose the total number of citations as the most comprehensive measure of citation impact and the h-index as the best indication of the number of publications that had achieved a significant impact. The h-index is defined as follows: “A scientist has index h if h of his/her Np papers have at least h citations each, and the other (Np – h) papers have no more than h citations each” (Hirsch 2005, p. 16 569).
The g-index (Egghe, 2006) was added for this note as it provides a useful compromise between the h-index and the total numbers of citations by taking the excess citations over and above what is needed for a publication to be included in the h-index into account. The g-index is defined as fol-lows: “Given a set of articles ranked in decreasing order of the number of citations that they re-ceived, the g-index is the (unique) largest number such that the top g articles received (together) at least g2 citations.” The g-index might be particularly useful for Nobel Prize winners as the works
for which they received their Nobel Prize are generally very highly cited, which would not be properly recognized by the h-index.
As all three metrics only changed incrementally over the months, we only report 5 data points in this paper, looking at our data in quarterly intervals. If Google Scholar coverage was stable over time, we would not expect to find a decline in citations, the g-index or the h-index over the five time periods, nor find huge increases over time. Of course, a modest increase in the h-index and g-index and a more noticeable increase in the total number of citations are to be expected over a 12-month period for a group of high-performing researchers.
RESULTS
For ease of understanding, we present our results mainly in graphs. For each metric (h-index, g-index and total citations), we present the results per discipline over the year (January 2012 to Jan-uary 2013) and then focus on the five Nobelists in one particular discipline to illustrate the results in more detail. For the total number of citations, we contrast the results in two different disci-plines. We also include tables with the proportional increase in the h-index, the g-index and the total number of citations over the course of our one year data collection period.
H-index
5 | P a g e
Figure 1: Average increase in h-index for Chemistry, Economics, Medicine and Physics between Jan-12 and Jan-13.
However, as Figure 2 shows the discipline average hides substantial differences within each disci-pline in terms of the size of the h-index. Elias Corey and Alan Heeger have h-indices that are three to three and a half times as high as Ada Yonath. However, all five Nobelists in Chemistry show an increase in h-index over the year that we monitored, although the increase is more substantial for some than for others. This was also the case for all the Nobelists in the other three disciplines.
Figure 2: Increase in h-index for Nobelists in Chemistry between Jan-12 and Jan-13.
6 | P a g e
Table 2: Proportional increase in h-index over the year
Field Jan-12 to
Apr-12 Apr-12 to Jul-12 Jul-12 to Oct-12 Oct-12 to Jan-12 Jan-12 to Jan-13
Chemistry 3.2% 0.7% 3.9% 1.0% 9.1%
Economics 3.2% 1.7% 2.7% 1.2% 9.1%
Medicine 0.9% 1.0% 2.2% 0.0% 4.2%
Physics 1.4% 1.1% 4.4% 1.0% 8.1%
Total 2.2% 1.1% 3.3% 0.8% 7.6%
G-Index
Figure 3 shows that, like the h-index, the g-index also increases monotonously over the year for each of the four disciplines. Two of the four disciplines, Chemistry and Medicine, show very similar g-indices, with Economics Nobelists having the largest average g-index. As with the h-index, Physi-cists on comparison have a lower g-index.
Figure 3: Average increase in g-index for Chemistry, Economics, Medicine and Physics between Jan-12 and Jan-13.
7 | P a g e
Figure 4: Increase in g-index for Nobelists in Economics between Jan-12 and Jan-13.
Table 3 shows that – just as for the h-index – the increase in g-index was larger for every discipline in the first and the third quarter than in the second and the fourth quarter. For the year as a whole, Medicine and Economics show a smaller increase than Chemistry and Physics. It must be noted though the increase for Physics is substantially due to Andre Geim, who has shown a spec-tacular increase in citations (see next section) over the year. Without this Nobelist the average in-crease for Physics is 9.2%, close to the inin-crease for Chemistry. The larger inin-crease for Chemistry and Physics for a metric that is more sensitive to an increase in citations than the h-index does suggest that Google Scholar coverage for these disciplines might still be increasing. We will come back to this in the next section.
Table 3: Proportional increase in g-index over the year
Field Jan-12 to
Apr-12 Apr-12 to Jul-12 Jul-12 to Oct-12 Oct-12 to Jan-12 Jan-12 to Jan-13
Chemistry 2.9% 0.9% 4.8% 0.8% 9.7%
Economics 1.8% 1.2% 2.2% 1.2% 6.7%
Medicine 1.6% 0.9% 1.8% 0.7% 5.2%
Physics 1.9% 1.6% 6.7% 1.2% 11.9%
Total 2.1% 1.1% 3.9% 1.0% 8.3%
Total citations
8 | P a g e
Figure 5: Average increase in total citations for Nobelists in Chemistry, Economics, Medicine and Physics between Jan-12 and Jan-13.
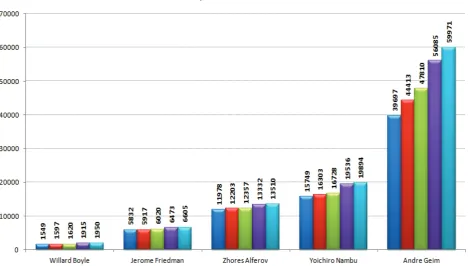
As Figures 6 and 7 show, there is considerably variance within disciplines with the most highly cit-ed Nobelists (Greengard and Geim) having ten times as many citations as the lesser citcit-ed Nobelists. So even within our group of high-performing academics, there are substantial differ-ences in terms of citation impact. As for the h-index and the g-index, nearly all of our 20 Nobelists showed an increase in citations over the yearlong monitoring period. The only exception was Ada Yonath, who “lost” a highly cited paper in the 2nd quarter due to a Google Scholar parsing error. However, her natural citation increase meant that at the end of the yearlong period her total cita-tions had reverted back to the level at the beginning of the data collection period.
9 | P a g e
Figure 7 shows that Andre Geim was the only exception to the pattern of a gradual increase in ci-tations. His citations increased by 20,000 in a year, a 50% increase. He is the youngest Nobelist in our sample (52 versus an average of 70) and received his Nobel Prize after less than three decades of publishing (average 43). This means that he is still in the steep upward stage of his career.
Figure 7: Increase in total citations for Nobelists in Physics between Jan-12 and Jan-13.
Table 4 shows that, as for the h-index and the g-index, total citations show a stronger increase in the first and third quarter than in the second and fourth quarter. This is true for every discipline. The overall increase over the year is fairly similar for Chemistry, Economics and Medicine. Physics shows a higher increase, but again much of this is due to Geim’s steep upward trajectory. Without this Nobelist, the citation increase for Physics is similar to that of the other disciplines.
Table 4: Proportional increase in citations over the year
Field Jan-12
Apr-12 Apr-12 Jul-12 Oct-12 Jul-12- Oct-12 Jan-13 Jan-12 Jan-13 crease Jan-12 Monthly in-to Jan-13
Monthly in-crease Apr-12 to
Jan-12
Chemistry 4.7% 1.4% 9.8% 1.4% 18.4% 1.5% 6.1%
Economics 7.1% 2.6% 3.0% 2.6% 16.0% 1.3% 1.5%
Medicine 3.9% 3.6% 4.2% 1.2% 13.4% 1.1% 2.3%
Physics 4.4% 2.9% 13.5% 2.8% 25.9% 2.2% 3.8%
Total 5.0% 2.6% 7.6% 2.0% 18.4% 1.5% 3.4%
10 | P a g e
Google Scholar vs ISI
As reported in Harzing (2013), in January 2012 the total number of Google Scholar citations was higher than total the number of Web of Science citations for all but three of our Nobelists, all in Chemistry (Heeger, Negishi & Corey). For Heeger, the difference was marginal, for Negishi & Co-rey, however, the differences were substantial. We therefore verified whether there had been an improvement in Google Scholar coverage for these three Nobelists. This turned out to be the case. One year later, in January 2013, GS citations are now 6% higher than ISI citations for Heeger. For Negishi GS citations are still 4% lower than ISI citations, but this presents a strong improvement on the 27% lower GS citation level a year before. For Corey, GS citations are still 26% lower than ISI citations, but even this is an improvement on the 39% lower GS citation level in January 2012. Between April 2011 and January 2013 Corey’s Google Scholar citations have increased from 33,561 to 69,004. In April 2011 GS citations only amounted to 36% of his ISI citations; in January 2013 they reached 74% of his ISI citations. Looking at Corey’s top-20 publications only, GS citations were on average 39% lower than ISI citations in January 2012; in January 2013 they were on aver-age only 18% lower. The biggest shortfall of GS citations occurred to papers published in ACS or Elsevier journals in the 1950s, 1960s and early 1970s, more recent papers and papers in other journals show comparable coverage in the two databases.
DISCUSSION AND CONCLUSION
Our results indicated that, between January 2012 and January 2013, Google Scholar reported con-tinuous, but modest increases in the h-index, g-index and citations for our sample of 20 Nobelists. There was only one exception: one of our Nobelists (Ada Yonath) “lost” a highly cited paper through a Google Scholar parsing error. Although this didn’t influence her h-index, it did lead to a decline in g-index and citations. Overall, the number of Google Scholar citations over the one year period increased by approximately 1.5% per month for our sample, less than half of the monthly increase of the April 2011 to January 2012 period in our previous study (Harzing, 2013).
For the field of Economics, the average monthly increase was fairly similar across the two periods. However, for Medicine, the average monthly increase halved from 2.3% to 1.1%. Physics and Chemistry showed a very strong monthly increase in the April 2011 to January 2012 period, 6.1% and 3.8% respectively. However, between January 2012 and January 2013, Chemistry reverted to the overall average monthly increase of 1.5%, whereas the slightly higher than average monthly increase for Physics was solely due to Andre Geim’s meteoric rise in citations. In fact, the overall monthly increase in Google Scholar citation is now similar to the monthly increase for ISI citations that was reported in our previous study (Harzing, 2013). Hence, it is reasonable to conclude that after a period of significant expansion, Google Scholar coverage is now increasing at a fairly stable rate.
11 | P a g e
In spite of its unique contribution in studying Google Scholar citations on a longitudinal basis, our study has a number of limitations that provide useful suggestions for further research. First, it only included 20 academics. Although this was sufficient for our purposes, a larger sample of academics might enable us to draw more accurate conclusions. Second, although we covered four distinct disciplines (Chemistry, Economics, Medicine and Physics), disciplines not covered in this study, such as Engineering, the Social Sciences beyond Economics and the Humanities might display dif-ferent citation profiles. Third, although Nobel Prize winners were very suitable for our current purpose, they are a special group of academics. In order to establish whether Google Scholar is suitable for broader research evaluation purposes, we need to include “ordinary” academics in our sample. This would also counteract the only remaining problem we encountered in our current study: the lower coverage of articles published in the 1950s and 1960s and early 1970s. Academics currently employed in universities are more likely than Nobelists to have started publishing after this period. Finally, although our previous study (Harzing, 2013) included a longitudinal compari-son with ISI data, we do not yet know how Scopus compares with Google Scholar and ISI from a longitudinal perspective. To accommodate these four limitations, we have initiated a comparative longitudinal analysis of GS, ISI and Scopus coverage over the period of a year for some 150 aca-demics of a large research intensive university.
In spite of the limitations of the current study, our data seem to suggest that - after a period of significant expansion for Chemistry and Physics - Google Scholar coverage is now increasing at a stable rate. A comparison with ISI citation data also showed that, with the exception of a single Nobelist, Google Scholar also provides comprehensive coverage for four distinct disciplines. The increased stability and coverage might make Google Scholar much more suitable for research evaluation and bibliometric research purposes than it has been in the past.
REFERENCES
Egghe, L. (2006). Theory and practice of the g-index, Scientometrics, 69(1): 131-152. Harzing, A.W. (2007). Publish or Perish, available from http://www.harzing.com/pop.htm.
Harzing, A.W.; Wal, R. van der (2008). Google Scholar as a new source for citation analysis?, Ethics in Science and Environmental Politics, 8(1): 62-71.
Harzing, A.W. (2013) A preliminary test of Google Scholar as a source for citation data: A longitu-dinal study of Nobel Prize winners, Scientometrics, DOI 10.1007/s11192-012-0777-7.
Hirsch, J.E. (2005) An index to quantify an individual’s scientific research output. Proceedings of the National Academy of Science USA 102: 16569–16572
Jacsó, P. (2010). Metadata mega mess in Google Scholar, Online Information Review, 34(1): 175 – 191.
Kousha, K.; & Thelwall, M. (2007). Google Scholar Citations and Google Web/URL Citations: A Mul-ti-Discipline Exploratory Analysis, Journal of the American Society for Information Science and Technology, 58(7): 1055-1065.
London School of Economics and Political Science. (2011). Impact of the social sciences: Maximiz-ing the impact of academic research. Available online at: