Turkish Journal of Fisheries and Aquatic Sciences 18: 457-462 (2018)
www.trjfas.org ISSN 1303-2712 DOI: 10.4194/1303-2712-v18_3_11
RESEARCH PAPER
© Published by Central Fisheries Research Institute (CFRI) Trabzon, Turkey in cooperation with Japan International Cooperation Agency (JICA), Japan
Species Identification Using DNA Barcoding on Processed Panga Catfish
Products in Viet Nam Revealed Important Mislabeling
Introduction
Mislabeling seafood products can represent an economic fraud and may lead to potential health risks for consumers (http://www.cbc.ca/news/mislabelling-means-rare-fish-sold-marketplace-1.919822). A commonly economic fraud is for instance the commercialization of a low-priced species using the name of a high-priced species (Hellberg and Morrissey, 2011). The use of a false or misleading name may affect the ability of processors and consumers to make accurate assessments of the potential safety hazards associated with seafood. In fact, hazards such as allergenic proteins and scombrotoxin formation are associated with some species but not others, presenting potential food safety risks if the food is not accurately labeled (http://www.foodsafetynews.com/2012/12/seafood-fraud-public-health-threat-or-economic-trick). It has been reported that seafood products were abundantly mislabeled in the world (Carvalho et al., 2010; Filonzi et al., 2010; Barbuto et al., 2010) but this occurrence of seafood mislabeling has not been studied in Viet Nam to our knowledge.
Fish species can be identified from unprocessed products based on external morphological characteristics, such as body shape, number of fins or scales, texture or filet colors. However, it is often difficult for consumers to accurately determine fish
species from processed products since the morphological features changed after processing. In addition, the identification of fish species based on DNA analysis usually encounters some difficulties due to a large size of genome or genetic variation. To date, many molecular markers have been studied and effectively used as a tool for identification of fish species (Ward et al., 2009). Such markers should be ideally highly conserved in the same species within different populations and should be also clearly different among species. DNA barcoding is a potential approach for such an identification of fish species as it is widely used for studies of the genetic diversity and the classification of species characterized by morphological similarities (Hebert et al. 2003). The core assumption of DNA barcoding is that the nucleotide sequence similarities are lower within a species than between different species (Meyer and Paulay, 2005). Typically, mitochondrial genome genes are often used for DNA barcoding. The mitochondrial genome has a higher rate of mutations compared to the nuclear genome, it is maternally inherited with less hybridization and a higher copy number, facilitating PCR amplification and sequence recovery from degraded tissue (Saccone et al., 1999; Hebert et al., 2004). Furthermore, mitochondrial genome genes lack introns, pseudogenes and repetitive sequences facilitating sequence alignments of the amplified genes (Lin et al., 2005). Finally,
Tran Thi Thuy Ha
1,*, Nguyen Thi Huong
1, Nguyen Phuc Hung
1, Yann Guiguen
11 Research Institute for Aquaculture No 1, Centre for Aquaculture Biotechnology, Bac Ninh, Viet Nam
* Corresponding Author: Tel.: 84.241 3842383; E-mail: [email protected]
Received 07 June 2017 Accepted 24 July 2017
Abstract
Nucleotide sequences of the Cytochrome oxidase subunit I gene and Cytochrome b were analyzed for Ö10 processed fish products collected from supermarkets in Hanoi, Viet Nam. The similarity between our results and published data from the NCBI and BOLD was compared to identify species. This molecular analysis showed that the common names of only 4 of these products matched with their corresponding scientific names. The other six were mislabeled with an important mislabeling from P. hypophthalmus into P. boucourti. Although no commercial frauds were found in these mislabelled products, the correct scientific names of fish species should be labelled for the processed products as they are in supermarkets.
many complete mitochondrial DNA genome sequences are publicly available and primers can therefore be designed to amplify and sequence mitochondrial genes in any species with a published mtDNA genome (Folmer et al., 1994).
DNA barcoding could be used to monitor the illegal trade of wildlife, such as protected or endangered species as well as identify the species origin of commercially processed food (Dawnay et al., 2007; Marko et al., 2004). Until now, a number of studies have shown the applicability of DNA barcoding for accurate identification of a wide range of fish species (Ward et al., 2005; Ward et al., 2009; Hubert et al., 2008). Besides, the combination of some genes for identified species becomes the prefered method. Nicole et al. (2012) identified species from fish processed products based on three distinct mitochondrial genes (16S-rDNA, COI and Cytb). Among the classical DNA barcoding mitochondrial markers used for animal species, the COI gene, which encodes for the cytochrome oxidase subunit I, was considered as a suitable marker because its mutation rate is often fast enough to distinguish closely related species and also its sequence is conserved among conspecifics. The the cytb sequence encoding Cytochrome b, shows considerable variation and allows for the differentiation of even closely related species due to its relatively high interspecies variation and low intraspecies variation (Mackie and others 1999; Aranishi and others 2005a).
The present study aimed at using COI and Cytb genes to identify fish species in some processed seafood products available in markets in Vietnam.
The DNA of 37 seafood products, including raw processed products or frozen and fillet products were extracted successfully. Genes were amplified with an average length of 700 bp for COI; 500 bp for 16S-rDNA and 850 bp for the Cytb. Results showed that 16 seafood products were correctly labeled based on the results obtained with these three gene markers, 12 samples were correctly labeled with two gene markers and 5 samples were correctly labeled with only one gene marker.
Materials and Methods
Processed Fish Products
Twenty samples from ten processed fish products were collected from two well-known supermarkets, namely Big C Long Bien and Aeon Mall Long Bien in Hanoi, Viet nam. These products were labeled in the supermarkets as being processed from the following species: Pangasius hypophthalmus, Pangasius bocourti, Prionace glauca and Oncorhynchus mykiss (Table 1). The processed products, which had been frozen at -20° C at the supermarkets, were labelled with both common and scientific names. Details of names of these products, their processing method and origin is presented in Table 1.
DNA Extraction
Total genomic DNA was extracted from the 20 samples, using the DNeasy mericon Food Kit (Qiagen, Germany) according to the manufacturer’s
Table 1. Main information of 20 samples from 10 processed fish products collected in supermakets in Viet Nam
No Code of
sample Name of product
Scientific name of
fish Processing method Origin
1 CCV1, CCV2 Ball of ground and
roasted Pangasius bocourti Pangasius bocourti
Fish ground and
roasted Vietnam
2 TL1, TL2
Ball of ground and Roasted Pangasius bocourti
with dill
Pangasius bocourti Fish ground and
Roasted with dill Vietnam
3 CQ1, CQ2
Ground and roasted Pangasius hypophthahalmus with
cinnamon
Pangasius hypophthahalmus
Fish ground and Roasted with
cinnamon
Vietnam
4 KC1, KC2 Dry fillet of Pangasius hypophthahalmus
Pangasius
hypophthahalmus Fish filleted and dry Vietnam
5 CC1, CC2 Ground and grilled Pangasius
bocourti Pangasius bocourti
Fish ground and
grilled Vietnam
6 LB1, LB2
Fillet of Pangasius hypophthahalmus rolled with
flour
Pangasius hypophthahalmus
Fish filleted and rolled
with flour Vietnam
7 VB1, VB2 Ball of ground Pangasius
bocourti Pangasius bocourti Fish ground and boiled Vietnam
8 FB1, FB2 Burger of Pangasius bocourti Pangasius bocourti Fish ground and
roasted Vietnam
9 CH1, CH2 Roll of roasted Oncorhynchus mykiss
Oncorhynchus mykiss
Fish filleted, rolled
intrusctions. After extraction, the quantity and quality of DNA was determined using 0.8% argarose gel and Nanodrop 2000C (Thermo Scientific, Country).
Amplification of COI and Cytb Genes
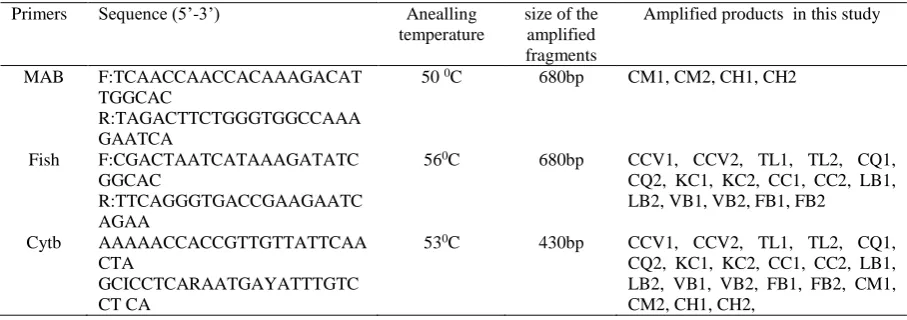
To amplify the COI genes, we used MAB primers (MAB F and MAB R) and FISH primers as described in Badhul Haq et al. (2012) and Ward et al. (2005) and the primers designed by Russell et at. (2000) and Wolf et at. (2000) were used for the Cytb genes (Table 2)
PCR reactions were carried out with a total volume of 25 µl, including 3 μl of DNA (100 ngl-1),
0.5 μl of 100 mM Tris HCl (pH 8.3), 0.5 μl of 500 mM KCl (pH 8.3), 2.5 μl of MgCl2 (25 mM), 1.0 μl of
dNTPs (5 mM), 0.5 µl of each forward and reverse primers (10 pm μl-1 per primer), and 1 u μl-1 Taq
Polymerase. The cycling conditions were: 94 0C for 2
min; 35 cycles at 94 0C for 50 s; 50-56 °C for 50 s; 72 °C for 1 min ; 72 °C for 10 min and kept at 4 °C.
Amplification reaction was performed on PCR Mastercycler Pro S (Manufacturer, Place, Country).
Sequences of COI and Cytb Genes
PCR products were analyzed on 2% agarose gels by electrophoresis. Before the sequencing step, all products were purified by using ExpinTM PCR SV kit
(GeneAll). Then, the qualified PCR products were sequenced using the Bigdye Terminator v3.1 Cycle Sequencing kit at First BASE Laboratories, Malaysia. The solution (10 µl) for reaction contained 4.94 µl of pure water, 1.94 µl of BigDye buffer 5 × (400mm Tris HCl pH 9.0 and 10 mM MgCl2), 0.12 µl of Bigdye
Terminator and 1 µl of an ExoSAP product. Then, the bidirectional analysis of sequence on Applied Biosystems machine was carried out. Genomelab software was used to analyse DNA sequences and gene sequences were checked using TV Finch 1.4.0 software (http://www.geospiza.com). ClustalW program implemented in BioEdit was used to compare the sequences.
Identification of the Fish Species
Species identification was based on sequence comparisons with reference gene sequences in the GenBank database using BLASTn program. Homologous sequences were compared with reference sequences using the following parameters: Coverage (coverage of the length of the comparing sequence), E-value (reliability of the homology) and Identity (homologous comparison between two sequences). In additional, we also used the BOLD database (The Barcode of Life Data System) to determine the accuracy for identifying species using as threshold for non-similarity nucleotide sequences, which were less than 1% (Ratnasingham et al., 2007).
Results
PCR
PCR products showed that the bands were relatively clear and sharp (Figure 1&2). Moreover, the bands of all samples were in the range of 500 bp and 700 bp as described by Ward et al. (2005) and Badhul Haq et al. (2012).
Identification of the Fish Species
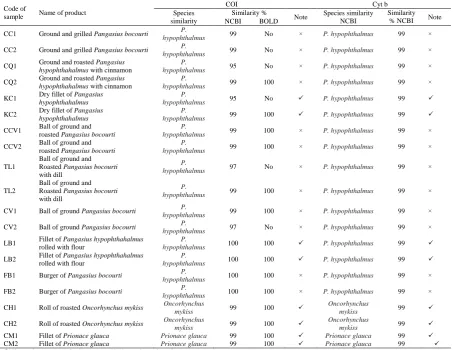
A broad species identification of the studied prossesed products was developed based on BOLD and NCBI databases. Most of the identified fishes could be verified from the present database. The summarised form of the fish identification of cytochrome oxidase I and cytochrome b gene sequences of the 20 different products is shown (Table 3).
Discussion
Our results showed that 20 samples from 10 different processed fish products have a great similarity when compared on the NCBI and BOLD. These products include ground and roasted P.
Table 2. Characteristics of primers
Primers Sequence (5’-3’) Anealling
temperature
size of the amplified fragments
Amplified products in this study
MAB F:TCAACCAACCACAAAGACAT
TGGCAC
R:TAGACTTCTGGGTGGCCAAA GAATCA
50 0C 680bp CM1, CM2, CH1, CH2
Fish F:CGACTAATCATAAAGATATC
GGCAC
R:TTCAGGGTGACCGAAGAATC AGAA
560C 680bp CCV1, CCV2, TL1, TL2, CQ1,
CQ2, KC1, KC2, CC1, CC2, LB1, LB2, VB1, VB2, FB1, FB2
Cytb AAAAACCACCGTTGTTATTCAA
CTA
GCICCTCARAATGAYATTTGTC CT CA
530C 430bp CCV1, CCV2, TL1, TL2, CQ1,
hypophthahalmus with cinnamon (CQ2), dry fillet of P. hypophthahalmus (KC2), ball of ground and roasted P. bocourti (CCV1, CCV2), ball of ground and roasted P. bocourti with dill (TL2), ball of ground P. bocourti (VB1), fillet of P. hypophthahalmus rolled with flour (LB1, LB2), ball of ground P. bocourti (FB1, FB2), roll of roasted Oncorhynchus mykiss (CH1, CH2), fillet of Prionace glauca (CM1, CM2). Both samples of ground and grilled P.bocourti (CC1, CC2) were not found on the BOLD database, however, the analysis on the NCBI of these samples showed a relatively high similarity (99%). In addition, the sequences of Cytb of 20 samples confirmed our results with the COI gene. Hence, the accuracy of these analysis results could be acceptable to identify the species.
In the present study, 7 samples (KC2, LB1, LB2, CH1, CH2, CM1, CM2) from 4 processed fish products were labeled correctly based on the high similarity to GeneBank reference COI and Cytb (99% to 100% when compared on NCBI and 100% when compared on BOLD). However, 12 samples (CC1, CC2, CQ1, CQ2, CCV1, CCV2, VB1, VB2, TL1, TL2, FB1, FB2) from 6 processed fish products presented differences iwith their GenBank references suggesting that these products were mislabeled. Even if our sampling size (20 samples) is not large enough to account for significant percentage this represent an overall percentage of 60% of mislabeled products suggesting a very large scale mislabeling of these fish
products.
Incorrect labeling were mostly detected within the Pangasius catfish family and most mislabelling were found in P. hypophthalmus products mislabeled as P. bocourti. In fact, the price of P.bocourti catfish is cheaper than that of P. hypophthalmus catfish. Therefore, commercial fraud issues for processed fish products can be eliminated in the present study. The mislabeling of these products could be due instead to simple confusion between names of these two fish species. Producers might not accurately check the scientific name of the raw fish materials before processing them and unintentionally confuse their names. Mislabeling has been reported in many countries and markets. Carvalho et al. (2010) revealed that 80% of the surubim (Pseudoplatystoma spp.) whole fish fillet products sold in the Brazilian market was mislabeled. To solve that problem this country had published a formal list of common names of fish species used in processed products (Carvalho et al., 2011).
DNA barcodes have been used to identify fish species in numerous products made from different species, such as tuna (Terol et al., 2002), cod (Espineira et al., 2008), anchovy (Jérôme et al., 2008) and shark (Barbuto et al., 2010). Filonzi et al. (2010) have used DNA barcode for COI and cytb genes in some catfish products and showed that 32% of these fish products were mislabeled, including 26% of errors with closely related species. Their conclusion
Figure 1. PCR products using Fish primer (left) and MAB primer (right).
* Number 1 to 10: PCR products of samples CCV1, CCV2, TL1, TL2, CQ1, CQ2, KC1, KC2, CC1, CC2, respectively. Number 11 to 20: products of samples LB1, LB2, VB1, VB2, FB1, FB2, CH1, CH2, CM1 and CM2, respectively. M: Marker, 100bp
500bp
100bp
Figure 2. PCR products using Cytb primers.
was that the commercial fraud on these products was high (~ 42%).
Conclusion
Analysis and comparison of sequence of COI and Cytb gene fragments with the NCBI gene references and the BOLD databases showed that 40% of processed fish products were correctly labeled while 60% of the total processed fish products have been recorded as mislabeled. Most of the mislabeling products were due to confusion of scientific names between P. bocourti and P. hypophthalmus and no commercial frauds were found. These finding suggest that it is necessary to better determine fish species in the processed products and to help transformers and producers to correctly label their fish-processed products.
Acknowledgement
This study was conducted with the financial support from the national project “Research on the
development and application of DNA barcoding on catfish (Pangasianodon hypophthalmus)” funded by Ministry of Agriculture and Rural Development, Viet Nam.
References
Badhul, H.M.A., Azarudeen, M. D., Vignesh, R., Kumar, A. T.T. & Srinivasan, M. (2012). Identification and intra species delineation of ornamental silver pompano Trachinotus blochii (Lacépède, 1801) with DNA barcodes. International Research Journal of Biochemistry and Bioinformatics 3: 26-36.
http://www.interesjournals.org/IRJBB
Barbuto, M., Galimberti, A., Ferri, E., Labra, M., Malandra, R., & Galli, P. (2010). DNA barcoding reveals fraudulent substitutions in shark seafood products: The Italian case of “palombo” (Mustelus spp.). Food Research International, 43, 376-381. http://dx.doi.org/10.1016/j.foodres.2009.10.009 Carvalho, D.C., Neto, D.A., Brasil, B.S., & Oliveira, D.A.
(2011). DNA barcoding unveils a high rate of mislabeling in a commercial freshwater catfish from Brazil. Mitochondrial DNA 22(1): 97-105. http://dx.doi.org/10.3109/19401736.2011.588219 Table 3. Identification of fish species by the analysis of COI and Cytb genes and comparison the similarity to NCBI and BOLD databases
Code of
sample Name of product
COI Cyt b
Species similarity
Similarity %
Note Species similarity NCBI
Similarity % NCBI Note NCBI BOLD
CC1 Ground and grilled Pangasius bocourti P.
hypophthalmus 99 No × P. hypophthalmus 99 ×
CC2 Ground and grilled Pangasius bocourti P.
hypophthalmus 99 No × P. hypophthalmus 99 ×
CQ1 Ground and roasted Pangasius hypophthahalmus with cinnamon
P.
hypophthalmus 95 No × P. hypophthalmus 99 ×
CQ2 Ground and roasted Pangasius hypophthahalmus with cinnamon
P.
hypophthalmus 99 100 × P. hypophthalmus 99 ×
KC1 Dry fillet of Pangasius hypophthahalmus
P.
hypophthalmus 95 No P. hypophthalmus 99
KC2 Dry fillet of Pangasius hypophthahalmus
P.
hypophthalmus 99 100 P. hypophthalmus 99
CCV1 Ball of ground and roasted Pangasius bocourti
P.
hypophthalmus 99 100 × P. hypophthalmus 99 ×
CCV2 Ball of ground and roasted Pangasius bocourti
P.
hypophthalmus 99 100 × P. hypophthalmus 99 ×
TL1
Ball of ground and Roasted Pangasius bocourti with dill
P.
hypophthalmus 97 No × P. hypophthalmus 99 ×
TL2
Ball of ground and Roasted Pangasius bocourti with dill
P.
hypophthalmus 99 100 × P. hypophthalmus 99 ×
CV1 Ball of ground Pangasius bocourti P.
hypophthalmus 99 100 × P. hypophthalmus 99 ×
CV2 Ball of ground Pangasius bocourti P.
hypophthalmus 97 No × P. hypophthalmus 99 ×
LB1 Fillet of Pangasius hypophthahalmus rolled with flour
P.
hypophthalmus 100 100 P. hypophthalmus 99
LB2 Fillet of Pangasius hypophthahalmus rolled with flour
P.
hypophthalmus 100 100 P. hypophthalmus 99
FB1 Burger of Pangasius bocourti P.
hypophthalmus 100 100 × P. hypophthalmus 99 ×
FB2 Burger of Pangasius bocourti P.
hypophthalmus 100 100 × P. hypophthalmus 99 ×
CH1 Roll of roasted Oncorhynchus mykiss Oncorhynchus
mykiss 99 100
Oncorhynchus
mykiss 99
CH2 Roll of roasted Oncorhynchus mykiss Oncorhynchus
mykiss 99 100
Oncorhynchus
mykiss 99
CM1 Fillet of Prionace glauca Prionace glauca 99 100 Prionace glauca 99 CM2 Fillet of Prionace glauca Prionace glauca 99 100 Prionace glauca 99 “” shows the same species between analysis results and products.
Dawnay, N., Ogden R., McEwing R., Carvalho G.R., & Thorpe R.S., (2007). Validation of the barcoding gene COI for use in forensic genetic species identification.
Forensic Sci. Intl. 173, 1-6.
http://dx.doi.org/10.1016/j.forsciint.2006.09.013 Espineira, M., Nerea González-Lavín, N., Vieites, J.M., &
Santaclara, F. (2008). Development of a method for the genetic identification of flatfish species on the basis of mitochondrial DNA sequences. Journal of Agriculture and Food Chemistry, 56, 8954-8961. http://dx.doi.org/10.1021/jf800570r
Filonzi, L., Chiesa. S., Marina V., & Francesco N.M. (2010). Molecular barcoding reveals mislabeling of commercial fish products in Italy. Food Research International Volume 43, Issue 5, June 2010, Pages 1383-1388.
http://dx.doi.org/10.1016/j.foodres.2010.04.016 Folmer, O., Black, M., Hoeth, W., Lutz R., & Vrijenhoek,
R. (1994). DNA primers for amplification of mitochondrial cytochrome c oxidase subunit I from diverse metazoan invertebrates. Molecular Marine Biology and Biotechnology Journal 3, 294-299. https://vi.scribd.com/document/261688092/
Hebert, P.D.N., Cywinska, A., Ball, S.L., & de Waard, J.R. (2003). Biological identifications through DNA barcodes. Proceedings of the Royal Society of London. Series B: Biological Sciences 270, 313-321. https://doi.org/10.1098/rspb.2002.2218
Hebert, P.D.N., Stoeckle, M.Y., Zemlak, T.S., & Francis, C.M. (2004). Identification of birds through DNA barcodes. PLOS Biology, 2, 1657-1663. http://dx.doi.org/10.1371/journal.pbio.0020312 Hellberg, R.S., & Morrissey, M.T. (2011). Advances in
DNA-based techniques for the detection of seafood species substitution on the commercial market Part B: Biological Sciences 270, 313-322. http://dx.doi.org/10.1016/j.jala.2010.07.004
Hubert, N., Hanner, R., Holm, E., Mandrak, N.E., Taylor, E., Burridge, M., & Bernatchez, L. (2008). Identifying Canadian freshwater fishes through DNA barcodes. PLOS One 3 (6), 2490.
http://dx.doi.org/10.1371/journal.pone.0002490 Jérôme, M., Martinsohn, J. T., Ortega, D., Carreau, P.,
Verrez -Bagnis, V., & Mouchel, O. (2008). Toward fish and seafood traceability: Anchovy species determination in fish products by molecular markers and support through a public domain database. Journal of Agriculture and Food Chemistry, 56, 3460-3469. http://dx.doi.org/10.1021/jf703704m
Lin, W.F., Shiau, C.Y., & Hwang, D.F. (2005). Identification of four Thunnus tuna species using mitochondrial cytochrome b gene sequence and PCR-RFLP analysis. Journal of Food Drug Analysis, 13, 382-387.
https://www.researchgate.net/publication/282736365 Marko, P.B., Lee, S.C., Rice, A.M., Gramling, J.M.,
Fitzhenry, T.M., McAlister, J.S., Harper, G.R., & Moran, A.L. (2004). Mislabeling of a depleted reef fish. Nature, 430, 309-310.
http://dx.doi.org/10.1038/430309b
Meyer, C.P., & Paulay G. (2005). DNA barcoding: error rates based on comprehensive sampling. PLOS Biology, 3, 422.
http://dx.doi.org/10.1371/journal.pbio.0030422 Nicole, S., Negrisolo, E., Eccher, G., Mantovani, R.,
Patarnello, T., Erickson, D.L., Kress, W.J., & Barcaccia, G. (2012). DNA Barcoding as a Reliable Method for the Authentication of Commercial Seafood Products. Smithsonian Institution, P.O. Box 37012, Washington, DC 20013-7012, USA. http://www.academia.edu/23602217/
Ratnasingham, S., & Hebert, P.D.N. (2007). BOLD: The Barcode of Life Data system. Molecular Ecology Notes, 7, 355-36.
https://www.ncbi.nlm.nih.gov/pmc/articles/PMC18909 91/
Saccone, C., De Carla, G., Gissi, C., Pesole, G., & Reynes, A. (1999). Evolutionary genomics in Metazoa: the mitochondrial DNA as a model system. Gene, 238, 195-210.
http://dx.doi.org/10.1016/S0378-1119(99)00270-X Terol, J., Mascarell, R., Fernandez-Pedrosa, V., &
Perez-Alonso, M. (2002). Statistical validation of the identification of Tuna species: Bootstrap analysis of mitochondrial DNA sequences. Journal of Agriculture and Food Chemistry, 50, 963-969. http://dx.doi.org/10.1021/jf011032o Wallace, L.J., Boilard, S.M.A.L., Eagle, S.H.C., Spall, J.L., Shokralla, S.,
& Hajibabaei, M. (2012). DNA barcodes for everyday life: routine authentication of Natural Health Products. Food Research International 49(1), 446-452. http://dx.doi.org/10.1016/j.foodres.2012.07.048 Ward, R.D., Hanner, R., & Hebert, P.D.N. (2009). The
campaign to DNA barcode all fishes, FISH-BOL. Journal of Fish Biology, 74, 329-356. http://dx.doi.org/10.1111/j.1095-8649.2008.02080.x. Ward, R.D., Zemlak, T. S., Innes, B. H., Last, P. R. &
Hebert, P. D. (2005). DNA barcoding Australia’s fish species. Philosofical Transactions of the Royal Society B, 360, 1847-1857.
http://dx.doi.org/10.1098/rstb.2005.1716