Małgorzata Mulak
1, A, D, E, Anna Cicha
2, B, C, D, Kamil Kaczorowski
1, D, E, G,
Bartłomiej Markuszewski
1, D, G,, Marta Misiuk-Hojło
1, FUsing Spectralis and Stratus Optical Coherence
Tomography Devices to Analyze the Retinal Nerve
Fiber Layer in Patients with Open-Angle Glaucoma
– Preliminary Report
Analiza grubości warstwy włókien nerwowych siatkówki
u pacjentów z jaskrą otwartego kąta za pomocą Spektralnego OCT
i OCT Stratus – doniesienie wstępne
1 Department and Clinic Ophthalmology, Wroclaw Medical University, Poland 2 Department of Basic Technical Problems, Wroclaw University of Technology, Poland
A – research concept and design; B – collection and/or assembly of data; C – data analysis and interpretation;
D – writing the article; E – critical revision of the article; F – final approval of article; G – other
Abstract
Background. During the study at the Ophthalmology Clinic of Wroclaw Medical University retinal nerve fiber layer (RNFL) thickness was examined in 35 patients with open-angle glaucoma.
Objectives. The aim of the study was to analyse RNFL thickness measurements by 2 different optical coherence tomography (OCT)devices.
Material and Methods. The study group consisted of 35 patients with open-angle glaucoma (aged 48–76 years, including 20 women and 15 men – 70 eyes) with intraocular pressure below 19 mm Hg, treated pharmacologically. The subjects were examined using a Stratus Time Domain OCT (TD-OCT), produced by Zeiss, and a Spectralis Spectral Domain OCT (SD-OCT), manufactured by Heidelberg Engineering. The OCT examination was carried out with both devices on the same day in random order.
Results. The study shows that the results obtained using the 2 devices are correlated, although the average mea-surements of RNFL thickness were lower for the Spectralis OCT in comparison with those taken by the Stratus OCT. The strongest correlation was found for the temporal and nasal quadrants.
Conclusions. The study results using the Spectralis OCT and Stratus OCT are similar, but not identical, so follow-up tests should be performed on the same apparatus as in the initial testing. Considering the new generation of apparatus and the more precise measurement algorithm, the results obtained using the Spectralis SD-OCT seem more accurate (Adv Clin Exp Med 2013, 22, 6, 831–837).
Key words: glaucoma, RNFL (retinal nerve fiber layer), Spectralis OCT, Stratus OCT.
Streszczenie
Wprowadzenie. W Klinice Okulistyki Uniwersytetu Medycznego we Wrocławiu zbadano 35 pacjentów z jaskrą otwartego kąta pod kątem grubości warstwy włókien nerwowych siatkówki (RNFL).
Cel pracy. Analiza grubości RNFL mierzonych za pomocą 2 urządzeń OCT.
Materiał i metody. Zbadano 35 pacjentów z jaskrą otwartego kąta w wieku 48–76 lat (w tym 20 kobiet, 15 mężczyzn) za pomocą TD-OCT Stratus firmy Zeiss oraz SD-OCT Spektralnego firmy Heidelberg Engineering. Wykonano badania OCT obydwoma aparatami, tego samego dnia, w kolejności losowej.
Wyniki. Wyniki badań wskazują, że rezultaty uzyskane za pomocą 2 aparatów są ze sobą skorelowane, jednak średnie grubości RNFL były mniejsze w przypadku Spektralnego OCT w porównaniu z OCT Stratus.
Adv Clin Exp Med 2013, 22, 6, 831–837 ISSN 1899–5276
ORIGINAL PAPERS
The term glaucoma refers to a group of diseases whose common characteristic is progressive dam-age of the optic nerve. Glaucomatous da mdam-age to the optic nerve and retinal nerve fiber n II around the disc reflects morphological thinning of the ret-inal nerve-ring and the expansion cavity, mainly in a vertical direction [1]. Optical coherence to-mography (OCT) has been used in the diagnosis and monitoring of the progression of glaucoma because it makes it possible to conduct an objec-tive and non-invasive topographic analysis of the optic nerve, quantitative measurements of the ret-inal nerve fiber layer (RNFL) and macular thick-ness measurements across the macula. A single valid result is not sufficient for an analysis of nerve fiber layer thickness to have prognostic value; the dynamics in the long term follow-up tests are also important [2, 3]. When analyzing the progression of glaucomatous damage, one should note that re-ductions in the thickness of RNFL and the occur-rence of defects in the visual field do not take place simultaneously. It has been revealed that there is a strong correlation between the result (um) and the resulting visual field in patients with open-an-gle glaucoma RNFL thickness. This occurs when the value of pattern standard deviation (PSD) is greater than or equal to 1.9 and the average thick-ness of RNFL is less than 70 [4].In the earlier stag-es of glaucomatous damage a relatively satisfactory field of vision may be accompanied by varying de-grees of loss of RNFL thickness. Analyzing chang-es in the RNFL thicknchang-ess has been proven to be effective in monitoring the progression of glauco-matous damage [2, 3].
The Stratus time domain OCT (TD-OCT) is a device that modernized the diagnosis of retinal diseases. RNFL thickness is measured on the hori-zontal retinal image around a circle with a diame-ter of 3.4 mm cendiame-tering on the optic nerve disc. The device’s computer program analyzes the test body within the retinal macula, and the nerve fiber layer, including the optic disc (in relation to a normative database). Theparameters of the device allow im-aging with a resolution of 8–10 µm, by using a lu-minescent diode as light source with a wavelength of 820 nm and a power equal to 750 µm [1, 2].
The Spectralis spectral domain OCT (SD- -OCT) is a device that combines the possibilities of OCT and fluorescein as well as indocyanine green angiography. SD-OCT technology provides faster scanning (up to 100 ×), with improved axial
resolution (up to 2 ×) compared with TD-OCT, as well as the possibility of spatial 3D scans. The ca-pability to track eye movement with the eye-track-ing software is a great advantage. The spectral to-mography method is not only very sensitive, but also provides a greater margin of safety and allows more than10 min of scanning the same area of the retina per day [1, 2, 5, 6].
Objectives
The aim of the study was to compare measure-ments of the nerve fiber layer (RNFL) in patients with open-angle glaucoma using a Spectralis OCT (manufactured by Heidelberg Engineering) and a Stratus OCT (produced by Zeiss).
Material and Methods
In the period from January through April 2012, 35 patients (including 20 women and 15 men – 70 eyes) with open-angle glaucoma, being treat-ed pharmacologically at the Outpatient Glaucoma Clinic of Wroclaw Medical University, underwent OCT examinations with both a Spectralis OCT and a Stratus OCT. The study group was composed of patients aged 48–76 years, with a mean age of 67 years, whose intraocular pressure was below 19 mm Hg, with a cup-to-disc ratio from 0.5 to 0.7. A visual field test was performed using the Hum-phrey Perimeter (Threshold Test Central 24-2, the Sita-Fast strategy), where the MD < –6 dB. The Spectralis OCT and Stratus OCT tests were per-formed on the same day in random order. The RNFL thickness measurements and normative classifications of RNFL thickness were used for the analysis. All the analyses were performed using MedCalc software (version 12.2.1); p < 0.05 was es-tablished as the level of statistical significance.
To compare RNFL values, 1 scan was per-formed on each machine (the Spectralis and Stratus OCTs), including the global average value and the average value in the individual quadrants. Of the 2 scans made with each machine, the best scan was selected in terms of signal strength and the mini-mum number of motion artifacts. Student’s T-test was used on dependent samples to compare the RNFL measurements made by the Spectralis and Stratus OCTs. A Bland-Altman graph was drawn
to assess the agreement between the 2 devices. The same method was used for the analysis of the mean values in the different quadrants. In order to deter-mine the relationship between the Spectralis OCT and Stratus OCT measurements, a Pearson corre-lation analysis was carried out.
Results
The average RNFL thickness in patients with open-angle glaucoma, according to the Spectra-lis SD-OCT apparatus and the Stratus TD-OCT
amounted to 88.1 ± 13.5 microns and 94.5 ± 15.0 microns. Fig. 1 shows the results.
The linear regression formula of the equation y = 0.755 x + 15.405 (the solid line) is compared with the formula y = x (the dotted line). Pearson’s correlation coefficient for the mean RNFL thick-ness between the two devicesis 0.958. The mea-surements of the medium thickness of the retinal nerve fiber layer (RNFL) in 35 patients are shown in Fig. 1. In order to detect the correspondence be-tween the Spectralis and Stratus machines, a Bland-Altman chart was used; however, there is little sys-tematic difference (Fig. 2). The difference between
Fig. 1. A scatter plot of the measurements of the average retinal nerve fiber layer (RNFL) measurements performed on 35 patients. The average RNFL thickness measurements with Spectralis OCT were plotted for comparison with Stratus OCT measurements. The equation of linear regression y = 0.755 x + 15.405 (red line)) was compared with the y = x formula (black line). Pearson’s correlation coefficient is 0.958 (p < 0.05)
Ryc. 1. Wykres rozrzutu pomiarów średniej grubości warstwy włókien nerwowych siatkówki (RNFL) wykonanych u 35 osób. Wyniki pomiarów średniej grubości RNFL oznaczone Spektralnym OCT naniesiono na wykres w celu porównania z pomiarami wykonanymi Stratus OCT. Wzór równania liniowej regresji y = 0,755 x + 15,405 (linia czer-wona) został porównany z wzorem y = x (linia czarna). Współczynnik korelacji Pearsona – 0,958 (p < 0,05)
Fig. 2. A Bland-Altman plot of RNFL thickness measurements indicating the similarity of the measurements per-formed with a Spectralis OCT and a Stratus OCT. The differential between the measurements (RNFL thickness mea-sured by Stratus OCT minus RNFL thickness meamea-sured with Spectralis OCT) has been overlaid on the background of the average measurements made by two devices (RNFL thickness measured with Stratus OCT plus RNFL thickness measured with Spectralis OCT). The equality line (the red line) has been plotted with a 95% compliance limit (the black line)
the Stratus and Spectralis measurements is related to the thickness of the RNFL. In the case of thinner RNFL layers, the Stratus OCT measurements were generally lower than those made with the Spectra-lis OCT, whereas for thicker RNFL layers, the re-sults obtained using the Stratus OCT were found to be higher than those obtained using the Spec-tralis SD-OCT. Basically, the SpecSpec-tralis SD-OCT measurements are thicker in the case of “glauco-matous” nerve fiber layers, and thinner in the case of “normal” nerve fiber layers.
Fig. 2 shows the differences between the mea-surements by Spectralis and Stratus devices com-pared with their average. For the average RNFL there is a highly significant linear relationship between the “Stratus minus Spectralis” differentials and RNFL thickness (p < 0.001, linear regression test for non-zero slope). Further study revealed that the average RNFL variation around the regression line is consis-tent with the scale of RNFL thickness (Fig. 2).
Table 1 shows the following: RNFL thickness for the Spectralis and Stratus OCT devices in differ-ent quadrants; the difference between RNFL thick-ness as measured by Stratus OCT and by Spectra-lis OCT in different quadrants (mean ± SD); the p-value for the test dependent samples and Pear-son’s correlation. The Stratus OCT results corre-late well with those obtained from the Spectralis OCT. The highest linear correlation was for the nasal and temporal quadrants.
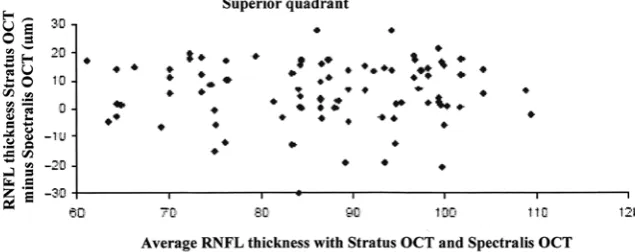
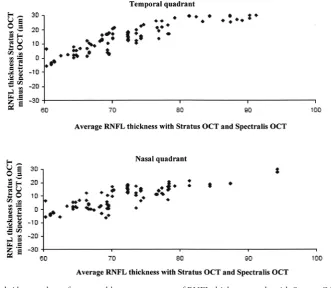
Fig. 3 (A, B) and 4 (C, D) present separate Bland-Altman plots for each of the quadrants for the study group. The more linear relationship be-tween the Stratus and Spectralis OCTs in the nasal and temporal quadrants should be noted, in con-trast to the upper and lower quadrants. This is most likely associated with the thinner retinal quadrants.
Discussion
The authors of many studies emphasize the usefulness of both the Stratus and Spectralis OCTs in the diagnosis and treatment of glaucoma. Chang et al. [7] believe that the sensitivity and the accu-racy of RNFL analysis using yet another device – a Cirrus OCT are excellent and equivalent to those of the Stratus OCT.
The results of the present study show that mea-surements of RNFL thickness taken with the Spec-tralis SD-OCT spectral correlate well with the re-sults of the Stratus TD-OCT, although they are not identical examinations. The average RNFL thick-ness in patients with open-angle glaucoma was lower when measured by the Spectralis SD-OCT compared with measurements by the Stratus TD-OCT, which is consistent with the results of other authors [3, 8–10]. Knight et al. analyzed the results of 130 eyes (healthy patients and those with open-angle glaucoma), in which RNFL thickness measurements were performed using a Spectra-lis OCT and Stratus OCT; a significant linear re-lationship was noted between the devices, but for the Stratus OCT examination yielded lower values for thinner fibers than the Spectralis OCT for thin-ner fibers, and higher values for thicker fibers [8]. Similar correlations were observed in the present study. Each patient was examined on the same day with both devices. The differences between the re-sults from the 2 devices can be explained by differ-ences in the hardware and software. The segmen-tation algorithms in the 2 machines are different; the Spectralis is set to locate the bottom part of the nerve fiber layer, while the Stratus attempts to lo-cate the top layer of ganglion cells. Another possi-ble explanation for the differences in the thickness measurements is the difference in the measure-ment of visible blood vessels that cross the RNFL
Table 1. Retinal nerve fiber layer (RNFL) measurement results for the Stratus and Spectralis OCTs in different quadrants
Tabela 1. Wyniki pomiarów RNFL dla Stratus i Spektralnego OCT w poszczególnych kwadrantach
Stratus Spectralis P-value Mean differences Pearson correlation AvgT µm 86.62 81.46 < 0.001 5.15 ± 6.06 0.958
Savg µm 103.04 94.73 < 0.001 8.31 ± 9.94 0.958 Iavg µm 103.92 96.92 0.001 7.00 ± 7.94 0.967 Navg µm 69.58 61.04 0.029 8.54 ± 11.55 0.881 Tavg µm 69.5 73.58 < 0.001 4.08 ± 8.83 0.916
or the fact that the Spectralis OCT has a lower smoothening ability than Stratus, which can some-times cause a transition to the next layer, and this results in thicker samples [8].
Due to the fact that there is no external vali-dation of the measurements made with the 2 de-vices (i.e. histology or manual segmentation), it is impossible to determine which device is more accurate. With the results of the optic nerve disc, SD-OCT reproducibility seems to be higher, be-cause the measured area is always in the same po-sition (the internal fixation cross), as opposed to being manually determined while the patient may move or change position each time [8].
In a study involving 104 people (including 28 with open-angle glaucoma, 40 with suspect-ed glaucoma and 36 healthy subjects), Bourne et al. demonstrated that global RNFL thickness was thinner in measurements carried out using a Stra-tus OCT than those taken with an OCT 2000 (both tests were performed on the same day) [10].
Vizzzeri et al. studied 16 healthy subjects (32 eyes) and 39 patients (78 eyes) using a SD OCT and a TD OCT; the correlations between RNFL pa-rameters were strong, especially for RNFL average thickness [11].
Monteiro et al. compared RNFL thickness in 18 patients with peri-nerve disc atrophy and in 18 healthy patients using earlier and later versions of the same apparatus: the OCT-1 and the OCT-3. The RNFL measurements made by the OCT-3 were lower than those made by the OCT-1 for almost all parameters in the eyes with peri-nerve disc atro-phy, and the mean results for the overall temporal quadrants and healthy eyes. The authors empha-sized that researchers should be aware of these dif-ferences when comparing the values obtained with the different versions of the hardware [12].
Kim et al. [3] suggest algorithm and data pro-cessing, allowing the best scan matching possi-ble, which helps to reduce the differences in RNFL thickness measurements between the circular scan
Fig. 3 A, B. Bland-Altman plots of comparable measurements of RNFL thickness made with Stratus OCT and Spectralis OCT in (A) the upper quadrant and (B) the lower quadrant. The differential between the measurements in all the participants (RNFL thickness measured with Stratus OCT minus RNFL thickness measured with Spectralis OCT) has been overlaid on the background of the average measurements of the two devices (RNFL thickness mea-sured with Stratus OCT RNFL plus RNFL thickness meamea-sured with Spectralis OCT) and are presented separately for each quadrant
data from TD-OCT, and those with 3D SD, to en-sure the comparability of the results of the 2 gen-erations of OCT [3].
A comparative study on the reproducibility of the SD-OCT and TD-OCT results in healthy pa-tients and those with open-angle glaucoma (25 nor-mal eyes, 22 glaucoma eyes) conducted by Toteber-ga-Harmas et al. showed good reproducibility, but in the glaucoma eyes they found higher reproduc-ibility when using an SD-OCT [13].
The current study included 35 patients, all Caucasians. It is necessary to note that differences in the RNFL thickness may depend on age or race. Budenz et al. conducted a study involving 328 healthy people, using Stratus OCT, and they found that Caucasians had mean RNFL thickness slight-ly lower than Hispanics or Asians but that there was no relationship between RNFL thickness and sex [14]. Budenz et al. pointed out, however, that due to the small number of non-Caucasiansin the study the results should be viewed with caution.
Testing and tracking RNFL thickness progres-sion has important practical significance because fiber damage can occur early in glaucoma, even when there is no perceptible change in the field of vision. Because there is a correlation between visual field defects and damage to the nerve fibers, RNFL defects can predict changes in perimetry [1].
Based on the authors’ observations and data from the literature, it can be concluded that the new-er gennew-eration of medical equipment produces low-er RNFL measurements than earlilow-er devices because they use more accurate algorithms. It is important to be aware of the differences between the Spectra-lis OCT and Stratus OCT. Patients should be exam-ined consistently with the same devices, to avoid introducing too much variability to detect chang-es over time. One of the problems facing clinicians in observing patients using new imaging techniques is that the hardware and software change every 510 years, and it is necessary to purchase new equip-ment and, consequently, to establish new normative
Fig. 4 C, D. Bland-Altman plots of comparable measurements of RNFL thickness made with Stratus OCT and Spectralis OCT in (C) the temporal quadrant and (D) the nasal quadrant. The differential between the measurements in all the participants (RNFL thickness measured with Stratus OCT minus RNFL thickness measured with Spectralis OCT) has been overlaid on the background of the average measurements of the two devices (RNFL thickness mea-sured with Stratus OCT RNFL plus RNFL thickness meamea-sured with Spectralis OCT) and are presented separately for each quadrant
groups compatible with the new technology. In the case of the transition from the Stratus to the Spec-tralis OCT, the best strategy for changing from one to the other during the observation of a patient may be to perform a control scan on the Stratus, and then perform a spectral OCT as a basis for further examination in the future [8].
Authors concluded that the average RFNL thickness in patients with open-angle glaucoma was
lower in the measurements taken with the Spectralis SD-OCT device than with the Stratus TD-OCT. There are differences between the measurements made using these 2 devices, which cause variations in the measurements of RNFL thickness. Consid-ering the new generation of apparatus and the more precise measurement algorithm, the results obtained using the Spectralis SD-OCT appear to be more accurate.
References
[1] Ajtony C, Balla Z, Somoskeoy Sz, Kovacs B: Relationship between visual field sensitivity and retinal nerve fiber layer thickness as measured by optical coherence tomography. Invest Ophthalmol Vis Sci 2007, 48, 258–263.
[2] Bourne RRA, Medeiros FA, Bowd C, Jahanbakhsh K, Zangwill LA, Weinreb RN: Comparability of Retinal Nerve Fiber Layer Thickness Measurements of Optical Coherence Tomography Instruments, Invest Ophthalmol Vis Sci 2005, 46, 1280–1285.
[3] Budenz DL, Anderson DR, Varma R, Scuman J, Cantor L, Savell JGreenfield DS,PatellaVM, Quigley HA, Tielsch J: Determinants of normal retinal nerve fiber layer thickness measured by Stratus OCT Ophthalmology 2007, 114, 1046–1052.
[4] Chang RT, Knight OJ, Feuer WJ, Budenz DL: Sensitivity and speciticity of time-domain versus spectral-domain optical coherence tomography in diagnosing early to moderate glaucoma. Ophthalmology 2009, 116, 2294–2299.
[5] Kim JS, Ishikawa H, Gabriele ML, Wollstein G, Bilonick RA, Kagemann L, Fujimoto JG, Schuman JS: Retinal nerve fiber layer thickness measurement comparability between time Ddomain Optical Coherence Tomography (OCT) and Spectral Domain OCT Invest Ophthalmol Vis Sci 2010, 51, 896–902.
[6] Knight OJ, Chang RT, Feuer WJ, Budenz DL: Compatison of retinal nerve fiber layer measurements using time domain and spectral domain optical coherent tomography. Ophthalmology 2009, 116, 1271–1277.
[7] Monteiro ML., Leal BC, Moura FC, Vessani RM, Medeiros FA: Comparison of retinal nerve fibre layer mea-surements using optical coherence tomography versions 1 and 3 in eyes with band atrophy of the optic nerve and normal controls. Eye 2007, 21, 16–22.
[8] Piłat J, Wylęgała E, Łogiewa-Toborek J, Galuba-Dębska I: Zastosowanie i możliwości diagnostyczne aparatu STRATUS OCT. Okulistyka 2004, 2, 3–8.
[9] Sung KR, Kim DY, Park SB, Kook MS: Comparison of retinal nerve fiber layer thickness measured by Cirrus HD and Stratus optical coherence tomography. Ophthalmology 2009, 116, 1264–1270.
[10] Toteberg-Harms M, Sturm V, Knrcht PB, Funk J, Menke MN: Repeatability of nerve layer thickness measure-ments in patients with glaucoma. Graefe’s Archive for Clinical and Experimental Ophthalmol 2012, 250, 279–287.
[11] Vizzeri G, Weinreb RN, Gonzalez-Garcia AO: Agreement between spectral- domain and time domain OCT for measuring RNFL thickness. Br J Ophthalmol 2009, 93, 775–781.
[12] Vizzeri G, Bowd C, Medeiros FA, Weinreb RN, Zangwill LM: Effect of improper scan alignment on retinal nerve fiber layer thickness measurements using Stratus optical coherence tomograph. J Glaucoma 2008, 17, 341–349.
[13] Wojtkowski M, Bajraszewski T, Gorczyńska I, Targowski P, Kowalczyk A, Wasilewski W, Radzewicz C:
Ophthalmic imaging by spectral optical coherence tomography. Am J Ophthalmol 2004, 138, 412–419.
[14] Wylęgała E, Nowińska A, Teper S: Optyczna koherentna Tomografia, t. I. Górnicki Wyd. Med., Wrocław 2011.
Address for correspondence:
Kamil Kaczorowski
Department and Clinic of Ophthalmology Wroclaw Medical University
Borowska 213
50-556 Wrocław, Poland Tel: +48 534 834 355
E-mail: [email protected]
Conflict of interest: None declared