Scholarship@Western
Scholarship@Western
Electronic Thesis and Dissertation Repository
8-29-2016 12:00 AM
Removal of Target PPCPs from Secondary Effluent Using AOPs
Removal of Target PPCPs from Secondary Effluent Using AOPs
and Novel Adsorbents
and Novel Adsorbents
Venkateswara Reddy Kandlakuti
The University of Western Ontario
Supervisor
Dr. Ernest K. Yanful
The University of Western Ontario
Graduate Program in Civil and Environmental Engineering
A thesis submitted in partial fulfillment of the requirements for the degree in Doctor of Philosophy
© Venkateswara Reddy Kandlakuti 2016
Follow this and additional works at: https://ir.lib.uwo.ca/etd
Part of the Environmental Engineering Commons
Recommended Citation Recommended Citation
Kandlakuti, Venkateswara Reddy, "Removal of Target PPCPs from Secondary Effluent Using AOPs and Novel Adsorbents" (2016). Electronic Thesis and Dissertation Repository. 4090.
https://ir.lib.uwo.ca/etd/4090
This Dissertation/Thesis is brought to you for free and open access by Scholarship@Western. It has been accepted for inclusion in Electronic Thesis and Dissertation Repository by an authorized administrator of
ii
Atenolol (β-blocker), Clofibric Acid (Lipid regulators) and Diclofenac
(Anti-inflammatory) are the drugs widely used and reported to have adverse effects on fish
and other organisms. These drugs are found at trace levels in lakes, rivers, ground water
and sewage treatment plants and conventional treatment plants are ineffective to
eliminate these at those levels. A high resolution LC-MS/MS was used to quantify
these drugs at low levels. Various advanced oxidation methods were used for the
present research to eliminate these drugs from secondary effluent. Complete removal of
selected PPCPs was achieved by synthesizing immobilized TiO2 on a stainless steel
mesh and using a combination of O3/UV/TiO2 a very powerful technique. Although
individual advanced oxidation process or a combination of two AOPs were able to
remove it to a lesser extent. In2O3 porous microspheres, nanocubes, nanoplates and
nano crystals were synthesized and used for treatment of secondary effluent. Results
have shown that the complete removal of PPCPs was achieved in shorter duration in
comparison to the various AOPs using TiO2. Out of these four In2O3 nano materials,
porous microspheres exhibited higher activity compared to other nano materials. A
deciduous wood biomass was subjected to slow pyrolysis at a rate of 7oC/min in the
absence of oxygen to 700oC leading to the formation of biochar (BC). The produced
biochar had increased surface area and micro porosity. Batch sorption studies were
conducted using biochar, natural zeolite (Chabazite) and chemically activated biochar.
It was observed that chemically activated biochar was highly efficient followed by
biochar.
Keywords
Wastewater, biochar, advanced oxidation process, adsorption, degradation rate,
iii
Co-Authorship
Title: Preparation and characterization of homogeneous immobilized TiO2 coatings on
stainless steel mesh and its removal kinetics of PPCPs from wastewater by a combination of AOPs (O3/UV/TiO2) and its comparison with other techniques
Author: V.R. Kandlakuti
All literature survey was done by V.R. Kandlakuti under the guidance of advisor E.K.
Yanful. All drafts of the manuscripts were written by V.R. Kandlakuti. Modification of
the drafts was undertaken under the close supervision of thesis advisor E.K. Yanful.
Title: Preparation of Indium Oxide nanocubes, porous microspheres, nanoplates and nanocrystals, its characterization and application in degradation of PPCPs from wastewater
Author: V.R. Kandlakuti
All portions of experimental work and data analysis were undertaken by V.R.
Kandlakuti under the guidance of advisor E.K. Yanful. All drafts of the manuscripts
were written by V.R. Kandlakuti. Modification of the drafts was undertaken under the
close supervision of thesis advisor E.K. Yanful.
Title: Preparation of Biochar, its characterization and application in removal of PPCPs from wastewater with comparison to natural zeolites
Author: V.R. Kandlakuti
All portions of experimental work and data analysis were undertaken by V.R.
Kandlakuti under the guidance of advisor E.K. Yanful. All drafts of the manuscripts
were written by V.R. Kandlakuti. Modification of the drafts was undertaken under the
iv
Acknowledgments
First of all, I want to thank almighty god for giving me strength and ability to
successfully complete this work.
I would like to express my deep sense of gratitude to my supervisor, Professor Ernest
K. Yanful for providing me the opportunity to work with him and whose
encouragement, guidance, and support enabled me to develop an understanding of the
subject. His wide knowledge and his logical way of thinking have been of great value
for me and provided a good basis for the present thesis.
I am grateful to Dr. Mita Ray, Professor, Department of Chemical and Biochemical
Engineering for providing lab facilities to conduct my research. I would also like to
thank Professor and TWNER Program Director, Dr. George Nakhla, The Clean
Technologies for Water Refining and Nutrient and Energy Recovery with Collaborative
Research and Training Experience Program (TWNER - CREATE) sponsored by
Natural Sciences and Engineering Research Council (NSERC).
I am sincerely grateful to the professors, technicians, and administrative assistants of
the Department of Civil and Environmental Engineering and the Geotechnical Research
Center at Western University for their support and help. The support of administrative
and technical staffs Connie Walter, Cynthia Quintus, Stephanie Laurence, Kristen
Edwards, Joanna Bloom, Tim Stephens, Caitlin Marshall, Fate Hashemi, Erol Tas,
Souheil Afara, Brian Dennis, Mike Gaylard and Mike Mosley is highly appreciated.
The valuable help of University Machine Services staff, Electronic Stores staff, Surface
Science Western and Nano Fab is gratefully acknowledged.
I greatly acknowledge the enormous help and support from my friends and colleagues
Sudhakar Yadlapalli, Dr. P. Venkateswarlu, Dr. Sidda Reddy Boyilla and their
technical team who provided excellent services at FirstSource Laboratory Solution
LLP, Anil Kumar Jhawar, Diego Velasquez, Amro Miqdadi, Ikrema Hassan, Kai
v
Sudhakar Mamillapalli, Gopi Kiran Morla, Mahendra Reddy Thimmanagari, Murali
Jupalli, Rama Rao Varanasi, Dr. Tad Venkateswarlu (Emeritus Professor), Dr. Sunil
Parapuram, Sharath Bojja and Sashi Kiran who have all assisted me in various ways
and I am sincerely grateful for their continued and untiring support during tough times.
In the last but not least, I owe my loving thanks to my parents, my wife Bhavani, my
adorable kids Bhargav and Haran and other family members. Without their
encouragement and understanding it would have been impossible for me to finish this
vi
Dedication
vii
Table of Contents
Abstract ... ii
Co-Authorship... iii
Acknowledgments... iv
Dedication ... vi
Table of Contents ... vii
List of Tables ... xiii
List of Appendices ... xxiv
Nomenclature ... xxvi
Chapter 1 ... 1
1 Introduction ... 1
1.1 Background ... 1
1.2 Objectives of the study... 4
1.3 Contribution of the thesis ... 5
1.4 Organization of the thesis ... 5
1.5 References ... 7
Chapter 2 ... 10
2 Literature review ... 10
2.1 Introduction ... 10
2.1.1 Sources of PPCPs in the environment ... 10
2.1.2 Pathways of pharmaceuticals in the environment ... 12
2.1.3 Classification of PPCPs ... 13
2.1.4 Fate of Pharmaceuticals in the environment ... 14
2.1.5 Occurrence of Pharmaceuticals in the environment ... 15
viii
2.1.7 Natural Organic Matter and Brominated species in natural waters ... 20
2.1.8 Stages of a Wastewater Treatment Plant ... 21
2.1.9 Comparison of various treatment technologies and percent removal of target PPCPs... 24
2.1.10 Physico-chemical properties of target PPCP compounds ... 28
2.2 Advanced Oxidation Processes ... 34
2.2.1 Advanced Oxidation Methods ... 35
2.2.1.1 Ozonation ... 37
2.2.1.2 UV ... 41
2.2.1.3 Photocatalytic Metal Oxide (TiO2) ... 42
2.2.1.4 Ozone–UV radiation (O3/UV) ... 46
2.2.1.5 Photocatalytic oxidation (UV/TiO2) ... 48
2.2.1.6 Ozone + Catalyst (O3/TiO2)... 50
2.2.1.7 Hydrogen Peroxide (H2O2) ... 50
2.3 Comparative operating costs of treatment for various AOPs ... 52
2.4 Indium Oxide nano materials ... 53
2.5 Biochar (BC) ... 56
2.6 References ... 61
Chapter 3 ... 80
3 Preparation and characterization of homogeneous immobilized TiO2 coatings on stainless steel mesh and its removal kinetics of PPCPs from wastewater by a combination of AOP (O3/UV/TiO2) and its comparison with other techniques ... 80
3.1 Introduction ... 80
3.2 Materials and Methods ... 83
3.2.1 Reagents and chemicals ... 83
3.2.2 Raw water quality ... 85
ix
3.2.4 Homogeneous Immobilized TiO2 catalyst preparation on Stainless Steel
mesh using Dip-Coat method... 86
3.2.5 Characterization of Immobilized TiO2 Catalyst ... 87
3.2.6 Experimental protocol ... 90
3.2.6.1 Experiments conducted with wastewater samples ... 90
3.2.6.2 Reactor setup ... 91
3.3 PPCP method setup by LC-MS/MS (High Resolution) ... 94
3.4 PPCP analysis in wastewater samples ... 99
3.5 Results and Discussion ... 99
3.5.1 Effect of TiO2 loading ... 100
3.5.2 Effect of AOP ... 104
3.5.3 Effect of pH... 111
3.5.4 Effect of Natural Organic Matter and Bromine ... 117
3.5.5 Identification of UV-transformation products ... 123
3.5.5.1 Degradation products of Atenolol ... 123
3.5.5.2 Degradation products of Clofibric acid ... 129
3.5.5.3 Degradation products of Diclofenac ... 131
3.6 Conclusions ... 133
3.7 References ... 134
Chapter 4 ... 140
4 Preparation of Indium Oxide nanocubes, porous microspheres, nanoplates and nanocrystals, its characterization and application in degradation of PPCPs from wastewater ... 140
4.1 Introduction ... 140
4.2 Materials and Methods ... 144
4.2.1 Reagents and chemicals ... 144
x
4.2.2.1 Synthesis of In2O3 from In(NO3)3·4.5H2O via In(OH)3 by
Solvothermal process ... 145
4.2.2.2 Formation of In2O3 nanocubes, nanoplates and porous microspheres ... 146
4.2.2.3 Preparation of In2O3 nanocrystals from In(NO3)3·4.5H2O by a simple co-precipitation method ... 148
4.2.2.4 Characterization ... 149
4.2.2.5 Photocatalytic procedures ... 150
4.2.2.6 Quantification of PPCPs by LC-MS/MS ... 151
4.3 Results and discussion ... 152
4.3.1 Morphology and crystal structure of calcined In2O3 samples ... 152
4.3.2 FTIR spectra of calcined and AOP treated samples ... 155
4.3.3 Energy Dispersive X-ray (EDX) Spectroscopy ... 162
4.3.4 Decomposition of PPCPs using various photocatalytic In2O3 nano particles ... 167
4.3.5 Comparison of photocatalytic decomposition between distilled water and secondary effluent at pH 7 ... 171
4.3.6 Effect of pH... 173
4.3.7 Comparison of various In2O3 nano structures with AOPs ... 177
4.4 Conclusion ... 182
4.5 References ... 183
Chapter 5 ... 187
5 Preparation and characterization of Biochar and its application in the removal of PPCPs from wastewater and comparison to removals by natural zeolites... 187
5.1 Introduction ... 187
5.2 Experimental Methods ... 195
5.2.1 Materials and Reagents ... 195
xi
5.2.3 Characterization ... 197
5.2.4 Wastewater collection ... 201
5.2.5 Sorption studies on biochar ... 202
5.2.6 Use of Natural Zeolite for adsorption studies ... 203
5.2.7 Use of Activated Carbon for comparison studies ... 203
5.2.8 Pre-conditioning of Biochar with 0.1N NaCl ... 203
5.2.9 Chemical Activation of Biochar using KOH ... 203
5.2.10 Quantification of PPCPs by LC-MS/MS ... 204
5.2.11 Adsorption models ... 204
5.3 Results and Discussion ... 206
5.3.1 Morphology and structure of BC samples by FE-SEM ... 206
5.3.2 Energy Dispersive X-ray (FE-SEM/EDX) Spectroscopy ... 208
5.3.3 FTIR spectra of BC samples ... 210
5.3.4 13C NMR spectra of BC samples ... 213
5.3.5 CHNS analysis of BC samples ... 214
5.3.6 BET analysis of BC samples... 215
5.3.7 Adsorption of target PPCPs compounds ... 215
5.3.7.1 Effect of pH on biochar ... 216
5.3.7.1.1Effect of pH at constant PPCP concentration of 10ppm 216
5.3.7.1.2Effect of pH at constant PPCP concentration of 20ppm 219
5.3.7.1.3Effect of pH at constant PPCP concentration of 30ppm 221
5.3.7.2 Effect of pH on biochar : Chb ... 224
5.3.7.3 Effect of PPCPs concentration at constant pH 9.0 ... 227
5.3.7.4 Effect of Pre-conditioning on Sorbent Performance ... 229
xii
5.3.8 Comparison of various adsorption methods with varying pH ... 232
5.3.9 Isotherms ... 237
5.4 Conclusions ... 244
5.5 References ... 245
Chapter 6 ... 259
6 Conclusions and Recommendations ... 259
6.1 Conclusions ... 259
6.2 Recommendations ... 261
Appendices ... 263
xiii
List of Tables
Table 2.1. Concentrations of Pharmaceuticals in Sludges, Biosolids and Groundwater,
reported in the literature since 2004... 16
Table 2.2. Concentration of Pharmaceuticals in Wastewater Influents, Effluents and Surface Water, reported in the literature since 2004... 16
Table 2.3. Comparison of various treatment technologies and their removal efficiency from various types of water matrices for the three target PPCP compounds ... 25
Table 2.4. Test compounds with its IUPAC names and chemical structure ... 28
Table 2.5. Physico-chemical properties of test compounds ... 29
Table 2.6. Uses, toxicity and byproduct/degradation products for test compounds ... 30
Table 2.7. Log Kow versus Sorption Potential ... 32
Table 2.8. Some oxidizing species with their relative oxidation power (Carey, 1992 and Techcommentary, 1996) ... 33
Table 2.9. Organic compounds with reaction rate constants of ozone vs. hydroxyl radical (The UV/Oxidation Handbook) ... 34
Table 2.10. Photolysis of ozone and H2O2 leading to the formation of ·OH (Techcommentary, 1996). ... 47
Table 2.11. Comparative operating costs of some AOPs ((Techcommentary, 1996). ... 52
Table 2.12. Operating costs of advanced oxidation processesa (Yonar et al., 2005). .... 52
Table 3.1. Physico-Chemical properties of ATN, CFA and DCF ... 82
Table 3.2: Properties of TiO2 powder as per manufacturer ... 84
xiv
Table 3.4: Water quality parameters of secondary effluent ... 91
Table 3.5: Gradient program for LC-MS/MS ... 97
Table 3.6: Source parameters for LC-MS/MS ... 97
Table 3.7: Multiple Reaction Monitoring parameters for LC-MS/MS ... 98
Table 3.8: Effect of TiO2 loadings of ATN, CFA and DCF in SE [rate constant k and correlation coefficient R2, Co = 10mg/L, UV = 13W, O3 = 2mg/L, pH = 7, T = 23 ±1oC] ... 103
Table 3.9: Comparison of various AOPs with their degradation parameters (rate constant k and correlation coefficient R2) of ATN, CFA and DCF in SE [Co = 10mg/L, TiO2 = 1g/m2, UV = 13W, O3 = 2mg/L, pH = 7.0, T = 23 ± 1oC] ... 110
Table 3.10: Comparison of various AOPs with pH (rate constant k and correlation coefficient R2) of ATN in SE [Co = 10 mg/L, TiO2 = 1 g/m2, UV = 13W, O3 = 2 mg/L, T = 23 ± 1oC] ... 115
Table 3.11: Comparison of various AOPs on degradation of PPCPs in presence of varying concentrations of NOM and Br with their k and R2 values ... 119
Table 4.1. Comparison of various types of In2O3 nanostructures produced by different methods comprising of all three phases, namely, the solution, solid and vapor phase and their properties ... 142
Table 4.2. Characterization of various types of In2O3 using various equipment types 149 Table 4.3. Comparison of FTIR spectra of microsphere peaks with literature values (Tom Tague). ... 158
Table 4.4. Comparison of FTIR spectra of nano cube peaks with literature values (Tom Tague). ... 159
xv
Table 4.6. Comparison of FTIR spectra of nano crystal peaks with literature values
(Tom Tague). ... 161
Table 4.7. EDX results in duplicate for In2O3 microspheres after calcination. ... 163
Table 4.8. EDX results in duplicate for In2O3 nano plates after calcination ... 164
Table 4.9. EDX results in duplicate for In2O3 nano cubes after calcination ... 165
Table 4.10. EDX results in duplicate for In2O3 nano crystals after calcination ... 166
Table 4.11. Rate constants (k, min-1) of various nano particles with their correlation coefficient (R2) values for ATN, CFA and DCF for SE ... 171
Table 4.12. Rate constants (k, min-1) of various AOPs with their correlation coefficient (R2) values for ATN, CFA and DCF for SE (Chapter 3. V.R. Kandlakuti). ... 180
Table 5.1. Physico-chemical properties of the selected PPCPs ... 198
Table 5.2. Physical properties of the tested Natural Zeolites (Gallant et al., 2009) ... 201
Table 5.3. EDX spectroscopy results of three spots scanned on the BC sample at 10kV ... 209
Table 5.4. FTIR spectra of BC peaks with literature values (Tom Tague) ... 211
Table 5.5. CHNS results of biochar analyzed by CHNS analyzer... 214
Table 5.6. Freundlich and Langmuir isotherm constants for ATN adsorption onto BC with their correlation coefficient, R2 at differentdosages ... 242
Table 5.7. Freundlich and Langmuir isotherm constants for CFA adsorption onto BC with their correlation coefficient, R2 at differentdosages ... 243
xvi
List of Figures
Figure 2.1. Occurrence of pharmaceutical and its metabolite residues showing possible
sources and pathways in the aquatic environment (Heberer and Adam, 2002a). Residues
of animal excretions reaching surface waters or municipal STPs are represented by
astrick. ... 13
Figure 2.2. Physical processes that affect the environmental concentrations of PPCPs
(Meade H. R., 1995, U.S. Geological Survey Circular 1133, p. 114-135) ... 15
Figure 2.3. Various stages of a conventional wastewater treatment plant (Sherry S., and
Karl A., 2006) ... 22
Figure 2.4. Adelaide wastewater treatment plant, London, ON, Canada ... 23
Figure 2.5. Classification of Advanced Oxidation Processes into Homogeneous and
Heterogeneous Processes (Poyatos et al., 2009) ... 36
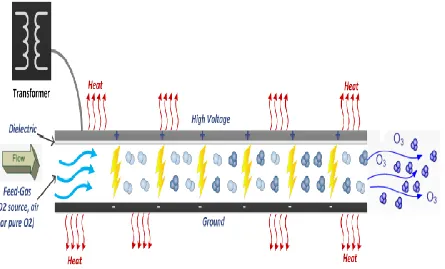
Figure 2.6. Ozone production from corona-discharge (Oxidation technologies, 2014) . 38
Figure 2.7. Reactions of ozone and dissolved solids * ... 39
Figure 2.8. Double-layer model for ozone mass transfer (ESCO International) ... 40
Figure 2.9. Schematic diagram of an irradiated TiO2 semiconductor particle with
photo-physical and photo-chemical process (Giwa et al., 2012) ... 43
Figure 2.10. Schematic illustrations in the dark and under UV light irradiation on TiO2
film showing reversible changes in amount of hydroxyl groups (Sakai et al., 2003). .... 45
Figure 2.11. Ozone dissociation with UV irradiation (Spartan Environmental
Technologies, 2014). ... 47
Figure 2.12. Photocatalytic oxidation process (Conee Orsal, 2015)... 49
xvii
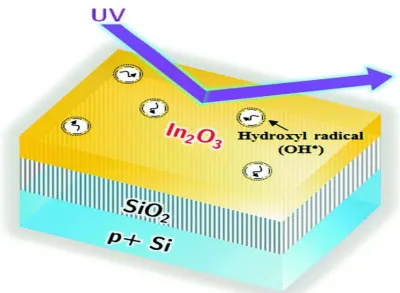
Figure 2.14. Schematic for solution-processed In2O3 thin-films by a hydroxyl
radical-assisted (HRA) method (Sabri et al., 2015) ... 55
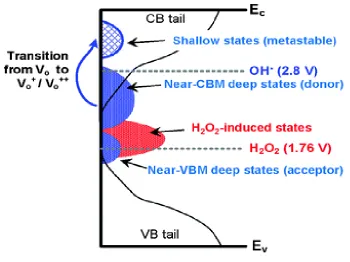
Figure 2.15. Schematic illustrations showing metastable states induced by the hydroxyl-radical assisted oxidation (Sabri et al., 2015). ... 56
Figure 2.16. Production and application of biochar for wastewater treatment as an effective adsorbent (Tan, X. et al., 2015). ... 57
Figure 2.17. Summarized adsorption mechanisms proposed on biochars by heavy metals (Tan, X. et al., 2015). ... 58
Figure 2.18. Summarized adsorption mechanisms proposed on biochars by organic contaminants (Tan, X. et al., 2015). ... 60
Figure 3.1. Chemical structures of target Pharmaceuticals (ChemIDplus, 2014) ... 83
Figure 3.2. Dip coatings of homogeneous immobilized 2%, 4% and 20% of Degussa P25 TiO2 supported on SS plates ... 86
Figure 3.3. SEM image of dried film at 10kV ... 88
Figure 3.4. EDX spectroscopy of dried film at 10kV ... 88
Figure 3.5. SEM image of calcined TiO2 film at 10kV ... 89
Figure 3.6 EDX spectroscopy of calcined TiO2 film at 10kV ... 89
Figure 3.7. Experimental Reactor Setup for AOP ... 93
Figure 3.8. Mechanism of ion formation in Turbo VTM ESI ion source equipped with QTRAP before entring LC-MS/MS region (Mohamad, A., 2010 and AB Sciex, Ontario, Canada) ... 96
xviii
Figure 3.10. Effect of different oxidation process on relative concentration profiles (a)
ATN (b) CFA and (c) DCF [Co = 10mg/L, TiO2 = 1g/m2, pH = 7.0, T = 23 ± 1oC] ... 106
Figure 3.11. Percent Reduction under influence of various AOPs a) ATN, b) CFA and
c) DCF [Co = 10mg/L, O3 = 2mg/L, UV = 13W, TiO2 = 1g/m2, pH = 7.0, T = 23 ± 1oC]
... 108
Figure 3.12. Relative concentration profiles with various AOPs a) ATN, b) CFA and c)
DCF [Co = 10mg/L, O3= 2mg/L, UV = 13W, TiO2 = 1g/m2, pH = 7.0, T =23 ± 1oC] 110
Figure 3.13. Relative concentration profiles of pH on ATN (a) UV/TiO2 (b) O3/TiO2
and (c) O3/UV/TiO2 [Co = 10mg/L, TiO2 = 1g/m2, O3 = 2 mg/L, UV = 13W, T = 23 ±
1oC] ... 112
Figure 3.14. Percent removal of ATN at varying pH (a) UV/TiO2 (b) O3/TiO2 and (c)
O3/UV/TiO2 [Co = 10mg/L, TiO2 = 1g/m2, O3 = 2mg/L, UV = 13W, T = 23 ± 1oC] .. 115
Figure 3.15. Relative concentration of ATN at varying pH (a) UV/TiO2 (b) O3/TiO2
and c) O3/UV/TiO2 [Co = 10mg/L, TiO2 = 1g/m2, O3 = 2mg/L, UV = 13W, T = 23 ±
1oC] ... 117
Figure 3.16. Effect of varying concentrations of NOM and Br on ATN, CFA and DCF
a) UV/TiO2 (b) O3/TiO2 and (c) O3/UV/TiO2 [Co = 10mg/L, TiO2 = 1g/m2, O3 = 2
mg/L, UV = 13W, T = 23 ± 1oC] ... 121
Figure 3.17. Determination of rate constant k, min-1at varying concentrations of NOM
and Br on ATN, CFA and DCF using UV/TiO2 (b) O3/TiO2 and (c) O3/UV/TiO2 [Co =
10mg/L, TiO2 = 1g/m2, O3 = 2 mg/L, UV = 13W, T=23 ± 1oC]. ... 122
Figure 3.18. (a) to (m) Spectrum of ATN and its transformation products by MS/MS
with its proposed structure and molecular ion [M+H]+ ... 129
Figure 3.19. Various oxidative and reductive pathways for degradation of CFA ... 130
Figure 3.20. (a) and (b) Spectrum of DCF and its transformation products by MS/MS
xix
Figure 4.1. Stainless steel autoclave used to synthesize nanocubes, nanoplates and
porous microspheres in Parr reactor at 180◦C ± 2◦C for 16h ... 145
Figure 4.2. Precipitates of 1) porous microspheres (MS) 2) nanocubes (NC) and 3)
nanoplates (NP), obtained after autoclaving in Parr reactor at 180◦C ± 1◦C. ... 146
Figure 4.3. Formation of In2O3 after calcinationat 500◦C for 2h producing 1) MS, 2)
NC and 3) NP ... 147
Figure 4.4. White precipitate of In(NO3)3·4.5H2O after co-precipitation followed by
drying at 80oC for 24h... 148
Figure 4.5. Yellow In2O3 nanocyrstals obtained after calcination at 400oC for 2h. ... 149
Figure 4.6. (a, b, c and d). Leo (Zeiss) 1540XB FIB/SEM images of microspheres .... 152
Figure 4.7. (a and b). Leo (Zeiss) 1540XB FIB/SEM images of nano cubes at 1kV ... 153
Figure 4.8. (a and b). Leo (Zeiss) 1540XB FIB/SEM images of nano plates ... 154
Figure 4.9. (a, b, c and d) Leo (Zeiss) 1540XB FIB/SEM images of nano crystals ... 154
Figure 4.10. FTIR spectra of In2O3 microspheres calcined at 500oC for 2h (a) before
AOP treatment and (b) after AOP treatment of PPCPs. ... 155
Figure 4.11. FTIR spectra of In2O3 nano cubes calcined at 500oC for 2h (a) before AOP
treatment and (b) after AOP treatment of PPCPs. ... 156
Figure 4.12. FTIR spectra of In2O3 nano plates calcined at 500oC for 2h (a) before AOP
treatment and (b) after AOP treatment of PPCPs. ... 157
Figure 4.13. FTIR spectra of In2O3 nano crystals calcined at 400oC for 2h (a) before
AOP treatment and (b) after AOP treatment of PPCPs. ... 157
Figure 4.14. Spot EDX spectra of In2O3 microspheres calcined at 500oC for 2h ... 162
xx
Figure 4.16. Spot EDX spectra of In2O3 nano cubes calcined at 500 C for 2h ... 165
Figure 4.17. Spot EDX spectra of In2O3 nano crystals calcined at 400oC for 2h ... 166
Figure 4.18. Photocatalytic decomposition of ATN, CFA and DCF by In2O3 microsphere at pH 7 for SE at 23 ± 1oC (a) C/Co (b) % Reduction and (c) ln Co/C . 167 Figure 4.19. Photocatalytic decomposition of ATN, CFA and DCF by In2O3 nano plates at pH 7 for SE at 23 ± 1oC (a) C/Co (b) % Reduction and (c) ln Co/C ... 168
Figure 4.20. Photocatalytic decomposition of ATN, CFA and DCF by In2O3 nano cubes at pH 7 for SE at 23 ± 1oC (a) C/Co (b) % Reduction and (c) ln Co/C ... 169
Figure 4.21. Photocatalytic decomposition of ATN, CFA and DCF by In2O3 nano crystals at pH 7 for SE at 23 ± 1oC (a) C/Co (b) % Reduction and (c) ln Co/C ... 170
Figure 4.22. A comparison of photocatalytic decomposition of ATN, CFA and DCF by In2O3 NCY at pH 7, 23 ± 1oC between DW and SE ... 172
Figure 4.23. Percent reduction of ATN, CFA and DCF by In2O3 NCY at pH 7, 23 ± 1oC between DW and SE ... 172
Figure 4.24. Percent reduction of ATN by NCY on SE at pH 3, 5 and 7 ... 173
Figure 4.25. Percent reduction of CFA by NCY on SE at pH 3, 5 and 7 ... 174
Figure 4.26. Percent reduction of DCF by NCY on SE at pH 3, 5 and 7 ... 174
Figure 4.27. Rate constants of ATN, CFA and DCF by NCY on SE at pH 3 ... 175
Figure 4.28. Rate constants of ATN, CFA and DCF by NCY on SE at pH 5 ... 176
Figure 4.29. Rate constants of ATN, CFA and DCF by NCY on SE at pH 7 ... 176
xxi
Figure 4.31. Comparison of removal efficiency of MS, NP, NC and NCY In2O3 versus
UV/TiO2, O3/TiO2 and O3/UV/TiO2 for SE at pH = 7, T = 23 ± 1oC (a) ATN (b) CFA
and (c) DCF... 180
Figure 5.1. Carbonization of Wood ... 190
Figure 5.2. Probable mechanisms of the interactions of organic contaminants with biochar (Ahmad, M. et al., 2013) ... 191
Figure 5.3. Representation of the Chabazite structure with O atoms represented by red lines and Si (or Al) bonds to O represented by yellow lines. ... 193
Figure 5.4. Distribution sizes of various pores and its adsorption phenomena in activated carbon. ... 194
Figure 5.5. Production of biochar, biooil and syngas from thermochemical decomposition of waste biomass by a process of pyrolysis. ... 196
Figure 5.6. Biochar obtained after slow pyrolysis at 700oC with a ramp temperature of 7oC/min for 1h... 197
Figure 5.7. Chemical structures of targeted PPCPs compounds ... 199
Figure 5.8. SEM images scanned at 200, 120, 60 and 37.5 µm of biochar at 10 kV ... 206
Figure 5.9. SEM images scanned at 30 and 20µm of biochar at 10kV ... 207
Figure 5.10. SEM images of three spots scanned at 300µm of biochar at 10kV ... 208
Figure 5.11. EDX images scanned at 300µm of biochar at 10kV ... 209
Figure 5.12. FTIR spectra of BC sample after pyrolysis at 700oC ... 210
Figure 5.13. Structure of straight chain Alkanes with Methylene group (CH2) (Tom Tague) ... 212
xxii
Figure 5.15. Comparison of various spectra using 13C NMR ... 213
Figure 5.16. Effect of pH in percent removal onto BC (a) ATN, (b) CFA and (c) DCF
[Co = 10 mg/L, adsorbent dosage = 1, 2, 5, 10 and 20 g/L] ... 218
Figure 5.17. Effect of pH in percent removal onto BC a) ATN, (b) CFA and (c) DCF
[Co = 20mg/L, adsorbent dosage = 1, 2, 5, 10 and 20 g/L] ... 220
Figure 5.18. Effect of pH in percent removal onto BC (a) ATN, (b) CFA and (c) DCF
[Co = 30mg/L, adsorbent dosage = 1, 2, 5, 10 and 20 g/L] ... 222
Figure 5.19. Percent removal efficiency of PPCPs from a mixture of BC:Chb (a) ATN,
(b) CFA and (c) DCF [Co = 10 mg/L, dosage = 1, 2, 5, 10 and 20 g/L] ... 226
Figure 5.20. Effect of concentration onto BC and its removal efficiency (a) ATN, (b)
CFA and (c) DCF [pH = 9, adsorbent dosage = 1, 2, 5, 10 and 20 g/L] ... 228
Figure 5.21. Effects of biochar pre-conditioning with 0.1N NaCl at pH 3, 6 and 9 (a)
ATN (b) CFA and (c) DCF [Co = 10 mg/L] ... 230
Figure 5.22. Effects of chemical activation of BC in removal efficiency at varying
concentration of KOH [Co = 10mg/L, pH = 9, adsorbent dosage = 1, 2, 5, 10, 20 g/L]
... 231
Figure 5.23. Comparison of various adsorption methods at varying pH onto BC and its
removal efficiency for ATN [Co = 10mg/L, dosage = 1, 2, 5, 10, 20g/L] ... 233
Figure 5.24. Comparison of various adsorption methods at varying pH onto BC and its
removal efficiency for CFA [Co = 10mg/L, dosage = 1, 2, 5, 10, 20g/L] ... 234
Figure 5.25. Comparison of various adsorption methods at varying pH onto BC and its
removal efficiency for DCF [Co = 10mg/L, dosage = 1, 2, 5, 10, 20g/L] ... 235
Figure 5.26. ATN equilibrium adsorption isotherm onto BC [pH = 9; Co = 10, 20,
xxiii
Figure 5.27. Freundlich plot for ATN adsorption onto BC [pH = 9; Co = 10, 20,
30mg/L; dosage = 1, 2, 5, 10, 20g/L] ... 238
Figure 5.28. Langmuir plot for ATN adsorption onto BC [pH = 9; Co = 10, 20, 30mg/L;
dosage = 1, 2, 5g/L] ... 239
Figure 5.29. CFA equilibrium adsorption isotherm onto BC [pH = 9; Co = 10, 20,
30mg/L; dosage = 1, 2, 5, 10g/L] ... 239
Figure 5.30. Freundlich plot for CFA adsorption onto BC [pH = 9; Co = 10, 20,
30mg/L; dosage = 1, 2, 5, 10, 20g/L] ... 240
Figure 5.31. Langmuir plot for CFA adsorption onto BC [pH = 9; Co = 10, 20, 30mg/L;
dosage = 1, 2, 5, 10g/L] ... 240
Figure 5.32. DCF equilibrium adsorption isotherm onto BC [pH = 9; Co = 10, 20,
30mg/L; dosage = 1, 2, 5, 10, 20g/L] ... 241
Figure 5.33. Freundlich plot for DCF adsorption onto BC [pH = 9; Co = 10, 20,
30mg/L; dosage = 1, 2, 5, 10, 20g/L] ... 241
Figure 5.34. Langmuir plot for DCF adsorption onto BC [pH = 9; Co = 10, 20, 30mg/L;
xxiv
List of Appendices
Appendix 1. Average monthly water quality (raw and treated) reported by Adelaide
Wastewater Treatment Plant, 2014 ... 263
Appendix 2. BET Surface Area for TiO2 film after calcination ... 264
Appendix 3. Reactor setup showing the wastewater spiked with PPCP compounds
subjected to O3/UV/TiO2 ... 265
Appendix 4. Agilent 6460 LC-MS/MS (High Resolution) ... 265
Appendix 5. A five point calibration curve for Atenolol with conc. of 10, 20, 50, 75
and 100 ng/ml ... 266
Appendix 6. A five point calibration curve for Clofibric acid with conc. of 10, 20, 50,
75 and 100 ng/ml ... 266
Appendix 7. A five point calibration curve for Diclofenac with conc. of 10, 20, 50, 75
and 100 ng/ml ... 267
Appendix 8. A comparison of various AOPs with their percent removal ... 267
Appendix 9. Effect of pH on the percent removal of ATN using various AOPs ... 268
Appendix 10. Comparison of various AOPs on degradation of PPCPs in presence of
varying concentrations of NOM and Br... 268
Appendix 11. Crystal Structure of Chabazite ... 269
Appendix 12. BET Surface Area plot for Biochar sample pyrolyzed at 700oC ... 269
Appendix 13. BET Surface Area Report with pore volume for Biochar samples ... 270
Appendix 14. A six point calibration curve for Atenolol with conc. of 10, 20, 50, 75,
xxv
Appendix 15. A six point calibration curve for Clofibric Acid with conc. of 10, 20, 50,
75, 100 and 200 ng/ml ... 271
Appendix 16. A six point calibration curve for Diclofenac with conc. of 10, 20, 50, 75,
100 and 200 ng/ml ... 272
Appendix 17. Blank Milli-Q water chromatogram by LC-MS/MS ... 272
xxvi
Nomenclature
ACR Acute to Chronic Ratio
AOP Advanced Oxidation Process
APCI Atmospheric Pressure Chemical Ionization
APIs Active Pharmaceutical Ingredients
AC Activated Carbon
ATN Atenolol
Ave Average concentration
BC Biochar
BET Brunauer-Emmett-Teller
BOD Biochemical Oxidation Demand
BPA Bis Phenol A
CAS Chemical Abstract Service
CAT Catalyst
Ce Equlibrium Concentration (mg/L)
CFA Clofibric Acid
Chb Chabazite
CHNS Carbon, Hydrogen, Nitrogen and Sulfur Analyzer
Cl. Chlorine radical
Cl2._ dichloride anion radical
C0 Initial Solute Concentration
CO32- Carbonates
COD Chemical Oxygen Demand
COX1/2 Cyclo-Oxygenase enzyme(s)
13
xxvii DBPs Disinfection By-Products
DCF Diclofenac
D/DBP Disinfectants and Disinfection By-Products
DI Deionized Water
DNA Deoxyribo Nucleic Acid
DOM Dissolved Organic Matter
DW Distilled Water
EDC Endocrine-disrupting compounds
EDX Energy-dispersive X-ray Spectroscopy
EPA Environmental Protection Agency
EPR Electron Paramagnetic Resonance
ERA Environmental Risk Assessment
ESI Electrospray ionization
ε Molar Extinction Coefficient
FE-SEM Field Emission Scanning Electron Microscopy
FA Fulvic acid
FAC Fiber Activated Carbon
FIB Focused Ion Beam
FTIR Fourier Transform Infrared Spectroscopy
Fe2+ Ferrous ion
GAC Granular Activated Carbon
HA Humic Acid
HAA Haloacetic Acid
Hc Henry’s Law Constant
HCO3- Bicarbonates
xxviii
HOBr Hypobromous acid
H2O2 Hydrogen peroxide
HPLC High Performance Liquid Chromatography
H2S Hydrogen Sulfide
HTC Hydrothermal Carbonization
In(OH)3 Indium Hydroxide
In2O3 Indium Oxide
In(NO3) Indium Nitrate
ISC Inter System Crossing
k Rate Constant
KF Freundlich Sorption Coefficient
KL Langmuir Constant (L/mg)
KOH Potassium Hydroxide
Kow Octanol-Water Partition Coefficient
kV Kilovolt
LC-MS/MS Liquid Chromatography Triple Quadrupole Mass Spectrometry
LD50 Lethal Dose
LOEC Lowest Observed Effect Concentration
LPM Liters per minute
M Mass of Adsorbent in g
MAO Monoamine oxidase
MBR Membrane Bio Reactor
MDL Method detection limit
[M-H]- Deprotonized molecular ion
Mn Million
xxix
MS Microsphere
m/z Mass to Charge Ratio
N Normality
nd Not Detected
NA Not Available
NC Nano Cubes
NCY Nano Crystals
NOM Natural Organic Matter
NO3- Nitrates
NP Nano Plates
NSAIDs Non - Steroidal Anti - Inflammatory Drugs
NTU Nephlo Turbidimetric Units
O2•− Superoxide radical
OM Organic Matter
PAC Powdered Activated Carbon
PBT Persistence, Bioaccumulation and Toxic
PEC Predicted Environmental Concentration
PFOA Perfluorooctanoic acid
pKa Acid dissociation constant
pHzpc Zero point charge
PNEC Predicted no - effect concentration
PPCPs Pharmaceuticals and Personal Care Products
psi Pounds per square inch
PTFE Polytetrafluoroethylene
xxx
qmax Maximum mass adsorbed at saturated adsorption capacity of adsorbent (mg/g)
RAPET Reaction under the Autogenic Pressure at Elevated Temperature
R2 Correlation Coefficient
ROS Reactive Oxygen Species
RPM Revolutions Per Minute
RSD Relative Standard Deviation
SAF-MBR Staged Anaerobic Fluidized Membrane Bioreactor
SE Secondary Effluent
SEM Scanning Electron Microscope
SS Stainless Steel
TCOs Transparent Conducting Oxides
TDS Total Dissolved Solids
THMs Trihalomethanes
TiO2 Titanium Dioxide
TOC Total organic carbon
TSS Total Suspended Solids
UVGI Ultraviolet germicidal irradiation
USGS United States Geological Survey
US FDA Food and Drug Administration
WTW Wastewater Treatment Works
WWTP Wastewater Treatment Plant
WHO World Health Organization
Chapter 1
1
Introduction
1.1 Background
The presence of pharmaceuticals in drinking water, rivers and wastewaters of
Switzerland, United Kingdom, Italy, Germany (Kreuzinger et al., 2004 and Heberer et
al., 2004) and the United States (Bruchet et al., 2005) is a major concern as most of the
data was generated by conducting studies in these countries. Among pharmaceuticals
and personal care products (PPCPs), Atenolol, Clofibric Acid and Diclofenac are in the
top 20 drugs sold and widely used in the world (Fierce Pharma, 2014, Global Market
Sales, 2014 and NDC Health, USA, 2015). These PPCPs are non-regulated and the risk
of their long term exposure at low concentrations to aquatic life can have adverse
effects. For example, the exposure of the anti-inflammatory and arthritis drug,
diclofenac, between 2000 and 2007 has resulted in the death of 95% of India’s Gyps vultures and 90% of Pakistan’s due to renal failure. Diclofenac was sold worldwide in
more than 3 dozen different brand names. Scientists have found that in the environment,
combinations of compounds are commonly found together. For example, it was found
that although low concentrations of fluoxetine, an antidepressant, and clofibric acid do
not have any effect on water fleas individually, they killed more than half of water fleas
when they were exposed to the two compounds simultaneously (Sonia Shah, 2010).
It was observed that concentrations of diclofenac, clofibric acid and atenolol in
wastewater treatment plant (WWTP) influent, effluent, groundwater and surface-water
follows the order of diclofenac>atenolol>clofibric acid whereas diclofenac and clofibric
acid has been observed in sludge and biosolids.
One of the most pressing global environmental issues of present and future is the
protection and conservation of precious water resources. Water reclamation efficiency
clean water supply. Increasing interest in water reuse and public health concerns about
micropollutants originating from a variety of PPCPs and common household chemical
agents has raised concerns about the fate and transformation of these chemicals and
their removal from water. Around 65 to 80 mg/L of bromide concentrations has been
observed in confined areas of seawater (Al-Mutaz, 2000), while fresh waters show trace
amounts to about 0.5 mg/L concentration. In U.S, daily dietary intake from fish, grains
and nuts accounts to 2-8mg of bromide (Nielsen and Dunn, 2009).
Drinking water should be safe from emerging contaminants, including Endocrine
Disrupting Compounds (EDCs), PPCPs, Natural Organic Matter (NOM) and Bromine
(Br). The problem is that most of these EDCs and PPCPs compounds are not regulated,
so neither utilities nor the public know what “safe” is. Therefore, until the regulations
catch up with the research, we aim to remove or reduce the levels of contaminants or
their biological activity in our waters.
Many EDCs and PPCPs are low molecular weight compounds that are relatively
hydrophilic, and are thus not suited for removal by traditional treatments. Many studies
have indicated that conventional water and sewage treatment plants can remove less
than 75% of most EDCs and PPCPs (although this varies widely with chemical
properties and treatment processes). To avoid the potential dangerous accumulation of
pharmaceuticals in the aquatic environment, research is being proposed to determine
the efficacy of powerful oxidation techniques to remove these compounds from
conventionally treated wastewater prior to release to receptors (e.g. rivers), source
water and drinking water.
Several treatment processes were used in the past to remove atenolol from wastewater
by conventional biological treatment (Castiglioni et al., 2006), membrane bioreactor
(MBR) (Kim et al., 2014) and staged anaerobic fluidized membrane bioreactor
(SAF-MBR) (Dutta et al., 2014). Atenolol was also removed from secondary effluent by
ferrate VI (Zhou and Jiang, 2015). For diclofenac the treatment process employed were
photo-Fenton (Pe´rez-Estrada et al., 2005), H2O2/UV and ozonation (Vogna et al., 2004
2005), membrane bioreactor and conventional treatment (Radjenovic et al., 2007),
heterogeneous catalytic oxidation with H2O2 (Hofmann et al., 2007), solar irradiation
(Bartels et al., 2007 and Agu¨ era et al., 2005), granular activated carbon, ultrafiltration,
coagulation/flocculation and reverse osmosis were also employed. Diclofenac was also
removed from wastewater by using adsorption techniques such as micelle–clay
complex (Karaman et al., 2012). Another study involved removal of diclofenac from
contaminated water by the usage of silica gel synthesized by sol-gel process as an
adsorbent (Benavent et al., 2009). Similarly, clofibric acid was removed from water and
wastewater by O3/H2O2 (Zwiener and Frimmel, 2000), Ozonation (Ternes et al., 2002
and Andreozzi et al., 2003), H2O2/UV (Andreozzi et al., 2003), TiO2/UV (Doll et al.,
2004), MBR and conventional treatment (Radjenovic et al., 2007) techniques.
Organic compounds have been treated in drinking water using advanced oxidation
processes (AOPs) at several sites across the United States and Canada over the past ten
years or so. AOPs are chemical oxidation techniques able to produce in situ reactive
free radicals, mainly the hydroxyl radical (•OH), by means of different reacting
systems. The concept was originally established by Glaze et al., (1987) as ‘Oxidation
processes which generate hydroxyl radical in sufficient quantity to affect water
treatment’.
Unlike air stripping and adsorption, which are phase-transfer processes, AOPs are
destructive processes that break down organic contaminants directly in the water
through chemical reaction, as opposed to simply transferring them from the liquid phase
to gas phase (in the case of air stripping) or solid phase (in the case of powdered
activated carbon and resins). However, despite this advantage, there are significant
limitations and challenges in the full-scale application of AOPs. These include (a) the
complex nature of the chemical and physical processes involved in oxidation reactions,
and (b) the influence of background water quality on contaminant removal. For
example, the presence of high bromide concentrations or natural organic matter can
result in the formation of regulated oxidation by-products that may cause water quality
to deteriorate beyond its initial state of contamination; and (c) the non-selective nature
To compensate for these limitations, more energy or higher chemical dosages may be
required, which can potentially result in higher costs. In general, though, AOPs can be
employed to achieve total degradation of PPCPs and their by-products, thereby
avoiding their dangerous accumulation in the aquatic environment. Even partial
degradation and transformation of the parent compounds may attenuate their toxicity.
The commonly used AOPs include homogeneous or heterogeneous processes which
include photodissociation of hydrogen peroxide and ultraviolet (H2O2/UV), photolysis
of ozone (O3/UV), Fenton reaction (Ferrous, Fe2+/H2O2), photo-Fenton reaction
(Fe2+/H2O2/UV), photocatalysis (Titanium dioxide, TiO2/UV), etc.
Each method has its own merits and limitations, and the efficiency of each process
depends on the ease with which it can be operated, the cost effectiveness, the extent of
mineralization achieved and finally the reaction time. Most of these methods are
effective in bringing about the complete oxidation of organic pollutants, thus achieving
the lowest level of pollution.
1.2 Objectives of the study
Broadly the objectives of this research were to select the best technologies for complete
removal of the PPCPs compounds from wastewater. The main objectives of the study
are: a) preparation and characterization of homogeneous immobilized TiO2 coatings on
stainless steel mesh and its PPCPs removal kinetics in wastewater by a combination of
AOPs (O3/UV/TiO2) and its comparison to other techniques; b)preparation of Indium
Oxide (In2O3) nano cubes, porous microspheres, nano plates and nano crystals, its
characterization and application in degradation of PPCPs from wastewater and c)
preparation of biochar, its characterization and application in removal of PPCPs from
1.3 Contribution of the thesis
To date, various treatment technologies have been used in the removal of PPCPs from
drinking water, distilled water and surface water but very few studies have been
conducted on wastewater and sludge. Although some of the AOPs were able to remove
these PPCPs completely in water but were not efficient in complete removal in
wastewater due to its complex water matrix such as the presence of natural organic
matter, color, odor, suspended solids, ions, etc. Some of the key contributions of this
research helped in improving the methods of removal of PPCPs from wastewater as
follows:
a) Extensive wastewater sampling, laboratory experiments and data analysis by
high resolution Liquid Chromatography Triple Quadrupole Mass Spectrometry
(LC-MS/MS)
b) A study of the combination of O3/UV/TiO2 AOP has improved the removal of
PPCP from wastewater
c) Use of In2O3 in the removal of PPCP from wastewater was conducted for the
first time as no published work to date has dealt with removal of these
compounds
d) Although activated carbon has been used in the removal of various organics and
PPCPs, biochar was used for the first time to remove PPCPs from wastewater
e) A combination of biochar and zeolite was studied to compare the removal
efficiencies of PPCPs from wastewater
1.4 Organization of the thesis
The thesis is written in an integrated-article format with each of the articles in
individual chapters containing separate introduction, tables, figures, results, discussion
and references. It is divided into six chapters and one appendix.
Chapter 2 presents a review of literature on PPCPs (atenolol, clofibric acid and
diclofenac) model compounds, various advanced oxidation processes (ozonation, UV,
TiO2, O3/UV, UV/TiO2, O3/TiO2 and H2O2), semi-conductor photocatalysis
(immobilization of TiO2 into thin films), and the applications of AOPs, Indium Oxide
and Biochar in degradation of PPCPs from wastewater.
Chapter 3 deals with PPCPs removal from wastewater by using advanced oxidation
process of O3/UV/TiO2 and its comparison with other AOPs. This chapter discusses
sampling procedure, wastewater characterization, methodology of LC-MS/MS,
adsorbent preparation on support medium by coating procedures and characterization of
the TiO2 films, influence of pH, variation of the concentration of TiO2 coatings, the
effect of the presence of natural organic matter and bromine in wastewater on PPCPs
removal, and the kinetics of the removal of the individual compounds.
Chapter 4 deals with the preparation and characterization of In2O3 in the form of porous
microspheres, nanocubes, nanoplates and nanocrystals and their application to PPCPs
(atenolol, clofibric acid and diclofenac) removal from wastewater and, the comparison
of the performance of microspheres, nanocubes, nanoplates and nanocrystals with that
of O3/UV/TiO2, O3/TiO2 and UV/TiO2.
Chapter 5 deals with the preparation and characterization of biochar and its application
to PPCPs (atenolol, clofibric acid and diclofenac) removal from wastewater and its
comparison with natural zeolite and activated biochar at varying pH and zeolite
concentration at varying adsorbent ratios.
Chapter 6 deals with conclusions from the study and recommendations for application
1.5 References
Al-Mutaz I.S., 2000. Water desalination in the Arabian Gulf region. In: Goosen MFA, Shayya WH, eds. Water management, purification and conservation in arid climates. Vol. 2. Water purification. Basel, Technomic Publishing, pp. 245–265.
Agüera, A., Pérez-Estrada, L.A., Ferrer, I., Thurman, E.M., Malato, S., Fernández-Alba, A.R., 2005. Application of time-of-flight mass spectrometry to the analysis of phototransformation products of diclofenac in water under natural sunlight. J. Mass Spectrum. 40:908–15.
Andreozzi, R., Raffaele, M., and Nicklas, P., 2003. Pharmaceuticals in STP effluents and their solar photodegradation in aquatic environment. Chemosphere. 50 (10), 1319– 1330.
Bartels, P., von Tümpling, Jr. W., 2007. Solar radiation influence on the decomposition process of diclofenac in surface waters. Science of the Total Environment. 374, 143– 155.
Benavent, M.S., Zhang, Y.- J., Geissen, S. U., 2009. Adsorption of pharmaceuticals on a synthesized silica and its regeneration with ozone. Masters student in Chemical Engineering, Universitat Rovira I Virgili, Tarragona, Spain and Department of Environmental Technology, Chair of Environmental Process, Technical University of Berlin, Germany. pp.2-5.
Bruchet, A., Hochereau, C., Picard, C., Decottignies, V., Rodrigues, J.M., and Janex-Habibi, M.L., 2005. Analysis of drugs and personal care products in French source and drinking waters: The analytical challenge and examples of application. Water Science and Technology. 52 (8), 53–61.
Carballa, M., Omil, F., and Lema, J.M., 2005. Removal of cosmetic ingredients and pharmaceuticals in sewage primary treatment. Water Res.39, 4790–4796.
Castiglioni, S., Bagnati, R., Fanelli, R., Pomati, F., Calamari, D., and Zuccato, E., 2006. Removal of pharmaceuticals in sewage treatment plants in Italy. Environ. Sci. Technol. 40, 357–363.
Clara, M., Strenn, B., Gans, O., Martinez, E., Kreuzinger, N., Kroiss, H., 2005. Removal of selected pharmaceuticals, fragrances and endocrine disrupting compounds in a membrane bioreactor and conventional wastewater treatment plants. Water Research. 39, 4797-4807.
Doll, T.E., Frimmel., F.H., 2004. Kinetic study of photocatalytic degradation of carbamazepine, clofibric acid, iomeprol and iopromide assisted by different TiO2
Dutta, K., Lee, M.Y., Lai, W.W.P., Lee, C.H., Lin, A.Y.C., Lin, C.F., Lin., J.G., 2014. Removal of pharmaceuticals and organic matter from municipal wastewater using two-stage anaerobic fluidized membrane bioreactor. Bioresource Technology. 165, 42–49.
Glaze, W.H., Kang, J.W., and Chapin, D.H., 1987. The Chemistry of water treatment processes involving ozone, hydrogen peroxide and ultraviolet radiation. Ozone Science and Engineering. 9, 335-352.
Heberer, T., Mechlinski, A., Fanck, B., Knappe, A., Massmann, G., Pekdeger, A., and Fritz, B., 2004. Field studies on the fate and transport of pharmaceutical residues in bank filtration. Ground Water Monitoring and Remediation. 24 (2), 70–77.
Hofmann, J., Freier, U., Wecks, M., Hohmann, S., 2007. Degradation of diclofenac in water by heterogeneous catalytic oxidation with H2O2. Appl. Catal. B. 70:447–451.
https://www.imshealth.com/files/imshealth/Global/North%20America/Canada/Home% 20Page%20Content/Pharma%20Trends/Top20GlobalTherapyAreas_EN_14.pdf (Date retrieved: 18th Oct, 2015).
http://www.fiercepharma.com/special-report/top-20-generic-molecules-worldwide. (Date retrieved: 26th May, 2014).
Huber, M.M., Canonica, S., Park, G.-Y., and von Gunten, U., 2003. Oxidation of pharmaceuticals during ozonation and advanced oxidation processes. Environ. Sci. Technol. 37, 1016–1024.
Karaman, R., Khamis, M., Quried, M., Halabieh, R., Makharzeh, I., Manassra, A., Abbadi, J., Qtait, A., Bufo, S.A., Nasser, A., 2012. Removal of diclofenac potassium from wastewater using clay-micelle complex. Environ. Technol. pp. 1279-1287.
Kim, M., Guerra, P., Shah, A., Parsa, M., Alaee, M., and Smyth, S.A., 2014. Removal of pharmaceuticals and personal care products in a membrane bioreactor wastewater treatment plant. Water Science & Technology. 69.11, 2221-2229.
Kreuzinger, N., Clara, M., Strenn, B., and Vogel, B., 2004. Investigation on the behaviour of selected pharmaceuticals in the groundwater after infiltration of treated wastewater. Water Science and Technology. 50 (2), 221–228.
NDC Health, USA, 2010. homepage.ntlworld.com/bhandari/Imperial/Atenolol/ Introduction. Htm (Date retrieved: 2015/07/09).
Perez-Estrada, L.A., Malato, S., Gernjak, W., Aguera, A., Thurman, E.M., Ferrer, I., and Fernandez-Alba, A.R., 2005. Photo-fenton degradation of diclofenac: Identification of main intermediates and degradation pathway. Environmental Science & Technology. 39 (21), 8300–8306.
Radjenovic´, J., Petrovic´, M., Barcelo´, D., 2007. Analysis of pharmaceuticals in wastewater and removal using amembrane bioreactor. Anal. Bioanal. Chem. 387 (4), 1365–1377.
Sonia Shah, 2010. As Pharmaceutical Use Soars, Drugs Taint Water and Wildlife. Yale environment 360, article 15 Apr. 2010. (Date retrieved: 2014/04/23).
Ternes, T.A., Meisenheimer, M., McDowell, D., Sacher, F., Brauch, H.J., Gulde, B.H., Preuss, G., Wilme, U., and Seibert, N.Z., 2002. Removal of pharmaceuticals during drinking water treatment. Environmental Science & Technology. 36 (17), 3855–3863.
Vogna, D., Marotta, R., Napolitano, A., Andreozzi, R., and d’Ischia, M., 2004. Advanced oxidation of the pharmaceutical drug diclofenac with UV/H2O2 and ozone.
Water Res. 38(2), 414–422.
Zhou, Z., and Jiang, J.Q., 3-5 September 2015. Removal of selected pharmaceuticals spiked in the secondary effluent of a wastewater treatment plant (WWTP) by potassium ferrate (VI). Proceedings of the 14th International Conference on Environmental Science and Technology, Rhodes, Greece. CEST2015_00043.
Chapter 2
2
Literature review
2.1 Introduction
2.1.1 Sources of PPCPs in the environment
The presence of pharmaceuticals in surface waters of Europe (particularly in
Switzerland, United Kingdom, Italy and Germany) and the United States has
encouraged several other scientists across the globe to investigate the presence of such
chemicals in lakes, streams, rivers and reservoirs in their regions. These studies have
further fueled interest beyond surface water studies to other water resources and
environmental systems such as groundwater, sediments, landfill leachates and biosolids.
Over $800 billion dollars of drugs were sold in 2008 worldwide, and the total audited
and unaudited Global Pharmaceutical Market sales during 2005-2014 increased from
US $608 billion to US $1057 billion dollars (IMS Health May, 2015). In addition, more
than 150 different human and veterinary medicines (including prescription and over the
counter medications) and drug metabolites were detected in the waters of Europe, USA
and as far as the Arctic region, which were discharged into the aquatic environment on
a continual basis from domestic and industrial sewage. Also, a federal study conducted
on 74 waterways found that 53 of these waterways that provide drinking water in 25
states were contaminated with traces of one or more pharmaceuticals. Although there
are no federal regulations of pharmaceuticals that exist for drinking water or
wastewater, only 12 of them are currently on the Environmental Protection Agency’s
list of drinking water standards (Bienkowski, 2013). Sampling performed by the United
States Geological Survey (USGS) has found that 80% of the streams and a quarter of
the groundwater resources in the United States are contaminated with a variety of
consumes approximately 17 grams of antibiotics alone, which is more than three times
the per capita rate of consumption in European countries such as Germany. Also,
farmers dispense approximately 11,000 metric tons of antimicrobial medications every
year to promote livestock growth (Sonia Shah, 2010).
Non-steroidal anti-inflammatory drugs (NSAIDs), Lipid regulator agents, Beta-blockers
and Antiepileptics are among the various categories of pharmaceuticals often found as
persistent toxic waste and are most widely used drugs in the world. For example, based
on 3.05 billion prescriptions for Atenolol, it is considered on 3rd rank as the best selling
hypertension drug in the world (NDC Health, USA, 2015), While Diclofenac 2011 sales
were at $1.61 billion putting it at 12th rank in the top 20 generic molecules worldwide
(Fierce Pharma, 2014). Clofibric acid, a metabolite of the lipid regulator clofibrate was
the first drug to be detected in water which enabled to detect concentration of other
PPCP compounds in water. Clofibric acid has been detected at a concentration of
103ng/L at A.H. Weeks Water Treatment Plant inlet in Windsor, Ontario, Canada, a
city that relies on the Detroit River for its drinking water source. Similar findings have
been reported for European surface waters (Stan et al., 1994; Stumpf et al., 1996;
Ternes, 1998; Daughton and Ternes, 1999). Due to the decline in the use of clofibrate in
the United States (WHO, 1996), clofibric acid is not present in Mississippi River and
Lake Pontchartrain waters (Boyd et al., 2003).
Increasing interest in water reuse and public health concerns about micro-pollutants
originating from a variety of pharmaceuticals, personal care products and common
household chemical agents has raised concerns about the fate and transformation of
these chemicals and their removal from water.
Increasing quantities of PPCPs are entering the environment due to growing use by
humans and domestic animals. In addition to antibiotics and steroids, over 100
individual PPCPs have been identified (as of 2007) in environmental samples and
drinking water. Sewage systems are not equipped for PPCP removal. Currently, there
are no municipal sewage treatment plants that are engineered specifically for PPCP
treatment plants varies based on the type of chemical and on the individual sewage
treatment facilities. The risks are uncertain. While the major concerns have been the
resistance to antibiotics and disruption of aquatic endocrine systems by natural and
synthetic sex steroids, many other PPCPs have unknown consequences. There are no
known human health effects from such low-level exposures in drinking water, but
special scenarios (one example being fetal exposure to low levels of medications that a
mother would ordinarily be avoiding) require more investigation. Most
pharmaceuticals retain their chemical structure in order to exert therapeutic effect. This
characteristic, along with the continuous release of pharmaceuticals into the
environment, may enable them to persist in the environment for extended periods of
time (Ternes, 2000).
2.1.2 Pathways of pharmaceuticals in the environment
Pharmaceuticals from biosolids are leached into surface water and groundwater by
rainfall and snowmelt (Ternes et al., 2004). Veterinary pharmaceuticals enter into the
environment either by seepage from manure lagoons or deposited onto the ground
directly from manures. Studies conducted on pharmaceuticals come from Europe
(Kreuzinger et al., 2004 and Heberer et al., 2004) followed by those that in United
States (Bruchet et al., 2005). These studies have produced most of the data on the
presence of pharmaceuticals in drinking water, rivers and wastewaters.
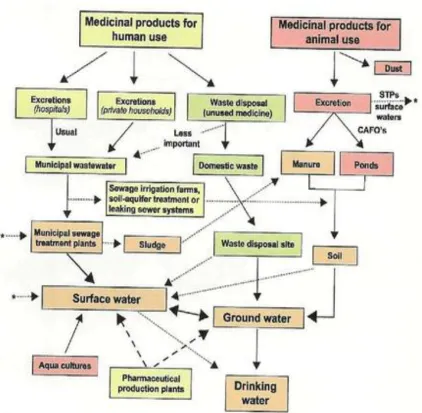
Figure 2.1 depicts number of sources and pathways through which pharmaceutical
substances enter into the environment mainly from wastewater treatment plants
(WWTPs) discharges or land application of animal manure and sewage sludge that are
used in human and veterinary medicine. Transformation of most of these active
ingredients occurs partially in the body and gets excreted into the sewage systems as a
Figure 2.1. Occurrence of pharmaceutical and its metabolite residues showing possible sources and pathways in the aquatic environment (Heberer and Adam, 2002a). Residues of animal excretions reaching surface waters or municipal STPs are represented by astrick.
2.1.3
Classification of PPCPs
The various categories of PPCPs that are classified based on their therapeutical groups
are Analgesics (diclofenac, naproxen, ibuprofen, ketoprofen and
trimethoprim, erythromycin and ciprofloxacin), antihyperlipidemics (clofibric acid,
bezafibrate and gemfibrozil), sun-screen products (e.g., methylbenzylidene camphor),
diagnostic agents (e.g., x-ray contrast media), cosmetics, fragrances (musks, tonalide
and galaxolide), nutraceuticals (e.g., vitamins), excipients (or inert ingredients used in
manufacturing and formulation of PPCPs) and other compounds (caffeine, bisphenol A
and carbamazepine). Many of the sources of these PPCPs are derived from human
activity, residues from hospitals and pharmaceutical manufacturing, antibiotics and
steroids, illicit drugs and agribusiness. PPCPs find their routes to (a) both surface water
(rivers, lakes, marine, streams) and groundwater; (b) solids (soils including agricultural
lands and sediments), (c) biota, and (d) air. Most of these drugs have insufficient vapor
pressures but gain entry to air while sorbed to fine particulates through dispersal (e.g.,
use of medicated feed dusts in confined animal feeding operations) (Daughton 2007).
2.1.4
Fate of Pharmaceuticals in the environment
The concentrations of PPCPs in surface water are higher than in groundwater by a
factor of 10 (Susan et al., 2008). Several physicochemical processes in water systems
play an important role in altering the pharmaceutical persistence and concentration in
the environment regardless of its entry route (Gurr and Reinhard, 2006). The fate of
PPCPs is divided into transport, sequestration and degradation categories: a) transport
of particulate and dissolved constituents from the point of entry; b) sequestration of
PPCPs in various environmental compartments; and c) deposition of particles,
bioconcentration and sorption without degradation of pharmaceuticals and stored
temporarily in other matrices or compartments.
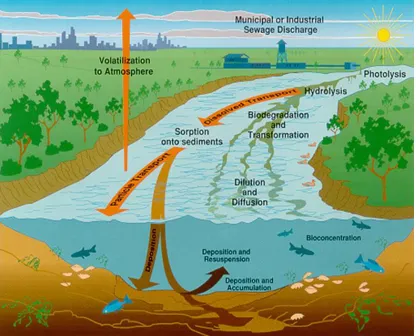
Biodegradation (Snyder et al., 2004), (Quintana et al., 2005), (Perez et al., 2005, Kim et
al., 2005, Carucci et al., 2006, Lindberg et al., 2006), photolysis (Perez-Estrada et al.,
2005, Lin et al., 2005, Andreozzi et al., 2003, Kwon et al., 2005, Lam et al., 2005,
Packer et al., 2003) and hydrolysis (Quintana et al., 2005) are three processes in the
aquatic environment that most likely mineralize or transform PPCPs as shown in Figure
Figure 2.2. Physical processes that affect the environmental concentrations of PPCPs (Meade H. R., 1995, U.S. Geological Survey Circular 1133, p. 114-135)
2.1.5
Occurrence of Pharmaceuticals in the environment
Pharmaceuticals have been detected frequently in the environment even after
incomplete removal from wastewater treatment or additional removal after discharge as
shown in Table 2.1 and Table 2.2, which also presents the concentrations of 124
compounds found in surface-water samples. These chemicals are moderated either by
dilution, biological degradation, sorption to the solid particles settled out of the waste
stream or oxidation by disinfection in wastewater treatment (Ternes et al., 2004). The
concentrations of these pharmaceuticals range from low parts-per-billion (low
micrograms-per-liter (μg/L)) to high parts-per-trillion (nanograms-per-liter (ng/L)) in
liquid effluents, whereas in biosolids they occur at parts-per-million
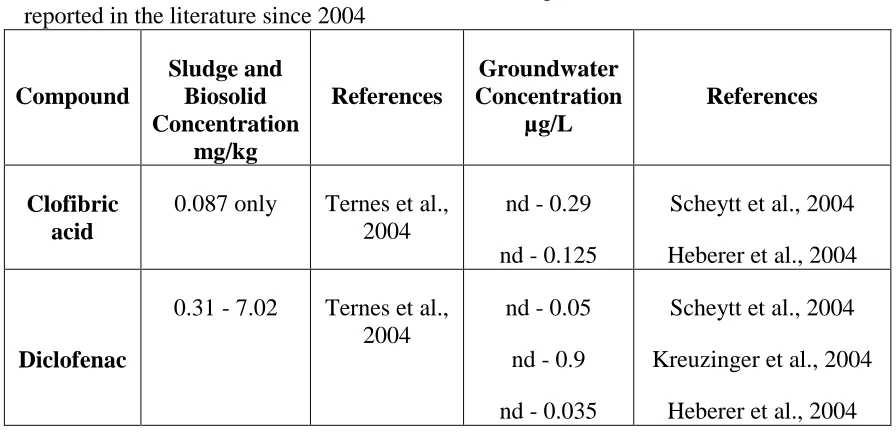
Table 2.1. Concentrations of Pharmaceuticals in Sludges, Biosolids and Groundwater, reported in the literature since 2004
Compound Sludge and Biosolid Concentration mg/kg References Groundwater Concentration µg/L References Clofibric acid
0.087 only Ternes et al., 2004
nd - 0.29
nd - 0.125
Scheytt et al., 2004
Heberer et al., 2004
Diclofenac
0.31 - 7.02 Ternes et al., 2004
nd - 0.05
nd - 0.9
nd - 0.035
Scheytt et al., 2004
Kreuzinger et al., 2004
Heberer et al., 2004
Table 2.2. Concentration of Pharmaceuticals in Wastewater Influents, Effluents and Surface Water, reported in the literature since 2004
Compound WWTP
Influent Conc., µg/L WWTP Effluent Conc., µg/L Surface Water Conc., µg/L Reference Atenolol
nd - 0.74 nd - 1.15 nd - 0.25 Gros et al., 2006
0.03 only 0.16 only 0.06 max Bendz et al., 2005
0.466 med 0.017 med Zuccato et al., 2005
0.042 max Castiglioni et al., 2004
0.19 med Paxeus et al., 2004
Clofibric
Acid
nd – 0.36 0.02 – 0.03 0.01 – 0.02 Gros et al., 2006
0.163 ave 0.109 ave 0.279 ave Quintana et al., 2004
nd - 0.022 Wiegel et al., 2004
nd – 0.651 nd – 0.044 Zhang et al., 2007
0.34 only Wolf et al., 2004
nd – 0.038 Brun et al., 2006
Compound
WWTP
Influent Conc.,
µg/L
WWTP
Effluent Conc.,
µg/L
Surface
Water Conc.,
µg/L
Reference
Diclofenac
0.16 only 0.12 only 0.12 max Bendz et al., 2005
0.05 – 0.54 nd – 0.39 nd – 0.06 Gros et al., 2006
2.333 ave 1.561 ave 0.272 ave Quintana et al., 2004
nd – 0.069 Kosjek et a., 2005
0.46 ave 0.4 ave Vieno et al., 2005
0.28 ave 1.9 ave nd – 0.282 Quintana et al., 2005
0.905 – 4.11 0.78 – 1.68 Clara et al., 2005
0.901 – 1.036 0.261 – 0.598 Roberts et al., 2006
0.14 med 0.14 med Lishman et al., 2006
0.05 – 2.45 0.07 – 0.25 Lee et al., 2005
nd - 2.349 Ashton et al., 2004
0.33 – 0.49 Thomas et al., 2005
nd - 0.5 Brun et al., 2006
0.01 - 0.04 Lindqvist et al., 2005
4.1 only Wolf et al., 2004
0.29 med nd – 0.089 Paxeus et al., 2004
0.032 – 0.457 Verenitch et al., 2006
0.06 - 1.9 nd – 0.003 Gomez et al., 2006