DOI: 10.7324/JAPS.2018.8821 ISSN 2231-3354
© 2018 Chairany Siregar et al. This is an open access article distributed under the terms of the Creative Commons Attribution License -NonCommercial-ShareA-likeUnported License (http://creativecommons.org/licenses/by-nc-sa/3.0/).
*Corresponding Author
Abdul Rohman, Department of Pharmaceutical Chemistry, Faculty of Pharmacy, Gadjah Mada University, Yogyakarta, 55281, Indonesia. E-mail: abdul_kimfar @ ugm.ac.id
Application of Fourier transform infrared (FTIR) spectroscopy
coupled with multivariate calibration for quantitative analysis of
curcuminoid in tablet dosage form
Chairany Siregar1,2, Sudibyo Martono1, Abdul Rohman1*
1Department of Pharmaceutical Chemistry, Faculty of Pharmacy, Gadjah Mada University, Yogyakarta, 55281, Indonesia. 2The National Agency of Drug and Food Control, District of Samarinda, East Kalimantan, Indonesia.
ARTICLE INFO ABSTRACT
Article history: Received on: 25/03/2018 Accepted on: 19/06/2018 Available online: 31/08/2018
Curcuminoid, especially curcumin (CUR) and desmethoxycurcumin (DMCUR), is regarded as active components of a pharmaceutical formulation containing Curcuma species responsible for several biological activities including anti-inflammatory and antioxidant. The objective of this research was to validate rapid and reliable method based on Fourier transform infrared (FTIR spectroscopy) in the mid-infrared region in combination with multivariate analysis for quantitative analysis of curcuminoid content in tablet formulation. FTIR spectra was subjected to several optimizations including wavenumbers selection and derivatization to get best prediction models for the relationship between actual values of curcuminoid as determined using high-performance liquid chromatography and FTIR calculated values. The first derivative FTIR spectra at wavenumbers of 2975-660 cm−1 using partial least square regression (PLSR) was preferred for quantification of CUR in tablet, while DMCUR was predicted using FTIR normal spectra at wavenumbers of 1784-1587 cm−1. The coefficient of determination (R2) values for calibration and validation
models either in CUR and DMCUR were of >0.99 indicating good accuracy methods. The errors in calibration and validation models were low indicating the acceptable precision of the developed method. FTIR spectroscopy combined with PLS regression can be used as an alternative technique for determination of CUR and DMCUR in tablet dosage form.
Key words:
curcumin,
demethoxycurcumin, PLS regression, tablet, FTIR spectra.
INTRODUCTION
Curcuminoid, mainly curcumin (CUR) and desmethoxycurcumin (DMCUR), with chemical structures as shown in Figure 1, has been reported to have some biological activities including antioxidant, anticancer and anti-inflammatory (Rohman, 2012). Curcuminoid has been used as chemical markers during biological activity studies related to Curcuma genus. Some pharmaceutical products containing Curcuma extracts has been commercially available in Indonesian markets such as Curcuma syrup (Wahyono and Hakim, 2007), capsule, and tablet formulations (Rajashree et al., 2013). Therefore, determination
of curcuminoid in those formulations was needed to assure the quality of curcuminoid contained in pharmaceutical products.
proposed for the analysis of analytes in a complex composition including curcuminoid in the extracts.
Fig. 1: The chemical structures of curcumin and demethoxycurcumin.
FTIR spectroscopy, based on the interaction between electromagnetic radiation currently in infrared region and samples, in combination with several chemometrics techniques, has emerged as powerful analytical tools in the pharmaceutical application (Chakraborty, 2016) due to its property as fingerprint spectra (Sim et al., 2004). In herbal medicine application, the combination of FTIR spectroscopy and chemometrics have been used for quantification of active pharmaceutical ingredients (Rohman, 2013), for discrimination between wild-grown and cultivated Ganoderma lucidum, an expensive herbal component commonly used in Chinese traditional medicine (Zhu and Tan, 2015), authentication of geographical origin of Gentiana rigescens
commonly used as liver protective in traditional Chinese medicine (Wu et al., 2017) and for quality assurance of herbal medicine (Rohman et al., 2014). FTIR spectroscopy combined with partial least square and principal component regression has been used for quantification of curcuminoid in extracts of Curcuma longa
(Rohman et al., 2015) and Curcuma xanthorrhiza (Lestari et al., 2017). The reported publication regarding curcuminoid analysis, so far, was in extracts or powder and using literature review, there
are no reports related to the quantitative analysis of curcuminoid in tablet formulation. Therefore, in this study, FTIR spectroscopy at specific infrared region combined with multivariate calibration was optimized for quantitative analysis of curcuminoid (CUR and DMCUR).
MATERIALS AND METHODS
Curcumin (CUR) and desmethoxycurcumin (DMCUR) were isolated from commercial curcuminoid purchased from E. Merck (Darmstadt, Germany). Isolation was performed following method as described in Lestari et al. (2017). Thin Layer Chromatography (TLC) and High-Performance Liquid Chromatography (HPLC) were used to check the purity of CUR and DMCUR. The purity of CUR and DMCUR was performed using internal normalization technique. Tablet samples were purchased from several pharmacies around Yogyakarta, Indonesia. The placebo of samples was kindly given by PT. SOHO Pharmaceutical Industry (Jakarta, Indonesia).
HPLC analysis
HPLC analysis of individual curcuminoid was performed according to Siregar et al. (2017) using Shimadzu LC-20AD (Kyoto, Japan) equipped with Rheodyne 7725i injection valve with a 20 μL loop volume and binary gradient pump. Detection was carried out Shimadzu Photodiode Array Detector (SPD-M20A) operated at a wavelength of 425 nm. Chromatographic separation was performed using Waters X-Bridge C-18 (250 mm × 4.6 mm i.d; 5 µm), set at 45°C. The mobile phase used consisted of a binary mixture of acetonitrile-acetic acid 3.00% (49:51 v/v), delivered in an isocratic manner with flow rate arranged at 1.08 mL/min. For the preparation of a stock solution of samples, an accurately weighed amount of samples (about 200.0 mg) was transferred into a 25 mL volumetric flask, added with about 10 mL methanol, sonicated for 30 min, and then diluted with mobile phase to volume. The samples were homogenized and centrifuged for 10 min at 10.000 rpm. A portion of sample stock solution was diluted (1 in 20 mL for CUR and 2.5 in 5 mL for DMCUR) with mobile phase, mixed, and then filtered using 0.45 µm filter before being injected into HPLC system.
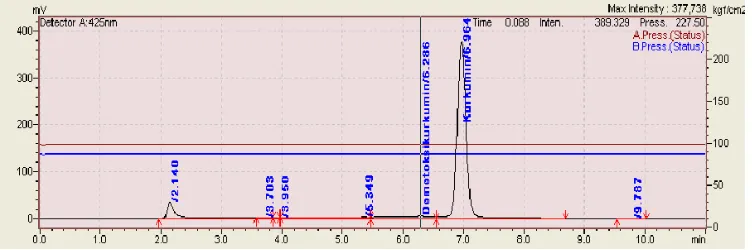
Fig. 2: HPLC chromatogram obtained during analysis of desmethoxycurcumin (tR of ± 6.28) and curcumin (tR of ± 6.96). For HPLC condition, see section of HPLC analysis.
Preparation of calibration and validation samples
In order to facilitate the calibration model, a tablet containing CUR and DMCUR was added with placebo with variety composition to get a different concentration of CUR
different composition of placebo was used. The concentration of CUR and DMCUR in validation samples was predicted using the calibration model previously built.
FTIR spectroscopy analysis
The powdered tablet samples were placed on Smart iTR™ Attenuated Total Reflectance (ATR) accessory composed of diamond crystal as sample handling technique at a controlled ambient temperature (25°C). Samples were scanned using Nicolet iS10 FTIR spectrophotometer (Thermo Fisher Scientific Inc, Madison, USA) equipped with deuterated triglycine sulfate (DTGS) detector and potassium bromide (KBr)/Germanium as a beam splitter. The instrument was connected to software OMNIC ver.9.7 and spectra were scanned at wavenumbers of 4000-650 cm−1, recorded for 32 scans at a resolution of 8 cm−1. The air spectrum was used as background. Each data point was recorded in three replicates using absorbance mode to facilitate quantitative analysis (Rohman et al., 2014).
Chemometric analysis
Multivariate analyses consisted of partial least square regression (PLSR) and principal component regression (PCR) were performed using software TQ Analyst ver.9.7 (Thermo Fisher Scientific Inc., Madison, WI) included in Nicolet iS10 FTIR instrument. PLSR and PCR were used to build a predictive model which correlated the actual values of CUR and DMCUR from HPLC determination and FTIR predicted values. Statistical parameters namely coefficient determination (R2), Root Mean
Square Error of Calibration (RMSEC) and Root Mean Square Error of Predicted (RMSEP) were computed using TQ Analyst software.
RESULTS AND DISCUSSION
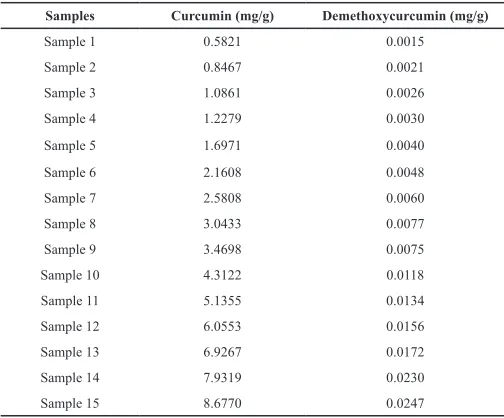
HPLC, due to its capability to be used for qualitative, quantitative and preparative analyses, is a standard method for analysis of active components in herbal medicine including determination of curcumin (CUR) and desmethoxycurcumin (DMCUR) in plant extracts (Prabaningdyah et al., 2017). Figure 2 revealed HPLC chromatogram for separation and quantification of CUR and DMCUR in some tablet samples containing C. xanthorrhiza in its formulation. However, HPLC is time-consuming and needs skillful analysis. Therefore, in this study, FTIR spectroscopy was developed for routine analysis of CUR and DMCUR in any pharmaceutical products. The levels of CUR and DMCUR in tablet formulation used as actual values of CUR and DMCUR were determined by HPLC using photo-diode array detector at λ 425 nm, and their results obtained were compiled in Table 1. The variation of CUR and DMCUR compositions in evaluated tablets was coming from the addition of tablets with placebo to facilitate calibration models during FTIR spectroscopic analysis.
FTIR spectra of a tablet containing extract of C. xanthorrhiza with curcuminoid as active components were depicted in Figure 3. Each peak was corresponding to a functional group present in two main curcuminoids present in C. xanthorrhiza, namely CUR and DMCUR (Lestari et al., 2017). The clear and broad peak at wavenumbers (1/λ) of 3200 cm−1 corresponded to stretching vibration of hydrogen-bonded (-OH) present in
curcuminoid, while peaks at 2950 and 2900 cm−1 originated from stretching vibrations of methyl (CH3) and methylene (CH2-) groups, respectively. The bending vibrations of CH3 and CH2 were also observed at 1/λ 1339 and 1423 cm−1, respectively. Conjugated carbonyl group was observed at 1/λ 1655 cm−1, lower than 1/λ in unconjugated carbonyl (Prabaningdyah et al., 2018). Table 2 compiled the functional groups responsible for IR absorption of tablet placebo spiked with Curcuma xanthorrhiza. The presence of these functional groups as indicated in each peak in FTIR spectra proved that the studied tablet contained Curcuma extract. Table 1: The concentrations of curcumin and desmethoxycurcumin in tablet samples.
Samples Curcumin (mg/g) Demethoxycurcumin (mg/g)
Sample 1 0.5821 0.0015
Sample 2 0.8467 0.0021
Sample 3 1.0861 0.0026
Sample 4 1.2279 0.0030
Sample 5 1.6971 0.0040
Sample 6 2.1608 0.0048
Sample 7 2.5808 0.0060
Sample 8 3.0433 0.0077
Sample 9 3.4698 0.0075
Sample 10 4.3122 0.0118
Sample 11 5.1355 0.0134
Sample 12 6.0553 0.0156
Sample 13 6.9267 0.0172
Sample 14 7.9319 0.0230
Sample 15 8.6770 0.0247
Table 2: The functional groups responsible for IR absorption of tablet placebo
spiked with Curcuma xanthorrhiza (Lestari et al., 2017).
Wavenumbers (1/λ)
(cm−1) Functional groups along with mode of vibration
3260 Stretching vibration of hydrogen-bonded (-OH)
2950 and 2900 Stretching vibrations of methyl (CH3) and methylene
(CH2-) groups
1655 Stretching vibration of conjugated carbonyl (C=O) group
1423 CH2- bending
1339 CH3- bending
1259 C-O stretching
1201 C-O stretching
1140 C-O stretching
1114 C-O stretching
1017 C-OH stretching
988 -HC=CH-(trans) out of plane
899 -HC=CH-(cis) out of plane
757 -(CH2)n; -HC=CH- bending
DMCUR using FTIR spectroscopy was relied on its capability to offer the highest coefficient of determination (R2) and lowest
calibration and validation errors. To facilitate this correlation, two multivariate calibrations namely partial least square regression (PLSR) and principal component regression (PCR) were used and optimized. Table 3 compiled the performance of multivariate calibrations for prediction of CUR and DMCUR in Curcuma tablet
along with statistical values, namely R2 and root mean square
error of calibration (RMSEC) and error in prediction (RMSEP). The accuracy and precision of FTIR spectroscopic-multivariate calibration can be expressed by R2, RMSEC, and RMSEP. The
higher R2 and the lower RMSEC and RMSEP, the better the
prediction models (Sim et al., 2004).
Fig. 3: FTIR spectra of tablet placebo spiked with Curcuma xanthorrhiza containing curcumin and desmethoxycurcumin at wavenumbers of 4000-650 cm−1.
Table 3: The performance of multivariate calibration of partial least square regression (PLSR) and principle component regression (PCR) for prediction of curcumin and demethoxycurcumin in tablet formulation.
Multivariate
calibration Wavenumber (cm−1) treatmentSpectral
Curcumin Demethoxycurcumin
Number of
Factor R2 calib. RMSEC R2 val. RMSEP Number of Factor R2 RMSEC R2 RMSEP
PLSR
2183-993 Normal 8 0.9874 0.254 0.9821 0.425 8 0.9876 0.000705 0.9811 0.00135
2183-993 1st-der 6 0.9930 0.191 0.9878 0.372 6 0.9938 0.000502 0.9906 0.000902
1784-1587 Normal 5 0.9900 0.228 0.9928 0.256 7 0.9920 0.000565 0.9924 0.000729
1784-1587 1st der 4 0.9934 0.191 0.9894 0.332 5 0.9954 0.000427 0.9916 0.000754
1806-965 Normal 8 0.9876 0.254 0.9851 0.391 10 0.9924 0.000554 0.9831 0.00113
1806-965 1st der 6 0.9900 0.226 0.9862 0.355 7 0.9944 0.000472 0.9884 0.000941
1712-653 and
3397-2873 Normal 9 0.9930 0.195 0.9986 0.236 9 0.9920 0.000585 0.9964 0.00103 1712-653 and
3397-2873 1st der. 8 0.9962 0.144 0.9914 0.308 7 0.9940 0.000509 0.9964 0.00111 2975-660 Normal 8 0.9948 0.168 0.9984 0.206 10 0.9962 0.000401 0.9988 0.000926
2975-660 1st der. 7 0.9968 0.126 0.9964 0.254 10 0.9990 0.000198 0.9974 0.00107
PCR
2183-993 Normal 10 0.9779 0.338 0.9769 0.517 10 0.9757 0.000985 0.9841 0.00152
2183-993 1st der. 10 0.9833 0.294 0.9795 0.488 10 0.9857 0.000760 0.9910 0.00108
1784-1587 Normal 10 0.9914 0.212 0.9928 0.269 10 0.9914 0.000589 0.9938 0.000658
1784-1587 1st der 10 0.9902 0.224 0.9882 0.315 10 0.9918 0.000574 0.9936 0.000640 1712-653 and
3397-2873 Normal 10 0.9888 0.249 0.9984 0.246 10 0.9843 0.000821 0.9960 0.00117 1712-653 and
3397-2873 1st der 10 0.9688 0.415 0.9817 0.43 10 0.9657 0.00121 0.9700 0.0018 2975-660 Normal 10 0.9868 0.263 0.9986 0.236 10 0.9817 0.000869 0.9978 0.00112
(A)
(B)
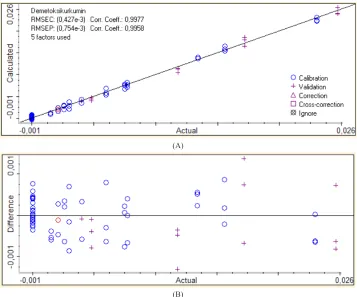
Fig. 4: The correlation between actual values of curcumin and FTIR predicted values using FTIR spectroscopy-partial least square regression (A) along with residual analysis (B).
(A)
(B)
Based on the optimization using several parameters (types of multivariate calibration, wavenumbers region, spectral treatment based on normal and its first derivative), CUR was preferred to be quantified using first derivative spectra at combined wavenumbers of 2975-660 cm−1 with 7 factors. The R2 obtained
for calibration and validation models for quantitative analysis of CUR using PLSR were 0.9968 and 0.9964, with RMSEC and RMSEP values of 0.126% and 0.254%, respectively. Furthermore, PLSR using wavenumbers of 1784-1587 cm−1 with 5 factors was preferred for quantification of DMCUR in a tablet with R2 values
in calibration and validation of 0.9954 and 0.9916, respectively. The RMSEC and RMSEP values obtained were of 0.000427% and 0.000754%.
Figure 4 and Figure 5 revealed the correlation between actual values of CUR and DMCUR with FTIR predicted values using optimized condition assisted with PLSR along with residual analysis to evaluate the difference between actual and predicted values. From the residual analysis, it can be confirmed that residual values fall around zero (0) difference, above and below zero value. This indicated that errors occurred can be negligible. From these results, it can be concluded that FTIR spectroscopy using optimum condition can be used for prediction of CUR and DMCUR with acceptable accuracy as indicated by the high value of R2 and precision as indicated by low levels of RMSEC, RMSEP
and residual values. FTIR spectroscopy in combination with chemometrics of multivariate calibration offered a fast and reliable technique for quantitative analysis of pharmaceuticals with fixed composition, however, if the placebo or matrix composition used was different, a new model calibration and validation must be developed.
CONCLUSION
FTIR spectroscopy in combination with multivariate analysis can be used as an alternative technique for quantitative analysis of CUR and DMCUR in table dosage form. The accuracy and precision of FTIR spectroscopy assisted with PLSR were acceptable. This developed method was rapid and suitable for routine analysis. However, if the composition of tablet used was different, a new model must be developed, and indeed the model was also validated.
ACKNOWLEDGMENT
The authors acknowledge to Kemenristek Dikti (the Ministry of research and higher education, Republic of Indonesia) for financial support during this study with contract number of 2328/UN1.P.III/DIT-LIT/LT/2017 awarded to Prof. Dr. Abdul Rohman. The National Agency of Drug and Food Control, District of Yogyakarta, Republic of Indonesia was acknowledged for supporting HPLC facilities that make this study possible. We also thanks PT. SOHO Pharmaceutical Industry (Jakarta, Indonesia) for supporting sample placebo.
CONFLICTS OF INTEREST
There are no conflicts of interest.
REFERENCES
Chakraborty DS. Instrumentation of FTIR and its herbal applications. World J Pharm Pharmaceutical Sci, 2016; 5(3):498-505.
Lestari HP, Martono S, Wulandari R, Rohman A. Simultaneous
analysis of Curcumin and demethoxycurcumin in Curcuma xanthorrhiza
using FTIR spectroscopy and chemometrics. Int Food Res J, 2017; 24(5):2097-2101.
Long Y, Zhang W, Wang F, Chen Z. Simultaneous determination of three curcuminoids in Curcuma longa L. by high performance liquid chromatography coupled with electrochemical detection. J Pharm Anal, 2014; 4(5):325-330.
Prabaningdyah NK, Riyanto S, Rohman A, Siregar C. Application of HPLC and response surface methodology for simultaneous determination of curcumin and desmethoxy curcumin in Curcuma syrup formulation. J Appl Pharm Sci, 2017; 7(12):58-64.
Prabaningdyah NK, Riyanto S, Rohman A. Application of FTIR spectroscopy and multivariate calibration for analysis of curcuminoid in syrup formulation. J Appl Pharm Sci, 2018; In Press.
Rajashree R, Divya G, Sushma P, Kanchan I, Sachin K. Analytical Study of Curcumin Content in Different Dosage Forms Containing Turmeric Extract Powder and Turmeric Oleoresin Int Res J Pharm, 2013; 4(3):182-185.
Rohman A. Analysis of curcuminoids in food and pharmaceutical products. Int Food Res J, 2012; 19(1):19-27.
Rohman A. Application of Fourier Transform Infrared Spectroscopy for Quality Control of Pharmaceutical Products: a Review. Indones J Pharm, 2013; 23(1):1-8.
Rohman A, Nugroho A, Lukitaningsih E, Sudjadi. Application of vibrational spectroscopy in combination with chemometrics techniques for authentication of herbal medicine. Appl Spectrosc Rev, 2014; 49(8):603-613.
Rohman A, Sudjadi, Ramadhani D, Nugroho A. Analysis of Curcumin in Curcuma longa and Curcuma xanthorrhiza Using FTIR Spectroscopy and Chemometrics. Res J Med Plant, 2015; 9(4):179-186.
Sharma K, Agrawal SS, Gupta M. Development and validation of UV spectrophotometric method for the estimation of curcumin in bulk drug and pharmaceutical dosage forms. Int J Drug Dev Res, 2012; 4(2):375-380.
Silverstein RM, Webster FX, Kiemle DJ. 2005. Spectrometric identification of organic compounds. Hoboken, NJ: John Wiley & Sons.
Sim C, Hamdan M, Ismail Z, Ahmad M. Assessment of Herbal Medicines by Chemometrics – Assisted Interpretation of FTIR Spectra. Anal Chim Acta, 2004; 570:1-14.
Syed HK, Bin Liew K, Loh GOK, Peh KK. Stability indicating HPLC-UV method for detection of curcumin in Curcuma longa extract and emulsion formulation. Food Chem, 2015; 170:321-326.
Siregar C, Prabaningdyah NK, Choiri S, Riyanto S, Rohman A. Optimization of HPLC Using Central Composite Design for Determination of Curcumin and Demethoxycurcumin in Tablet Dosage Form. Dhaka Univ J Pharm Sci, 2017; 16(2):137-145.
Wahyono D, Hakim AR. Effect of the curcuma plus® syrup on the pharmacokinetics of rifampicin in rats. Indonesian J Pharm, 2007; 18(4):163-168.
Wu Z, Zhao Y, Zhang J, Wang Y. Quality Assessment of Gentiana rigescens from Different Geographical Origins Using FT-IR Spectroscopy Combined with HPLC. Molecules, 2017; 22:1238.
Zhang Q, Acworth I. The quantitative analysis of curcuminoids in a food additive and foods evaluated using rapid HPLC with electrochemical, UV or fluorescence detection. Planta Med, 2013; 79:PO1.
Zhu Y, Tan ATL. Discrimination of Wild-Grown and Cultivated Ganoderma lucidum by Fourier Transform Infrared Spectroscopy and Chemometric Methods. Am J Anal Chem, 2015; 6(5):480-491.
How to cite this article:
Siregar C, Martono S, Rohman A. Application of Fourier
transform infrared (FTIR) spectroscopy coupled with
multivariate calibration for quantitative analysis of curcuminoid