SCHLUMBERGER
RESISTIVITY
SOUNDINGS
FOR
GROUNDWATER
EXPLORATION: A CASE STUDY OF KAJURU AREA OF NORTHERN NIGERIAN
BASEMENT COMPLEX
Elijah E. Nkitnam*1, Ema M. Abraham1, Ifeanyi Obihan2, Joseph O. Osumeje3, Bisan Yabuwat4, Cyril G. Afuwai5, Collins C. Chiemeke6, Kolawole M. Lawal3, and Chibuike N. Nnamani7
*1Department of Geophysics, Federal University, Ndufu Alike Ikwo, Nigeria. 2Department of Earth Science, Salem University, Lokoja, Nigeria
3Department of Physics, Ahmadu Bello University, Zaria, Nigeria 4National Oil Spill Detection and Response Agency, Kaduna, Nigeria 5Department of Physics, Federal University, Dutsen-Ma, Nigeria 6Department of Physics, Federal University, Otuoke, Nigeria
7Department of Mathematics, Ahmadu Bello University, Zaria, Nigeria
KEYWORDS
:
Kajuru, Basement Complex, Schlumberger Soundings, 1D Layer Model, Aquifer.ABSTRACT
Geoelectric soundings using the symmetric Schlumberger configuration were carried out to investigate the groundwater potential in fifteen communities of Kajuru local government area within the Northern Nigerian Basement Complex. The project employed the acquired vertical electrical soundings (VES) data and hydrogeophysical expression of structural features and aquiferious zones to model groundwater prospects in the area. Model layers correspond to weathered, fractured and fresh basement zones of varied thickness and lithology.
The VES curves obtained were predominantly KH and QH type curves. The topsoil, laterites and pebbles have
thicknesses from 2-7m with a resistivity range of 2807m-3600 Ωm. Following this layer is a progression into mainly sandy clay units with a weathered denser sandier base. The thickness of the zone varies from 8-20m and resistivity range of 198-406 Ωm. The partially weathered and fractured portions of the basement have thickness ranges of 9-26m and resistivity of 106-357Ωm. The depth to fresh basement extent from 28m to 36m depending on the intensity of fracturing and weathering, it has resistivity greater than 650 Ωm. The permeable rock units are
the fine-coarse sands of the weathered basement and crystalline fractures. Thegroundwater potentials of the sites
investigated appears generally reasonable for borehole development.
INTRODUCTION
Kajuru Local Government Area is situated south of Kaduna city; it is one of the twenty-three (23) local government areas of Kaduna State of Nigeria. Kajuru local government area is located within latitude 9° 59'N and
10° 55'N and longitude 7° 34'E and 8° 13'E with an area of 2,464 km2. The area is situated within the Guinea
savannah belt of Nigeria; it has a mean annual rainfall of 1400mm while the day time temperature can be as high as 34°C. The area is largely a rural settlement tending toward semi urban; it has a population estimate of 110,868 with an annual growth rate of 2% [1]. The population is dominant by Adara ethnic group, whose occupation includes farming and trading. The settlements of Kajuru Local Government area are rapidly expanding due to increasing population density and urbanization. Hence pressure is continuously been put on existing water supply facilities including wells and streams. These pressure and seasonal variations in groundwater level, is usually climax in some parts by dry wells and streams during the peak of dry season. This has necessitated investigation for alternative and sustainable sources of water supply to meet the demand of the growing agrarian communities of Kajuru Local Government Area.
Borehole drilling and construction has become of recent a reliable source of water supply now patronized by government, individuals and organizations. To reduce the risk involve in drilling abortive borehole, Geophysical techniques are employed to assess geologic and hydro geologic conditions that control ground water flow such as fractures, buried channels or geologic traps.
This study is aimed at the application of resistivity sounding technique to delineate potential aquifer zones in the crystalline rocks and the regolith units of the Basement Complex in Kajuru Area; and hence identify suitable sites for the drilling and construction of productive water boreholes, in line with the global campaign for increasing access to clean and portable drinking water to inhabitants and the promotion of sanitation practice.
Geological and Hydrogeological Setting
Kajuru area lies within the northern section of the Nigerian geological provinces composed of Precambrian basement complex rocks (Figure 1).
i)The Basement Complex which comprises over 50% of the country’s area and are moderate to poor aquifers, contributing to the groundwater supply. It consists of low permeability rocks with groundwater occurring in weathered mantle and fractured zones. Yields frequently range between less than 1.0 l/s and 2.0l/s. ii)The sedimentary Basin Formations such as the Tertiary deposits of the Chad and Sokoto Basins, the
Cretaceous deposits of the Niger and Benue troughs, and the sedimentary formations of the Niger Delta, yield groundwater in varying quantities.
iii) The Tertiary Volcanics found in parts of Plateau, Cross River, Adamawa and Taraba states.
The rock units in Kajuru area have been mapped (Figure 2): [6] carried out regional mapping of the rocks in the area which include gnesis, granites and schist. [2] also documented the major rock units to include the gneisses (porphyroblastic, granitic and banded), and the biotite granites (porphyritic and medium to coarse grained varieties).
In the area, the Granitic outcrops form elevated inselbergs and pavements. Alluvium and laterites occur as superficial deposit. There are also expressions of structural features (fractures, voids and pore openings) that aid groundwater movement, accumulation and abstraction. The detection of these structures and permeable (weathered rock) units are the targets of the resistivity method in the basement terrain such Kajuru area.
MATERIALS AND METHODS
The investigations consisted mainly of geological reconnaissance, hydrogeological assessment and vertical electrical soundings (VES) at strategically located points and orientations.
Geophysical resistivity techniques are based on the response of the earth to the flow of electrical current. In this investigation, the vertical electrical sounding (VES) technique which is a 1-D resistivity approach was employed. It involves the use of a pair of current electrodes and a pair of potential electrodes to the measure the resultant potential difference within the subsurface (Figure 3). By increasing the spacing of the electrodes, the depth of the investigation below the centre point is increased. The full Schlumberger configuration was adopted with maximum half-current electrode spread (AB/2) between 1 and 80m while the half-potential electrode separation (MN/2) was maintained between 0.3 and 5m. Terameter SAS 300C was used to carry out the resistivity measurements in the field.
Figure 2: Geological Map of the Study Area (Modified from [2], [6])
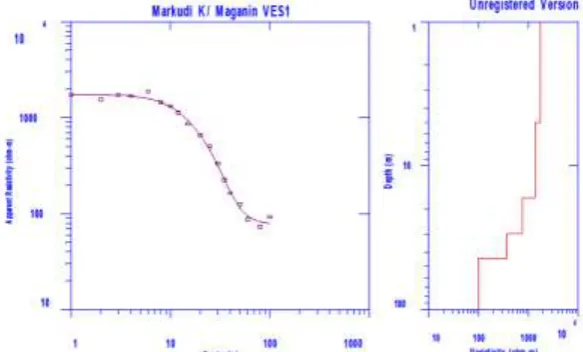
Figure 4: 1D Inversion of apparent resistivity data of the VES point (VES1) at Ibira in modelled curve and cross-section
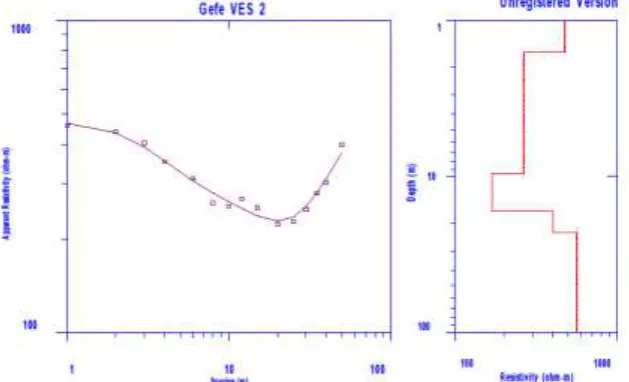
Figure 6: 1D Inversion of apparent resistivity data of the VES point (VES2) at Gefe in modelled curve and cross-section
RESULTS AND DISCUSSION
The measured VES data are the results of the variations with depth of the subsurface resistivity as a function of the surveyed geometry and the electrical impedance of the sub surface material. These resistivity measurements termed apparent resistivity data are plotted as 1-D sounding curves on a log-log scale and interpreted in terms of lithologic and or geohydrologic model of the subsurface.
The initial results of the VES survey were obtained by curve matching the plotted sounding curves with standard master curves and their auxiliary point charts following the procedure outlined by [14]. The field curves obtained at these locations is a four to model. The type of field curves and resistivity sequences of the layers are presented in Table 1.
Table 1: Type of field curves obtained at the specified locations
S/No. Location Name Layers Types of Curves Sequences of Layers VES No.
1. Akusha 4 KH 𝜌1< 𝜌2> 𝜌3< 𝜌4 VES 1
2. Gefe 4 QH 𝜌1> 𝜌2> 𝜌3< 𝜌4 VES 2
3. Gurgu 4 QH 𝜌1> 𝜌2> 𝜌3< 𝜌4 VES 2
4. Ibira 4 KH 𝜌1< 𝜌2> 𝜌3< 𝜌4 VES 1
5. Janwuriya 4 KH 𝜌1< 𝜌2> 𝜌3< 𝜌4 VES 1
6. Makurdi Kasuwan
Maganin
4 QQ 𝜌1> 𝜌2> 𝜌3> 𝜌4 VES 1
7. Rafin Roro 4 QH 𝜌1> 𝜌2> 𝜌3< 𝜌4 VES 2
8. Rimau 4 QH 𝜌1> 𝜌2> 𝜌3< 𝜌4 VES 2
the area. The topsoil, laterites and pebbles has thicknesses varying from 2-7m with a resistivity range of 2807-3400 Ωm. Below is a gradation into mainly sandy clay layer with a weathered denser sandier base. Thickness of the zone varies from 8-20m and resistivity range of 198-406 Ωm. Following is the basement with partially weathered/fractured portions. This zone may be hard with boulders depending on the weathering history with individual thickness ranges of about 9-26m and resistivity of 106-357 Ωm, depending on the VES position. At the base of the investigated column is fresh basement of resistivity often greater than 650 Ωm.
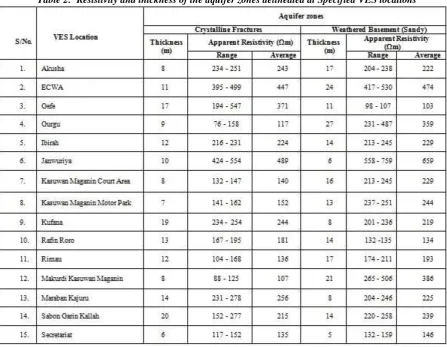
The Measurement of resistivity (inverse of conductivity), is in general, a measure of water saturation and connectivity of pore spaces [18], [19], [20]. The Vertical Iso-ohms Sections of the geoelectric models enable the delineation of anomalous zones of very low to moderately low resistivity values as potential aquifer zones. Therefore the unsaturated zones can be distinguished from the saturated zones of the weathered sandy units and the water filled fractures. The mapped aquifer zones in each VES Location including their thickness and apparent resistivities are shown in Table 2.
Table 2: Resistivity and thickness of the aquifer zones delineated at Specified VES locations
The relatively high to moderate resistivity values relate to thick columns of laterites and clayey units around Kasuwan Maganin and environ, which vary toward Gurgu, Rimau, Gefe and Rafin Roro can be attributed to the highly saprolitic basement in the area. Also, the increase in resistivity values at depth following the anomalous zones indicates the penetration of an impermeable, nonconductive layer inferred as the fresh basement.
Thus the model sections derived from the geoelectric parameters suggest that thegroundwater potentials of the
CONCLUSION
The one dimensional (1D) inversion model of the vertical variations of subsurface resistivity at depths was achieved. These subsurface models have been inferred to reflect four lithological layers in light of the geological setting in the area. The geologic sections derived from the geoelectric parameters suggest that the main aquifers (the permeable rock units) in the area are the sandy units of the weathered basement and crystalline fractures. The groundwater potentials of the sites investigated appears generally reasonable for borehole development. Therefore the drilling of productive boreholes is envisaged at depths of between of about 40 and 50m in the area.
ACKNOWLEDGEMENTS
Engr. Douglas K. Njimen, Mr. Danjuma Awhila, Mr. John Sarkin-Samari and Mr. David Magaji of Kaduna State Ministry of Water Resources are appreciated for their encouragement.
REFERENCES
1. National Population Commission (NPC), Population and Housing census report, Abuja, Nigeria, 2006.
2. Amuda, A.G., Adedokun, T.A., Uche, O.A.U., and Amuda, A.K. Engineering geological Characterization
of Basement Rocks for Construction Aggregates: A Case Study of Kajuru Area Kaduna, Nigeria. Civil and
Environmental Research, Vol. 6, No.12, 2014: www.iiste.org
3. Arisekola, T. M. and Ajenipa, R.A. Progress report of Nigeria airborne Geophysical data results: Preliminary
applications to uranium and thorium exploration. IAEA-CYTED-UNECE Workshop on UNFC-2009 at Santiago, Chile, 2013.
4. Afolalu, F.O., Lawal, K.M., and Ahmed A.L. Grouting trotting of an aeroradiometric anomaly in Kajuru
Area, Northcentral Nigeria. Journal of Mining and Geology, Volume 45 Number 1 pp 21-26, 2009.
5. McCurry, P. The Geology of the Precambrian to Lower Palaeozoic Rocks of Northern Nigeria- A review.
In: Kogbe, C.A. (Ed) Geology of Nigeria, Elizabethan Press, Lagos, pp. 15 -19, 1976.
6. Udo, A.N. 1973. Note on the geology of Sheet 45 (Kajuru), Nigerian Geological Survey Agency, Kaduna
7. Aboh, H.O. Detailed regional geophysical investigation of the subsurface structures in Kaduna Area,
Nigeria: PhD Dissertation, Ahmadu Bello University, Zaria, 2001.
8. Aboh, H.O., and Osazuwa, I.B. Lithological deduction from a regional geoelectric investigation in Kaduna
Area, Kaduna State, Nigerian Journal of Physics, Volume 12, pp 1-2, 2000.
9. Dan-Hassan, M. A., and Olorunfemi, M. O. Hydro- geophysical investigation of a basement terrain in the
North-central part of Kaduna State, Nigeria: Journal of Mining and Geology, Volume 35 Number 2, pp 189
– 206, 1999.
10. Ajibade, A.C. and Fitches, W.R. The Nigerian Precambrian and the Pan-African Orogeny. In: Precambrian
Geology of Nigeria, A publication of the Nigerian Geological Survey Agency, Abuja, Nigeria. pp. 45-55, 1988.
11. Dan-Hassan, M. A. Managing Nigeria’s Groundwater Resources for Safe Drinking Water: A paper
presented at the Nigeria Water and Sanitation Association Workshop, June 16 – 18, 2014, Abuja, 2014.
12. Adelana, S. M. A., Olasehinde, P. I., Vrbka, P., Edet, A. G. and Goni, I. B. An overview of the Geology and
Hydrogeology of Nigeria. In: S. M. .A. Adelana and A. M. Mc Donald (Eds.), Applied groundwater studies
in Africa. IAH Selected papers in Hydrogeology, Vol. 13. Leiden, Netherlands. CRC Press/Balkema, 2008.
13. Offodile, M.E. Hydrogeology: Groundwater study and development in Nigeria. Mecon Geology and
19. Telford W. M, Geldart, L. P., and Sheriff, R. E. Applied Geophysics, Second edition, Cambridge University Press, 1990.
20. Keary, P., Brooks, M. and Hill, I. An Introduction to Geophysical Exploration, Blackwell Science Ltd. United Kingdom, 2002.
21. Mac Donald, A. M., Davies, J. and Carlow, R. C. African hydrogeology and rural water supply. In: S. M.
A. Adelana & A. M. Mac Donald (Eds.). Applied Groundwater Studies in Africa (pp. 127 – 148), London,
CRC Press, 2008.
22. Olasehinde, P.I. The Groundwaters of Nigeria: A solution to sustainable national water needs. Inaugural
![Figure 1: Generalized Geological Map of Nigeria Showing the Study Area (adopted from [21], [22])](https://thumb-us.123doks.com/thumbv2/123dok_us/8890238.1824782/2.595.74.543.293.671/figure-generalized-geological-nigeria-showing-study-area-adopted.webp)
![Figure 3: The Four Electrode Array for Resistivity Measurements [19]](https://thumb-us.123doks.com/thumbv2/123dok_us/8890238.1824782/4.595.89.513.123.488/figure-electrode-array-resistivity-measurements.webp)