CCET JOURNAL OF SCIENCE AND ENGINEERING EDUCATION
(ISSN 2455-5061)
Vol. - 3, Page-71-78, Year-2018
71
www.ccetbhilai.ac.in
Study of Turbulence Within Constriction in Cohesive Sediment Bed
M K Manik
*, K Debnath
**, A Malviya
***, Ali Hassan Ansari
*****
Professor, Department of Mechanical Engineering, Christian College of Engg & Techn.,Bhilai, India,
[email protected]
**
Professor, Department of Aero Space & Applied Mechanics,IIEST Sibpur,West Bengal, India,
[email protected]
***
Assistant Professor, Department of Mechanical Engineering, Christian College of Engg & Techn., Bhilai,
[email protected]
****
Student, Department of Mechanical Engineering, Christian College of Engg & Techn., Bhilai, India,
[email protected]
Abstract
Experimental flow study within contraction had been conducted at varying velocity. The stream wise, Transverse and vertical mean velocity; Stream wise, Transverse and vertical turbulent intensities and Stream wise and Transverse Reynolds’s stresses was found at various points within the constriction. Though transverse and vertical mean velocities change were not severe through the flow depth but the stream wise mean velocity changes with an increase velocity. Stream wise mean velocity significantly changes up to the depth of flow 5-6.5cm, for all the velocities V=22, 32, 40, 55 and76cm/s. Initially the flow pattern follows the parabolic path and thereafter it remains constant throughout the free stream. For all the velocities, turbulent intensity gradually decreases up to 5cm depth of flow and then increases again but Reynolds stress observed maximum at the bed surface for all the velocities but does not follow any specific trends throughout the flow.
Index Terms: Open channel, Stream wise, Constriction, and Turbulence.
1.
Introduction:
The study in open channel flow has an important engineering role in solving water engineering problems internationally. This topic explores some critical issues and engineering approaches such as flow through constriction and flow around an obstruction that changes flow characteristics. The mean velocity, turbulent intensities and bed stresses has significantly affect the flow parameters and transportation of bed materials in the flow channels. We hope this study would make learning more about hydrologic and hydraulic process designing parameters. Open channel flow has a free water surface; flow is not completely enclosed by boundaries, unlike pipe flow. The flow is subjected to atmospheric pressure and the flow occurs under the action of gravity, while pipe flow may occur under gravity or flow due to some external pressure gradient. Open channel may have any shape (triangular, rectangular, trapezoidal, parabolic and circular etc.).
1.1
Mathematical Model:
The flow model is derived in the basis of Eulerian frame work and class of model based on the equations of continuity and momentum equations. The flow model presented in this experiment is based on the three dimensional continuity equation and momentum equations (energy equations). There are some assumptions such as the flow is unsteady, incompressible, and anisotropic throughout the flow regime[1].
Naiver-Stokes equations are developed by Claude-Louis Navier and George Gabriel Stokes in 1822. These equations are the fundamental partial differential
equations that describe the dynamics of turbulence flow. The set of equations describes fluid motion are collectively known as the Navier Stokes
equations
.
In 3-D they can be written as:The continuity equation in 2D form:
0
U V
t x y
CCET JOURNAL L OF SCIENCE AND ENGINEERING EDUCATION
(ISSN 2455-5061)
Vol. - 3, Page-71-78, Year-2018
72
The U-momentum equation:
The V-momentum equation:
W-momentum equation:
The turbulence intensity is the ratio of the root-mean-square of the velocity fluctuations, to the mean flow velocity, The turbulence intensity of 1% or less is generally considered low and turbulence intensities greater than 10% are considered high. The flow turbulences dominated by the coherent structure activities and associated turbulent events. A turbulent event is a series of turbulent fluctuations that contain more energy than the average flow turbulence. In the course of turbulent motion, the fluctuations influence and the mean motion in such a way that later exhibits an apparent increase in the resistance to deformation, which is called as turbulent stresses or Reynolds stresses. Turbulent shear stresses or Reynolds stress can be expressed as a stress tensor called Reynolds stress tensor, written as .Turbulent shear stresses or Reynolds stress can be expressed as a stress tensor called Reynolds stress tensor, written as
Where and are normal stresses and the other are shearing stresses. The additional stresses are known as apparent or Reynolds stresses.
2.
Experimental setup:
An eighteen meter long, one meter width and one meter high Tilting Flume was taken for the experiment. The flume was position at Hydraulics Laboratory at
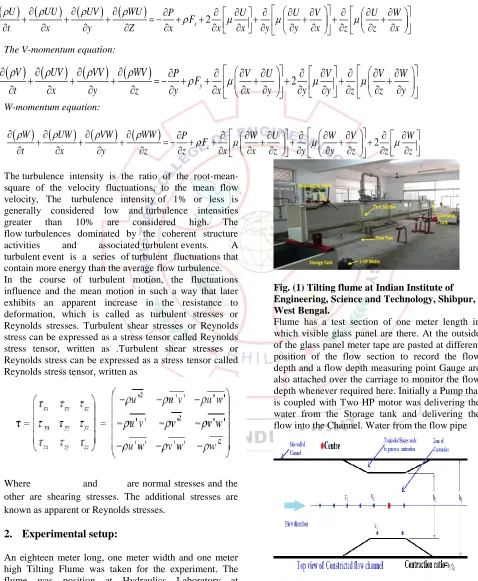
IndianInstitute of Engineering, Science and Technology, Shibpur, West Bengal.
Fig. (1) Tilting flume at Indian Institute of Engineering, Science and Technology, Shibpur, West Bengal.
Flume has a test section of one meter length in which visible glass panel are there. At the outside of the glass panel meter tape are pasted at different position of the flow section to record the flow depth and a flow depth measuring point Gauge are also attached over the carriage to monitor the flow depth whenever required here. Initially a Pump that is coupled with Two HP motor was delivering the water from the Storage tank and delivering the flow into the Channel. Water from the flow pipe
Fig. (2) Different position over which reading has been taken within the contraction
2
xU
UU
UV
WU
P
U
U
V
U
W
F
t
x
y
Z
x
x
x
y
y
x
z
z
x
2
yV
UV
VV
WV
P
V
U
V
V
W
F
t
x
y
z
y
x
x
y
y
y
z
z
y
2
zW
UW
VW
WW
P
W
U
W
V
W
F
t
x
y
z
z
x
x
z
y
y
z
z
z
CCET JOURNAL L OF SCIENCE AND ENGINEERING EDUCATION
(ISSN 2455-5061)
Vol. - 3, Page-71-78, Year-2018
73
3.
Result and Analysis:
The turbulence intensity is the ratio of the root-mean-square of the velocity fluctuations, to the mean flow velocity, A turbulence intensity of 1% or less is generally considered low and turbulence intensities greater than 10% are considered high. The flow turbulences dominated by the coherent structure activities and associated turbulent events. A turbulent event is a series of turbulent fluctuations that contain more energy than the average flow turbulence.
In the velocity plot it is observed that stream wise mean velocity (u), Transverse mean velocity(v) and Vertical mean velocity(w) patterns are similar almost in all cases. The value of u gradually increases from the bed surface to 50 - 60 cm of flow depth thereafter velocity u become constant up to the free stream. It is also observed that at higher velocities, with the increase of velocity curves become steeper. Velocities v and w for all the cases are close to Zero but with increase of flow velocity the vertical mean velocity becomes negative (-) that indicates back flow situation existence which may cause of generation of turbulence.
CCET JOURNAL L OF SCIENCE AND ENGINEERING EDUCATION
(ISSN 2455-5061)
Vol. - 3, Page-71-78, Year-2018
CCET JOURNAL L OF SCIENCE AND ENGINEERING EDUCATION
(ISSN 2455-5061)
Vol. - 3, Page-71-78, Year-2018
75
Fig.3 shows the Stream wise, transverse and vertical mean velocities (v = 60cm/s) at different locations of the test section.
The study also measured the velocity at different location of the Test section considering the centre of the test section at (0,0), Flow direction as well as Left side of the direction of flow is taken as positive (+ ve). With this reference the velocity at three illustrated vertical figure such as V1, V2 and V3 as shown[2]. Stream wise mean velocity for the verticals are almost similar but transverse and Vertical mean velocity shows a distinguishable change in all the cases[3][4]. Transverse and vertical mean velocity at V1 (close to canter of contraction) is
close to zero, At V2 though vertical mean velocity is zero but Transverse mean velocity reaches to a magnitude of Twelve to Thirteen meter per second negative w. r. t Vertical mean velocity. As the location of V2 is at the entrance of the Contracted Zone so the velocity pattern would be changes due to change in area of flow section and revels negative velocity at V3 the transverse velocity deviated from negative (-ve) to zero at the free stream and vertical mean velocity remain same[5], [6].
Fig.4 shows the Stream wise turbulent intensities at (a) velocity v = 22cm/s; (b) velocity v = 32cm/s ; velocity v = 40cm/s ; velocity v = 55cm/s : velocity v = 76cm/s ; velocity v = 22cm/s at a single point of flow section.
The result shows that the stream wise turbulent intensities ú in all flow velocities have the highest value at the bed surface. It is also
CCET JOURNAL L OF SCIENCE AND ENGINEERING EDUCATION
(ISSN 2455-5061)
Vol. - 3, Page-71-78, Year-2018
76
(i.e up to 50 cm) and again increases. At lowestvelocity (v=12cm/s) decrease of ú is 12.5% where as at highest velocity (v=76cm/s) decrease of ú is 24.28% and intermediate (v=32cm/s and
55cm/s) result shows 13.15% , 22.95% of decrement ú.[9] The value of ú at the free stream is lies in between highest and lowest value of ú in all the cases[7], [4]
Fig.5 shows the Reynolds stress at different velocities
Reynolds stress is increases with flow velocity in all the cases. Lowest Reynolds stress observe is 1.6 pa when velocity was recorded as u=22 cm/s . and the highest Reynolds stress
CCET JOURNAL L OF SCIENCE AND ENGINEERING EDUCATION
(ISSN 2455-5061)
Vol. - 3, Page-71-78, Year-2018
CCET JOURNAL L OF SCIENCE AND ENGINEERING EDUCATION
(ISSN 2455-5061)
Vol. - 3, Page-71-78, Year-2018
78
Fig.6 shows the Reynolds stress at different position of flow section.
The magnitude of Reynold stress is found to be maximum at V1 coordinate (-5,0) is 2pa. and minimum magnitude of Reynolds stress is found at V3 coordinate (-5,-5) is -.2 pa that is
may be the reason for back flow, which may be the cause of turbulence, Reynolds stress at all the verticals do not follow any specific trend
Fig.7 Stress contour plot of flow section under test, V1 is the velocity along stream wise flow and V2 Is transverse Velocity
Couture plot of bed stresses as shown in fig7 the maximum stresses at the bed surface is observed 2.4 pa and minimum is -.04 pa.
4.
Conclusion
The present study provides the turbulent characteristic within contracted reach of channel for a wide range of cohesive sediment properties. Stream wise, transverse and vertical mean velocities; Stream wise, transverse and vertical turbulent intensities and Reynolds stresses are found in different points of contracted reach flow. Percentage increase or decreases in velocities, turbulent intensities as well as Reynolds stresses are also measured with the help of Acoustic Doppler Velocimeter (ADV).
References
[1] R. Bur, R. Benay, A. Galli, and P. Berthouze, “Experimental and numerical study of forced shock-wave oscillations in a transonic channel,” Aerosp. Sci. Technol., vol. 10, no. 4, pp. 265–278, 2006.
[2] X. Leng and H. Chanson, “Integral turbulent scales in unsteady rapidly varied open channel flows,” Exp. Therm. Fluid Sci., vol. 81, pp. 382–395, 2017.
[3] D. Pal and K. Ghoshal, “Hydrodynamic interaction in suspended sediment distribution of open channel turbulent flow,” Appl. Math. Model., vol. 49, pp. 630–646, 2017.
[4] S. S. lu and W. W. Willmarth,
“Measurements of the structure of the Reynolds stress in a turbulent boundary layer,” J. Fluid Mech., vol. 60, no. 3, pp. 481–511, 1973.
[5] J. T. Salmon, T. J. Bogar, and M. Sajben, “Laser Doppler velocimeter
measurements in unsteady, separated, transonic diffuser flows,” AIAA J., vol. 21, no. 12, pp. 1690–1697, 1983. [6] R. T. F. Kw An and B. W. Melville,
“Local scour and flow measurements at bridge abutments,” J. Hydraul. Res., vol. 32, no. 5, pp. 661–673, 1994.
[7] B. W. Melville and A. J. Raudkivi, “Flow Characteristics in Local Scour At Bridge Piers,” J. Hydraul. Res., vol. 15, no. 4, pp. 373–380, 1977.
[8] A. J. Manning and K. R. Dyer, “A laboratory examination of floc characteristics with regard to turbulent shearing,” Mar. Geol., vol. 160, no. 1–2, pp. 147–170, 1999.
[9] A. Shariq, A. Hussain, and M. A. Ansari, “Lateral flow through the sharp crested side rectangular weirs in open channels,”