95
_______________________________________________________________
_______________________________________________________________
FORMULATION AND EVALUATION OF SUSTAINED RELEASE
MATRIX TABLETS OF LOSARTAN POTASSIUM USING
MELTGRANULATION TECHNIQUE
A.Bharathi
*, S.Bhagya Lakshmi, K.N.V Deepthi, Ramchandra
KVSR Siddartha College of Pharmaceutical Sciences, Vijayawada, Andhra Pradesh, India.
ABSTRACT
The purpose of the present study was to develop a sustained release matrix tablet of Losartan Potassium, a highly water soluble drug by employing hydrophobic Meltable binders like bees wax, stearic acid and emulsifying wax. HPMCK4M was also added in some formulations to extend the release upto 12 hrs. The effect of wax ratio on release was studied. Tablets were prepared by melt granulation technique by incorporating 25% and 20% of wax, HPMC was added at a concentration of 5%. The granules were subjected to pre compression parameters like angle of repose, Carr’s index, Hausner’s ratio, bulk and tapped densities. Drug: wax interaction was determined by FTIR and DSC studies. Tablets were evaluated for various parameters like hardness, friability, weight variation and drug content. The values are within the acceptable limits for all the formulations. Drug release from the matrix tablet was studied by using paddle type of apparatus. Dissolution was carried out in 0.1N HCl for 2 hrs, and next 10 hrs in pH 6.8 phosphate buffer in order to mimic the in vivo conditions. Among all the formulations, F6 showed maximum release(99%) at end of 12 hrs. The release data was subjected to various kinetic models to know the mechanism of drug release. All the formulations followed zero order kinetics, and from n values obtained from Peppas plot, the release mechanism was anamolous transport.
Key words: Losartan potassium, Melt granulation, Meltable binders, Dissolution, FTIR, DSC.
INTRODUCTION
The oral route is a route most often used for administration of drugs. Tablets are the most popular oral formulations available in the market and are preferred by patients and physicians alike [1].In long term therapy for the treatment of chronic disease conditions, conventional formulations are required to be administered in multiple doses and therefore have several disadvantages [2]. Sustained release formulations are preferred for such therapy because they maintain uniform drug levels, reduce dose and side effects, and show better patient compliance, and increase safety margin for high potency drugs [3]. Controlled release oral products have attracted the attention of formulation scientists over the last three decades due to an array of advantages they offer [4-7]. Melt granulation is one of the most widely applied processing techniques in the array of pharmaceutical manufacturing operations. Now a day by using melt granulation process in the pharmaceutical industry variety of dosage forms and formulations such as immediate release and sustained release pellets, granules,
tablets are formulated. This technique is better than a conventional granulation due to no water or organic solvents are needed. The process is less time consuming and uses less energy than wet granulation. The drug to binder ratio was shown to impact the degradation behavior of the drug product. Recently melt extrusion has found its place in the array of the pharmaceutical manufacturing operations. Extrusion is the process of converting a raw material into a product of uniform shape and density by forcing it through a die under pressure [8-9]. The process of melt granulation involves wetting and nucleation, coalescence step, attrition and breakage. Losartan Potassium is an orally active non-peptide Angiotensin-2 receptor antagonist used in treatment of hypertension. It is white to off- white, crystalline powder freely soluble in water, sparingly soluble in Isopropyl alcohol, slightly soluble in Acetonitrile. Losartan potassium has half life of 1.5 – 2 hrs and generally administered as immediate release tablet at a dose of 25 – 100mg three to four times a day. When *Corresponding Author: A.Bharathi E mail: [email protected]
International Journal
of
Pharmacy Review & Research
www.ijprr.com
96 administered such frequently, dose related side effects like
nausea, dizziness are even more due to fluctuations in drug plasma concentration levels.
Hence present study was aimed towards formulation and invitro evaluation of sustained release matrix tablet of Losartan Potassium using melt granulation technique by employing bees wax, stearic acid and emulsifying wax as meltable binders and to study the effect of wax concentration on the release rate.
MATERIALS & METHODS
Losartan Potassium was produced as a gift sample from Aurobindo Pharma Ltd. HPMC was produced from Yarrow chemicals. Stearic acid was purchased from Sd fine chemicals & Emulsifying wax was purchased from Lobachemi. All other chemicals and reagents used were of analytical grade.
Estimation of Losartan Potassium
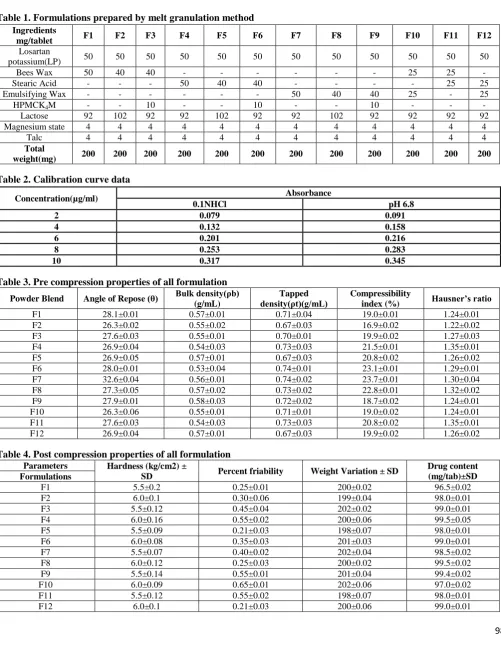
An UV-VIS spectrophotometric method was used for the estimation of Losartan Potassium. A stock solution of Losartan Potassium was prepared in distilled water and the absorbance of Losartan Potassium was measured at 241nm using Elico UV-VIS spectrophotometer SL 150. As the dissolution studies were carried out in 0.1 N HCl and 6.8 pH buffer the calibration curves were constructed in these media. The standard solutions were prepared at a concentration of 2- 10µg/mland absorbance was measured at 241 nm. The data was given in Table:2 and shown in Fig: 1 & 2
Formulation of tablets by melt granulation technique
Sustained release granules were prepared using wax as retarding material. For the preparation of sustained release formulation bees wax, emulsifying wax and stearic acid were used at two different concentrations & in combination of waxes by trial and error basis. Hydrophobic wax granules were prepared by exactly weighing waxes as per formulation design & melting them in a porcelain dish on a water bath at a temperature of its melting point. Drug and diluents were gradually added to the molten mass with continuous stirring .The molten mass was allowed to cool, dried and then sized with a 16 mesh sieve. Prior to compression 2.5 %(w/w) of magnesium stearate & talc were added & the resulting powder blend was compressed on a Elite mini press using 8 mm round punches to the hardness of 6-8 kg/cm2.The formulations are shown in Table-2
Characterization of granules
The granules prepared by melt granulation technique were evaluated for various precompression parameters like bulk & true densities, carr’s index, angle of repose, Hausner’s ratio. Tapping method was used to measure the densities and carr’s index
Compressibility index = [ρt-ρb / ρt] ×100 Hausner ratio= ρt/ ρb
Where ρt = tapped density
ρb = initial bulk density of tablet blend.
Angle of repose θ of the tablet blend measures the resistance to particle flow and was determined by fixed funnel method [10]. The data was given Table-3
COMPATIBILITY TESTING OF DRUG WITH POLYMER
FTIR Studies
FTIR study was carried out to check compatibility of drug with polymers. Infrared spectrum of Losartan potassium was determined on Fourier transform infrared spectrophotometer using KBr dispersion method. Then the spectrum of dried mixture of drug and potassium bromide was run followed by drug with various polymers by using Parkin elmer- Pharmaspec-1 FTIR spectrophotometer. The IR spectra of pure drug and combination were shown in Figures- 3 & 4 respectively.
Characterization by DSC thermo grams
DSC was performed to characterize thermal changes in melting behaviour of Losartan Potassium with other excipients present in different formulations. Thermograms were obtained by using a differential scanning calorimeter at a heating rate 10oC /min over a temperature range of 50-400oC. The sample was hermetically sealed in an aluminium crucible. Nitrogen was purged at the rate of 10 ml/min for maintaining inert atmospheres. The thermograms of pure drug and combination were shown in Figures 5&6 respectively.
Evaluation of tablets
The prepared sustained release tablets were evaluated for Thickness using 6 tablets (Vernier calipers), uniformity of weight using 20 tablets ( analytical balance), hardness using 6 tablets (Monsanto hardness tester) and friability using 20 tablets (Roche type friabilator) [11-12].
Drug Content Estimation
Five tablets were weighed and powdered in a mortar. Accurately weighed tablet powder samples equivalent to 20 mg of Losartan Potassium was transferred to a 100mL volumetric flask, and the Losartan Potassium was extracted into 75mL methanol. This solution was filtered and collected in to a 100mL volumetric flask and made up to the volume with methanol. The solution was suitably diluted with 0.1N HCl and the absorbance was measured at 241nm. Content uniformity was calculated using formula [13],
% Purity = 10 C (Au / As) Where,
C - Concentration,
Au and As - Absorbance’s obtained from standard preparation and assay preparation respectively. The data was given in Table-4.
In-Vitro dissolution studies
The tablet samples were subjected to In-vitro
97 used as dissolution medium for initial 2hr and 6.8pH
buffer for next 10 hr. Aliquot equal to 5 mL was withdrawn at specific time intervals and replaced with fresh buffer. The aliquots were diluted and drug release was determined spectrophotometrically at a wavelength of 241 nm by comparing with the standard calibration curve.
Release Kinetics Zero Order Equation
This equation describes the systems where the release rate is independent of the concentration of the dissolved species. The dissolution data are fitted into the zero order equation [14]:
X = X0 -K0t where,
X = Amount of drug released at time t X0 = Amount of drug released initially K0 = Zero order rate constant
Higuchi Square Root Law
The Higuchi square root equation describes the release from systems where the solid drug is dispersed in an insoluble matrix, and the rate of drug release is related to the rate of drug diffusion. A form of the Higuchi Square Root Law is given by equation [15]:
Q = Ks√t
Where, Q = Amount of drug dissolved at time t Ks = Higuchi rate constant
Korsermeyer Peppas Equation
The Korsemeyer’s equation, which derived from, the linear line of log cumulative percentage vs. log time curve, is Mt/ M∞ = Kt
n
Where Mt and M∞ are the absolute and the cumulative amount of drug released in time t and infinite time; k is a constant incorporating the structural and geometric characteristics of the device and ‘n’ is the release exponent which is indicative of the mechanism of release [16].
RESULTS AND DISCUSSION
The prepared granules were evaluated for various pre compression parameters and data was given in Table-.
The prepared sustained release tablets were evaluated for thickness, weight variation, hardness, friability, drug content. All the values are within the range and data was given in Table.
Fourier transforms infra-red (FTIR) spectroscopy
Major functional groups present in Losartan potassium show characteristic peaks in IR spectrum. Figure 1 shows peaks observed at different wave numbers and the functional group associated with these peaks for drug and drug with different polymer. The major peaks are identical to functional group of Losartan potassium. Hence, it was confirmed that there was no incompatibility between drug and various polymers.
Differential scanning calorimetry
The prominent and sharp endothermic peak at 274 0c in the pure Losartan Potassium (Fig 6.3) represents
the melting point of Losartan Potassium .In all the DSC spectrums the characteristic drug melting point was observed with slight changes in terms of broadening or shifting towards lower temperature. This could be due to mixing of drug and excipient, which lowers the purity of each component in the mixture and may not necessarily indicate potential incompatibility. From these results there was no drug excipients interaction. This indicates the choice of excipients used in the formulation of matrix tablets were suitable which are shown in the figures 5& 6.
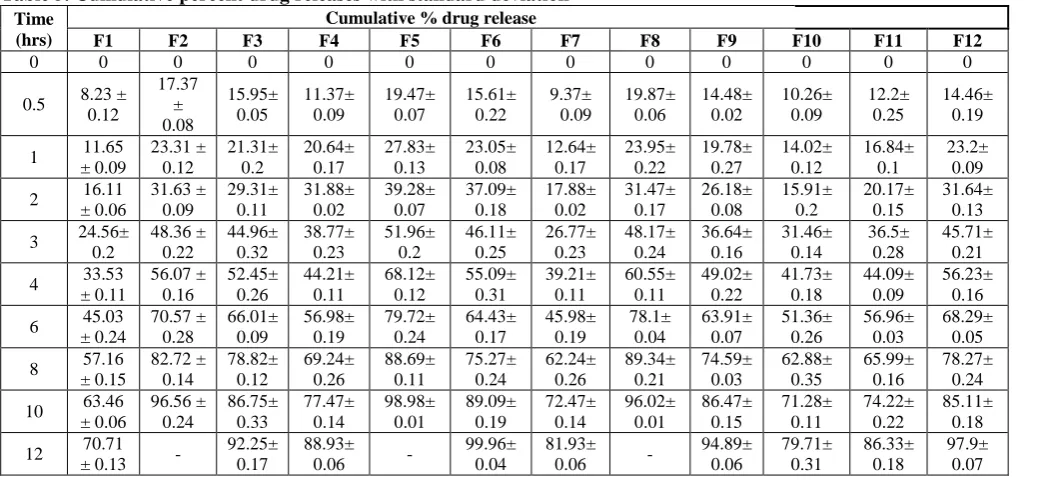
In-Vitro dissolution studies
98 stearic acid; the release was 86.33% at end of 12 hrs. F12
was formulated by using both emulsifying wax & stearic acid at a concentration of 12.5% each. The release was 97% at end of 12 hrs. The comparative dissolution profile was shown in figure-10. Among three waxes employed bees wax showed more retardant effect followed by emulsifying wax and then stearic acid.
Release Kinetics
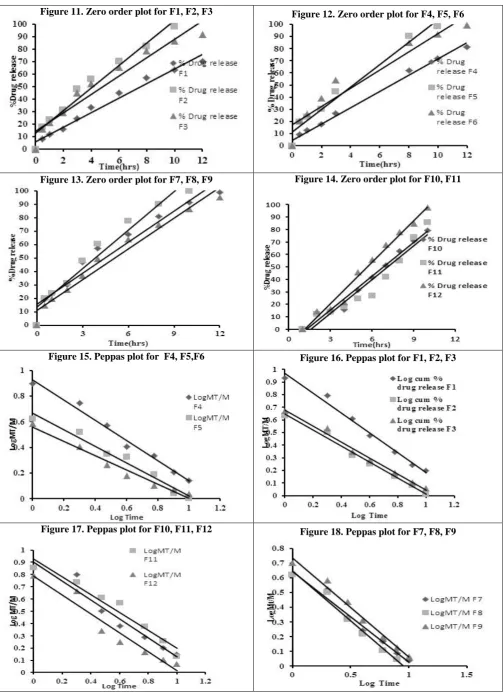
To describe the kinetics of drug release from matrix tablets, release data was analyzed according to different kinetic equations .The data were analyzed by the regression coefficient value (r2) of all batches were shown in Table-6 and zero order plots were shown in figures 11-14, peppas plots were shown in figures 15-18.
Table 1. Formulations prepared by melt granulation method
Table 2. Calibration curve data
Table 3. Pre compression properties of all formulation
Powder Blend Angle of Repose (θ) Bulk density(ρb)
(g/mL)
Tapped density(ρt)(g/mL)
Compressibility
index (%) Hausner’s ratio
F1 28.1±0.01 0.57±0.01 0.71±0.04 19.0±0.01 1.24±0.01
F2 26.3±0.02 0.55±0.02 0.67±0.03 16.9±0.02 1.22±0.02
F3 27.6±0.03 0.55±0.01 0.70±0.01 19.9±0.02 1.27±0.03
F4 26.9±0.04 0.54±0.03 0.73±0.03 21.5±0.01 1.35±0.01
F5 26.9±0.05 0.57±0.01 0.67±0.03 20.8±0.02 1.26±0.02
F6 28.0±0.01 0.53±0.04 0.74±0.01 23.1±0.01 1.29±0.01
F7 32.6±0.04 0.56±0.01 0.74±0.02 23.7±0.01 1.30±0.04
F8 27.3±0.05 0.57±0.02 0.73±0.02 22.8±0.01 1.32±0.02
F9 27.9±0.01 0.58±0.03 0.72±0.02 18.7±0.02 1.24±0.01
F10 26.3±0.06 0.55±0.01 0.71±0.01 19.0±0.02 1.24±0.01
F11 27.6±0.03 0.54±0.03 0.73±0.03 20.8±0.02 1.35±0.01
F12 26.9±0.04 0.57±0.01 0.67±0.03 19.9±0.02 1.26±0.02
Table 4. Post compression properties of all formulation
Parameters Hardness (kg/cm2) ±
SD Percent friability Weight Variation ± SD
Drug content (mg/tab)±SD Formulations
F1 5.5±0.2 0.25±0.01 200±0.02 96.5±0.02
F2 6.0±0.1 0.30±0.06 199±0.04 98.0±0.01
F3 5.5±0.12 0.45±0.04 202±0.02 99.0±0.01
F4 6.0±0.16 0.55±0.02 200±0.06 99.5±0.05
F5 5.5±0.09 0.21±0.03 198±0.07 98.0±0.01
F6 6.0±0.08 0.35±0.03 201±0.03 99.0±0.01
F7 5.5±0.07 0.40±0.02 202±0.04 98.5±0.02
F8 6.0±0.12 0.25±0.03 200±0.02 99.5±0.02
F9 5.5±0.14 0.55±0.01 201±0.04 99.4±0.02
F10 6.0±0.09 0.65±0.01 202±0.06 97.0±0.02
F11 5.5±0.12 0.55±0.02 198±0.07 98.0±0.01
F12 6.0±0.1 0.21±0.03 200±0.06 99.0±0.01
Ingredients
mg/tablet F1 F2 F3 F4 F5 F6 F7 F8 F9 F10 F11 F12
Losartan
potassium(LP) 50 50 50 50 50 50 50 50 50 50 50 50
Bees Wax 50 40 40 - - - 25 25 -
Stearic Acid - - - 50 40 40 - - - - 25 25
Emulsifying Wax - - - 50 40 40 25 - 25
HPMCK4M - - 10 - - 10 - - 10 - - -
Lactose 92 102 92 92 102 92 92 102 92 92 92 92
Magnesium state 4 4 4 4 4 4 4 4 4 4 4 4
Talc 4 4 4 4 4 4 4 4 4 4 4 4
Total
weight(mg) 200 200 200 200 200 200 200 200 200 200 200 200
Concentration(µg/ml) Absorbance
0.1NHCl pH 6.8
2 0.079 0.091
4 0.132 0.158
6 0.201 0.216
8 0.253 0.283
99
Table 5. Cumulative percent drug releases with standard deviation
Time (hrs)
Cumulative % drug release
F1 F2 F3 F4 F5 F6 F7 F8 F9 F10 F11 F12
0 0 0 0 0 0 0 0 0 0 0 0 0
0.5 8.23 ±
0.12 17.37 ± 0.08 15.95± 0.05 11.37± 0.09 19.47± 0.07 15.61± 0.22 9.37± 0.09 19.87± 0.06 14.48± 0.02 10.26± 0.09 12.2± 0.25 14.46± 0.19
1 11.65
± 0.09 23.31 ± 0.12 21.31± 0.2 20.64± 0.17 27.83± 0.13 23.05± 0.08 12.64± 0.17 23.95± 0.22 19.78± 0.27 14.02± 0.12 16.84± 0.1 23.2± 0.09
2 16.11
± 0.06 31.63 ± 0.09 29.31± 0.11 31.88± 0.02 39.28± 0.07 37.09± 0.18 17.88± 0.02 31.47± 0.17 26.18± 0.08 15.91± 0.2 20.17± 0.15 31.64± 0.13
3 24.56±
0.2 48.36 ± 0.22 44.96± 0.32 38.77± 0.23 51.96± 0.2 46.11± 0.25 26.77± 0.23 48.17± 0.24 36.64± 0.16 31.46± 0.14 36.5± 0.28 45.71± 0.21
4 33.53
± 0.11 56.07 ± 0.16 52.45± 0.26 44.21± 0.11 68.12± 0.12 55.09± 0.31 39.21± 0.11 60.55± 0.11 49.02± 0.22 41.73± 0.18 44.09± 0.09 56.23± 0.16
6 45.03
± 0.24 70.57 ± 0.28 66.01± 0.09 56.98± 0.19 79.72± 0.24 64.43± 0.17 45.98± 0.19 78.1± 0.04 63.91± 0.07 51.36± 0.26 56.96± 0.03 68.29± 0.05
8 57.16
± 0.15 82.72 ± 0.14 78.82± 0.12 69.24± 0.26 88.69± 0.11 75.27± 0.24 62.24± 0.26 89.34± 0.21 74.59± 0.03 62.88± 0.35 65.99± 0.16 78.27± 0.24
10 63.46
± 0.06 96.56 ± 0.24 86.75± 0.33 77.47± 0.14 98.98± 0.01 89.09± 0.19 72.47± 0.14 96.02± 0.01 86.47± 0.15 71.28± 0.11 74.22± 0.22 85.11± 0.18
12 70.71
± 0.13 -
92.25± 0.17
88.93±
0.06 -
99.96± 0.04
81.93±
0.06 -
94.89± 0.06 79.71± 0.31 86.33± 0.18 97.9± 0.07
Table 6. The Rate Constant and Regression values for all the formulations
Formulations Zero order Higuchi Peppas
K0(mg/hr) R2 R2 N R2
F1 5.85 0.977 0.968 0.785 0.986
F2 9.06 0.961 0.986 0.636 0.989
F3 7.33 0.939 0.990 0.634 0.988
F5 6.6 0.985 0.962 0.789 0.984
F6 9.30 0.972 0.960 0.645 0.971
F7 7.52 0.890 0.987 0.561 0.978
F8 7.74 0.944 0.990 0.616 0.979
F9 9.57 0.954 0.981 0.719 0.978
F10 7.60 0.967 0.982 0.674 0.986
F11 8.99 0.965 0.968 0.727 0.956
F12 11.08 0.987 0.970 0.774 0.949
Figure 1. Calibration curve in 0.1NHC Figure 2. Calibration curve in 6.8pH
100
Figure 4. FTIR spectra of Drug and Stearic acid
Figure 6. DSC thermogram of drug and stearic acid
Figure 7. Comparitive dissolution profiles of formulations with Bees wax
Figure 8. Comparitive dissolution profiles of formulations
Figure 9. Comparitive dissolution profiles of
101
Figure 11. Zero order plot for F1, F2, F3 Figure 12. Zero order plot for F4, F5, F6
Figure 13. Zero order plot for F7, F8, F9 Figure 14. Zero order plot for F10, F11
Figure 15. Peppas plot for F4, F5,F6 Figure 16. Peppas plot for F1, F2, F3
102
CONCLUSION
All the formulations followed zero order kinetics with high regression values. From the Higuchi plots, the release mechanism was found to be diffusion initially. On
extending 60% of dissolution data to Peppas equation, the release mechanism was diffusion followed by erosion as then values obtained are in the range of 0.5 to 0.9.
REFERENCES
1. Punna Rao R, Sindhura G, Ranendra NS. Design and study of lamivudine oral controlled release tablets. AAPS Pharm Sci Tech, 8(4), 2007, 1-9.
2. Chein YW. Novel drug delivery systems. In: Chein Oral Drug Delivery Systems.2nd ed, New York, NY, Marcel Dekker, 1992, 139-146.
3. Vyas SP, Khar RK. Controlled drug delivery: concepts and advances. In: Vyas and Khar RK 1st ed., Controlled Oral Administration. Vallabh Prakashan, Delhi, India, 2002, 155-195.
4. Abdelkader H, Abdalla OY, Salem H. Formulation of controlled-release baclofen matrix tablets: Influence of some hydrophilic polymers on the release rate and in vitro evaluation. AAPS Pharm Sci Tech, 8(4), 2007, 156-166.
5. Abdul S, Poddar S. A flexible technology for modified release of drugs: multi layered tablets. Journal of controlled release, 97(3), 2004, 393-405
6. Al-Saidan SM, Krishnaiah YSR, Patro S, Satyanaryana V. In vitro and in vivo evaluation of guar gum matrix tablets for oral controlled release of water-soluble Diltiazem hydrochloride. AAPS Pharm Sci Tech, 6(1), 2005, 14-21
7. Aulton ME. Pharmaceutics: the science of dosage form design, Churchill Livingstone, 2002. 8. Chokshi R, Zia H. Hot melt extrusion technique: a review. Iranian J Pharm Res., 3, 2004, 3-16.
9. Eliasen H, Schafer T, Kristensen HG. Effects of binder rheology on melt agglomeration in a high shear mixer. Int J Pharm, 176, 1998, 73–83.
10. Lachman L, Lieberman HA and Kanig JL. The theory and practice of industrial pharmacy. 3rd ed., Varghese Publishing House, Mumbai, 1991, 67-71, 183-184, 320.
11. Anonymous 1. The Indian Pharmacopoeia. The Controller of publication, New Delhi, Volume- I, II, III, 2007, 1319-1320. 12. Bankar GS and Rhodes CT. Eds. Modern Pharmaceutics. 3rd ed., Marcel Dekker, Inc. New York, 1996, 668-669.
13. Agarwal RK, Jain, Hemant K and Singhai AK. Estimation of Losartan potassium from tablets. Indian Drugs, 37(5), 2000, 26-30.
14. Brazel CS, Peppas NA. Modelling of Drug Release from Swellable Polymers, European J.Pharm. Biopharm, 49, 2000, 47-58.
15. Lapidus H, Lordi NG. Some factors affecting the release of a water soluble drug from a compressed hydrophilic matrix.
J Pharm Sci. 55,1966, 840–843.