VOLUME 39, ARTICLE 18, PAGES 525
,
560
PUBLISHED 19 SEPTEMBER 2018
https://www.demographic-research.org/Volumes/Vol39/18/ DOI: 10.4054/DemRes.2018.39.18
Research Article
Neonatal mortality, cold weather, and
socioeconomic status in two northern Italian
rural parishes, 1820–1900
Francesco Scalone
Alessandra Samoggia
© 2018 Francesco Scalone & Alessandra Samoggia.
This open-access work is published under the terms of the Creative Commons Attribution 3.0 Germany (CC BY 3.0 DE), which permits use, reproduction, and distribution in any medium, provided the original author(s) and source are given credit.
1 Introduction 526
2 Background 527
2.1 Effects of cold weather on neonatal mortality 527
2.2 Theoretical framework 528
2.3 Differential effects of cold climate on neonatal mortality by
socioeconomic status 530
3 Study area 531
3.1 Geography, climate, and population 531
3.2 Socioeconomic characteristics 532
3.3 Labourers’ living conditions in the second half of the 19th century 533
3.4 Neonatal mortality in the Bologna area 533
4 Sources and data 535
4.1 Demographic sources 535
4.2 Temperature registers 536
4.3 Price series 538
4.4 The person-day dataset 539
5 Methods 539
5.1 Logistic regression analysis 540
5.2 Discrete-time event history analysis 541
5.3 Expected outcomes 542
6 Results 542
7 Conclusion and discussion 548
Neonatal mortality, cold weather, and socioeconomic status in two
northern Italian rural parishes, 1820–1900
Francesco Scalone1
Alessandra Samoggia2
Abstract
BACKGROUND
Cold-related conditions represent one of the most common causes of neonatal death in many developing countries. The effects of cold external temperatures on neonatal mortality at the onset of demographic transition recently have attracted scholarly interest.
OBJECTIVE
First, we aim to study the effects of cold temperatures on neonatal mortality at the onset of demographic transition, focusing on two Italian rural parishes between 1820 and 1900. Second, we aim to assess whether the effects vary according to socioeconomic status (SES), especially among the most vulnerable social groups.
METHODS
We apply logistic regression and discrete-time event history analysis using micro-data from parish registers and daily records of external temperature.
RESULTS
The risk of death during the first month of life varied according to external temperature’s variation and to socioeconomic status, demonstrating that neonates born to landless rural labourers generally suffered a higher neonatal mortality risk during winter and, more specifically; in case of low temperature at the childbirth during coldest months.
CONCLUSIONS
The risk of neonatal death increased as external temperatures decreased. The clear influence of temperature on the day of birth suggests that low temperatures on the day of birth exerted a fundamental scarring effect on children’s survival. We also find significant differences in neonatal mortality by SES, resulting in more pronounced effects from season and temperature in rural proletarian families. The results show that
during the second half of the 19th century characterised by intense socioeconomic transformations, rural proletarians experienced a clear worsening of living conditions.
1. Introduction
Cold-related conditions, such as hypothermia (Lunze et al. 2013), and severe infectious diseases, such as neonatal sepsis or neonatal infection (Oza et al. 2015), are a common cause of neonatal death in many developing countries (Lawn, Cousens, and Zupan 2005). Focusing on a historical population, we investigate the role of local climatic conditions on neonatal mortality, usually measured by air temperature. Some recent studies have linked temperature and neonatal mortality in the northern Italian region of Veneto during the final centuries of the demographic ancien régime. The effect of cold weather on neonatal mortality has been demonstrated in Casalserugo for the period 1700–1830 (Dalla Zuanna and Rosina 2011) and in Venice for 1816–1868 (Derosas 2009). Both studies also show the importance of living standards and nutritional trends.
Following this new scholarly interest, we first propose to assess the effects of cold external temperatures on neonatal mortality during a later period, at the onset of a demographic transition and amid intense socioeconomic transformations. Even though Italy is in the temperate area, winters of extreme cold are relatively frequent in the northern area of the peninsula. Accordingly, we focus on two rural parishes bordering Bologna, a town located in Emilia-Romagna, a northern Italian region, from 1820 to 1900, which includes the critical period after national unification (1861) when a severe economic crisis hit the rural population. Second, we assess whether the effect of cold weather on neonatal mortality in these parishes varied by socioeconomic status (SES), in order to shed light on the most vulnerable social group during this critical period of socioeconomic transformation. Clear individual socioeconomic disparities and high neonatal mortality and illiteracy rates make these two parishes similar to some contemporary communities in developing countries. By demonstrating that even in a pre-industrial society some socioeconomic groups were more capable of protecting their own newborns than others, we can provide useful suggestions for policy interventions in contemporary resource-limited environments.
(1885), which was commissioned by the Italian government in 1877, is the most complete and detailed study of Italian agriculture during the 1870s.3 We consider interactions between cold climatic conditions (low temperature and winter season) and SES in order to assess neonatal mortality risk in the poorest families during colder winters.
In the following section we briefly introduce the background to neonatal mortality analysis. The next two sections describe the socioeconomic, climatic, and demographic characteristics of the study area and present the data sources. The fifth section covers the methods, while in the last two sections the results of the aggregate and micro-level analyses are discussed.
2. Background
In this section we introduce the theoretical framework underlying the construction of our empirical model. First, we present evidence for the effect of cold weather on neonatal death from a preliminary review of previous studies on the association between climate and mortality in historical European populations. Second, we theoretically identify the possible mechanisms that relate cold weather conditions and low temperatures to neonatal mortality, underlining the role of hypothermia and cold-related infectious diseases and indicating a possible causal chain that starts with maternal health conditions and leads to neonatal frailty and the actions of infectious diseases. We then formulate the rationale for hypothesising the differential effects of cold weather by SES.
2.1 Effects of cold weather on neonatal mortality
Studies exploring the effects of cold temperature on all-age mortality rates in temperate zones from the 20th century to the first decades of the 21st century are relatively frequent. Some are comparative studies (Healy 2003; Analitis et al. 2008; Keatinge et al. 1997), while others analyse the situation in specific countries or towns, such as England and Wales (Keatinge, Coleshaw, and Holmes 1989), the Netherlands (Kunst, Looman, and Mackenbach 1991; Huynen et al. 2001), London (Carson et al. 2006), and Madrid (Diaz et al. 2005). However, historical studies of the relationship between cold temperature and death rate are limited and are mainly based on month or season of
3 The report is based on a survey of agrarian property, cultivation methods, and living conditions in rural
birth, monthly temperature averages, and/or crude mortality indicators, as in the case of studies on England and Wales (McDowall 1981), Italy (Ferrari and Livi Bacci 1985), London (Galloway 1985; Landers 1986), and German villages (Knodel 1984), and are rarely based on individual death records, as in the case of Sweden (Bengtsson 1993) and the Netherlands (Ekamper et al. 2009).
Most of these studies of populations living in quite different climatic areas show that people adopt specific strategies to face extreme climates. As Healy (2003) observes, the countries that suffer from the highest winter mortality excess are in the temperate zone. People in cold regions keep their houses warm and dress in warm clothes, while “people in mild winter regions become careless about cold stress, and protect themselves less effectively against cold” (Ekamper et al. 2009: 391).
Historical studies on infant and neonatal mortality have shown similar trends. In Italy, at least until the early 19th century, infant survival was strongly affected by climatic conditions (Breschi and Livi Bacci 1986, 1994; Breschi, Derosas, and Manfredini 2000; Bellettini and Samoggia 1984; Rossi and Tesolat 2006). Studies on infant mortality in northern and central Italy show a U-profile of neonatal mortality by birth month (Breschi, Derosas, and Manfredini 2000; Breschi and Livi Bacci 1994) and an evident relationship with the lowest winter temperatures (Derosas 2009; Dalla Zuanna and Rosina 2011; Ferrari and Livi Bacci 1985). Focusing on Casalserugo over the period 1700–1830 and Venice from 1816 to 1868, Dalla Zuanna and Rosina (2011) and Derosas (2009), respectively, show that higher winter neonatal mortality was primarily due to lower outdoor temperatures. These seminal studies both conclude that hypothermia likely played the main role in the higher neonatal mortality in winter and that colder weather conditions had a direct effect on neonatal deaths. Therefore, we expect that during the study period winter-born children had the greatest risk of neonatal mortality, while those born in summer had the lowest levels.
2.2 Theoretical framework
neonatal mortality (e.g., Reid 2001; Wrigley et al. 1997), as they are more likely to have low birth weight and be premature (Ward 1993).
Short-term economic crises could also affect neonatal and infant survival, as previous studies assessing the effect of grain price increases on infant and child mortality have found a negative effect on survival between ages 2 and 12 years. An earlier study takes grain prices as a proxy for living standards and nutritional levels and finds them to have no immediate effect on neonatal mortality but to have an effect one year after childbirth (Breschi, Derosas, and Manfredini 2004).
However, in our theoretical framework, specific endogenous factors represent the preconditions that make cold weather conditions more pernicious. Since it is known that low birth weight (Lawn et al. 2005), prematurity, and intrapartum complications represent the most frequent causes of early neonatal deaths (0–6 days of age) (Oza et al. 2015), adverse cold weather could play a role, further weakening the already fragile neonates’ bodies and leaving them more exposed to and less defended against infectious diseases. In the medical literature, hypothermia is defined as a newborn body temperature of 35.5–36.5°C. Neonatal hypothermia is still frequent in neonates born in tropical environments and is generally considered to be a direct cause of death in only a small proportion of newborn deaths, as it is primarily associated with common causes of neonatal deaths, such as severe infections, prematurity, and asphyxia (Miller, Lee, and Gould 2011; Lunze et al. 2013). Especially in premature newborns and those with a low birth weight of less than 2,500 grams (WHO 2006), thermoregulatory mechanisms are easily overwhelmed, leading to metabolic deterioration and direct death from hypothermia or indirect mortality from associated causes, such as severe infections (Lunze and Hamer 2012; Oza et al. 2015). Given that infections such as sepsis and pneumonia prevail among late neonatal deaths (7–27 days of age) (Oza et al. 2015), severe cold conditions could also have a detrimental effect throughout the neonatal period after the first days or week of life.
impoverish the mother’s physiological state, increasing neonatal mortality risks (DaVanzo et al. 2008), as the mothers are not able to recover from the pregnancy– breastfeeding cycle (DaVanzo et al. 2008; Scalone 2014). Previous studies have suggested that the higher risks for very young mothers could be due to mother–fetus competition for nutrients or difficulties in maternal physical growth (Kramer and Lancaster 2010), whereas infants born to older mothers could be affected by a higher likelihood of maternal morbidity and congenital abnormality (Pozzi 2002; Carolan and Frankowska 2011).
2.3 Differential effects of cold climate on neonatal mortality by socioeconomic status
The effects of socioeconomic status on infant mortality have been explored in several studies on historical European and Asian populations (Bengtsson, Campbell, and Lee 2004). In addition, socioeconomic differentials in infant mortality still exist in developing countries in the 21st century, mainly linked to household wealth, size of the child at birth, birth interval (Khadka et al. 2015), and sociomaterial and housing deprivation (Almendra, Santana, and Vasconcelos 2017). Moving on from this assumption, we further hypothesise that socioeconomic differences could mediate and alter the effects of cold climate conditions among the different socioeconomic groups.
To argue that cold weather can have a differential effect on neonatal mortality by SES, nutritional disparities between social groups must be taken into account. Impoverished mothers can suffer chronic malnutrition and insufficient vitamin intake during pregnancy, leading to immature foetal development (Pozzi 2000). Consequently, low SES neonates have a low birth weight more often than neonates of other socioeconomic groups (e.g., Ward 1993) and can have greater exposure to the detrimental effects of cold weather and low temperatures (Derosas 2009). We therefore can assume that due to chronic malnutrition the neonates of poorer families more frequently had low birth weights, and thus were more exposed to the effects of severe cold temperature than wealthier families’ neonates.
fireplace, a proper chimney, or window frames in their homes (Jacini 1885). Dwelling standards, were thus related to SES, as the poorest groups likely lived in more precarious housing conditions.
More substantial family resources and better infant care have been observed when other women are coresident. The relatives who lived together in large and multiple households could support young mothers in caring for neonates (Breschi, Derosas, and Manfredini 2004; Breschi, Manfredini, and Pozzi 2004), preventing harmful childrearing practices such as premature exposure to cold weather conditions. By contrast, in simpler and nuclear households, mothers were the only persons involved and could not rely on help to protect their children from adverse climatic and environmental conditions. This is also true for the contemporary population in developing countries, as previous studies have shown that low body temperature in infants is also associated with young, inexperienced mothers without necessary family support (e.g., Zabelle et al. 1990).
To sum up, on the one hand, in the most disadvantaged social classes, neonates could suffer from a lack of material resources (e.g., housing inadequacy) and family protection (e.g., scarce childcare knowledge), reducing their defenses against the asperities of cold weather. On the other hand, the poorest, less nourished, most depleted and work-overloaded mothers could give birth more frequently to fragile preterm and/or underweight neonates, who are more exposed to the direct effects of hypothermia and its related diseases.
3. Study area
3.1 Geography, climate, and population
Our study focuses on San Donnino and San Nicolò di Villola, two parishes in the flat, rural area of the Po valley, which lies northeast of the city of Bologna. Bologna is located in Emilia-Romagna, a northern Italian region. The two parishes are outside the ancient walls of Bologna in the rural belt surrounding the town. During the study period the separation of the rural hinterland was not only symbolic but also administrative and material. For centuries, the doors of the town were locked during the night, and custom officers strictly controlled the people and goods travelling from the countryside to the town. Nevertheless, important, strong economic relationships existed between the town and its bordering rural zone.
insects and mould, which sometimes spoiled crops. Furthermore, the seasons rarely changed gradually, so agricultural work was always uncertain (Tanari 1881).4
The two parishes had a combined population of 881 inhabitants in 1820, more than 1,000 in 1840, and 1,158 in 1900. During that time the number of families increased from 134 to 182. San Donnino always had a larger population than San Nicolò, and the difference grew from 93 inhabitants in 1820 to 250 in 1900. The population and number of families in San Nicolò remained constant during the study period, while the population of San Donnino increased by 44.6%, from 487 to 704. In both parishes the average household size remained stable, at 6.6 in 1820 and 6.4 in 1900 (Rettaroli and Scalone 2012).
3.2 Socioeconomic characteristics
Until the last decade of the 19th century, before industrialisation, the plains around Bologna were mostly populated by two social groups tied to the agricultural sector – those bound by sharecropping contracts and those engaged in wage labour (Bellettini 1971; Kertzer and Hogan 1989). Sharecropping contracts were usually merely oral agreements splitting the harvest between the owner and the sharecropper (Breschi et al. 2014; Rettaroli, Samoggia, and Scalone 2017; Scalone et al. 2017). In 1860, of the 158 households in the two parishes, sharecroppers and rural landless workers headed 71 and 47 respectively. The latter mostly lived in nuclear families with an average of 4.3 members, while sharecroppers lived in larger multiple households with an average of 8.8 members (Rettaroli and Scalone 2012). Sharecroppers’ contracts allowed them to enjoy relatively stable economic conditions (Bellettini 1971), while landless rural labourers could only count on seasonal and often temporary incomes, with no contractual protection (Tanari 1881).
Although education was compulsory and the parishes had enough schools, attendance was low because teachers were unable to understand the effective needs of the rural population and parents needed children to help in agricultural work. Schools were often far from children’s homes and during winter they often could not attend due to snow, rain, and, frequently, a lack of decent clothing or shoes. In Bologna’s rural areas the population still had a high illiteracy rate, at 63.3% in the 1870s (Tanari 1881).
4 The Jacini report collected survey results for twelve subdivisions of the country. Information on the study
3.3 Labourers’ living conditions in the second half of the 19th century
As our demographic and climate series extend into the early 20th century, it is necessary to consider the socioeconomic and demographic transformations of that period. It can be assumed that improvement in housing and progress in obstetrical techniques and childrearing knowledge during the 19th century contributed to reducing infant mortality in this rural area (Scalone et al. 2013). However, improved living conditions did not reach the whole population. During this period the poorest strata of the rural population and landless labourers experienced progressive worsening of their living standards due to economic and political transformations.
After national unification in 1861, cereals imported from the United States and France caused a market crisis in the agricultural sector. From 1869 a new tax on grinding wheat and cereals (tassa sul macinato) impoverished rural populations, especially landless rural labourers. The situation worsened further when the Italian government increased duties (1887–1888) on imported goods and the French authorities raised custom duties on Italian agricultural products, hurting the agricultural sector and lowering the living standards of the rural population (Cazzola 1996). During the same period the traditional sharecropping economy steadily declined, as large-scale, capitalist agriculture emerged in the Bologna area. The introduction of new, modern agricultural machines cut the number of working days for landless labourers and increased temporary and permanent unemployment (Cazzola 1996; Kertzer and Hogan 1989). Given the deteriorating living conditions of rural landless labourers in the second half of the 19th century, we expect that low temperatures could have severely affected this group of labourers.
In the studied area, sharecroppers usually could ensure adequate caloric intake throughout the year as they could rely on their own food supplies, preserved by drying and salting (Comizio Agrario di Bologna 1881; Tanari 1881). By contrast, the nutrition of landless rural labourers was generally only adequate during the work season and became insufficient in amount and variety during periods of unemployment. Other evident differences were related to clothing, as rural labourers and their children were more poorly dressed than sharecroppers and so more exposed to the winter cold. In 1881 Tanari wrote: “For neonates, the lack of good and delicate clothes can cause unhappy development, wounds and imperfections for the rest of their lives.”
3.4 Neonatal mortality in the Bologna area
differences to better geographic and environmental conditions (Angeli, Del Panta, and Samoggia 1995). Improvements in obstetrical assistance and infant care, which were already advanced in the 19th century,5 probably also contributed to reducing perinatal risk. These advances might have also extended to rural families (Ward 2004).
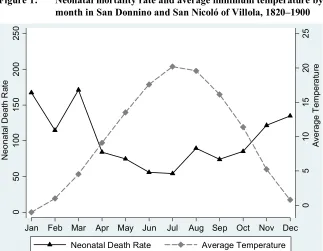
From 1820 to 1900 the average neonatal mortality rate (deaths in the first month of life per 1,000 births) in San Donnino and San Nicoló was 105‰. In preliminary estimates based on this data, neonatal mortality rates were highest in winter and lowest in summer. As shown in Figure 1, neonatal mortality had a reverse relation with temperatures from 1820 to 1900.
Figure 1: Neonatal mortality rate and average minimum temperature by month in San Donnino and San Nicoló of Villola, 1820–1900
Statistics by cause of death are available for all of Italy from 1887. Nevertheless, it must be underlined that for a long time the classification of cause of death was poor in the first year of life – and especially in the first month of life, practitioners and doctors
5 The first Italian chair in obstetrics was established at the University of Bologna in 1804, and obstetric and
gynaecological clinics were established in 1860 in two hospitals, Ospedale Sant’Orsola and Ospizio degli Esposti (Scalone et al. 2017).
0 5 1 0 15 20 2 5 A ve ra g e T e m p e ra tu re 0 5 0 1 0 0 15 0 2 0 0 25 0 N e o n a ta lD e a th R at e
Jan Feb Mar Apr May Jun Jul Aug Sep Oct Nov Dec
rarely attended childbirths in rural areas and so midwives were generally responsible for the cause of death declaration. Approximation and incorrect reporting of the diagnosis of cause of death greatly affected the quality of the statistics (Pozzi 2000). Although there is no precise information regarding the study area, statistics on perinatal causes of death in Emilia are available from 1888 (Table 1). More than half of deaths were due to infantile atrophy, approximately 9% to intestinal diseases, 8.5% to respiratory diseases, and 6% to sclerema6 (skin lesions and inflammations).
Table 1: Percentage distribution of neonatal deaths by cause in Emilia, 1888
Causes %
Birth asphyxia and apoplexy 2.5
Infantile atrophy 58.6
Convulsions 2.8
Respiratory diseases 7.7
Acute pneumonitis 1.5
Mouth diseases (excluding malignancy) 2.9 Diseases of the intestines: enteritis and diarrhoea 8.5 Sclerema (skin inflammations and lesions) 5.7
Other causes 9.8
Total 100.0
Number of deaths 10,511
Source: Direzione Generale della Statistica 1890.
Note: Other causes include all other causes accounting for less than 1% of deaths.
According to the definition of that time, atrophy (which literally means ‘lack of nourishment’) referred to underweight or immature body development due to congenital causes or poor maternal nourishment (Manfredini and Pozzi 2004). Both infantile atrophy and sclerema seem to be connected to weak, underweight, or premature neonates. Although we must be careful with low-quality death classifications, we can observe that a significant proportion of the neonatal deaths seem to be related to low weight or weakness in neonates.
4. Sources and data
4.1 Demographic sources
To investigate the relationship between temperature and the risk of death during the first month of life, we analyse the available demographic data and climate sources. We
6 The exact cause of sclerema neonatorum is not known. It primarily affects very sick premature infants
use parish registers and the Status Animarum of San Donnino and San Nicolò, covering approximately 11,000 individuals and showing 2,786 births and 292 deaths in the first month of life between 1820 and 1900 (Rettaroli and Scalone 2012). Together, these two sources provide complete information on the stock and flow of the populations of San Nicolò and San Donnino during the 19th century. The parish registers offer complete nominative information about the births, deaths, and marriages in their territories. The Status Animarum was a type of census drawn up by the parish priest each year during the Easter period, which included the name, sex, age, marital status, paternity, and maternity of each household member (Rettaroli and Scalone 2012). There may be a concern related to stillbirth registrations: The Catholic Church was concerned with saving neonates’ souls, so priests tended to properly register early deaths, in some cases also including babies who died during childbirth. Consequently, the sources used could also include late foetal losses among early neonatal deaths.
The Status Animarum provides information on the occupations of heads of households (Rettaroli and Scalone 2012). The occupational classification scheme in that area distinguished three main socioeconomic groups based on paternal occupation at birth. The rural group included landless rural labourers, farmers, and sharecroppers. There was a nonrural group of artisans, petite bourgeoisie, and non-farm workers. The few individuals with unknown SES were classified in this nonrural third group. The Status Animarum lists individuals by family group, so it is also possible to consider specific household structures. Mortality estimates based on such family reconstitution could be biased due to unobserved migration, as death dates tend to be missing for individuals who moved and died in other places. We have considered 2,786 births in the baptism registers of San Donnino and San Nicolò whose mothers were registered in the parish Status Animarum. Therefore, we took into account the births from resident population mothers, who were less likely to migrate soon after childbirth. These births were then linked to 1,141 deaths at any age (not only infant) from burial registers. The linkage rate is relatively low since some of the 2,786 born died after 1900 (the end of the observed period) or moved and died in other parishes at older ages. However, the bias due to unobserved migrations generally has a limited impact on neonatal mortality measures, as new mothers and neonates rarely migrated within a month of delivery.
4.2 Temperature registers
and San Nicolò, so it provides the ideal climate source for the demographic data used. These daily temperatures are available in the dataset of the Global Historical Climatology Network (Menne et al. 2012a; Menne et al. 2012b).
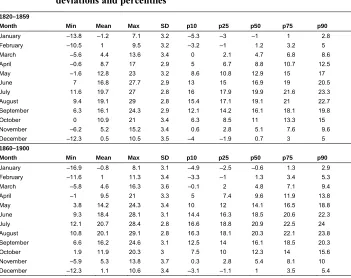
As in many temperate regions, the temperature range is wide. During the studied period Bologna’s temperatures vary between the lowest value of –13.1°C during winter months and the highest value of 39.5°C in summer months. Since our analysis refers to the effect of cold weather conditions we only took into account the series of minimum temperatures. Therefore, Table 2 refers to summary statistics of minimum temperatures calculated using individual days. It shows the minimum, maximum, and mean values; standard deviations; and some selected percentiles of the minimum temperatures, by month, over the two subperiods of 1820–1859 and 1860–1900.
Table 2: Summary statistics of minimum daily temperature by month (degrees Celsius): Minimum, mean, and maximum values, standard deviations and percentiles
1820–1859
Month Min Mean Max SD p10 p25 p50 p75 p90
January –13.8 –1.2 7.1 3.2 –5.3 –3 –1 1 2.8
February –10.5 1 9.5 3.2 –3.2 –1 1.2 3.2 5
March –5.6 4.4 13.6 3.4 0 2.1 4.7 6.8 8.6
April –0.6 8.7 17 2.9 5 6.7 8.8 10.7 12.5
May –1.6 12.8 23 3.2 8.6 10.8 12.9 15 17
June 7 16.8 27.7 2.9 13 15 16.9 19 20.5
July 11.6 19.7 27 2.8 16 17.9 19.9 21.6 23.3 August 9.4 19.1 29 2.8 15.4 17.1 19.1 21 22.7 September 6.3 16.1 24.3 2.9 12.1 14.2 16.1 18.1 19.8
October 0 10.9 21 3.4 6.3 8.5 11 13.3 15
November –6.2 5.2 15.2 3.4 0.6 2.8 5.1 7.6 9.6 December –12.3 0.5 10.5 3.5 –4 –1.9 0.7 3 5
1860–1900
Month Min Mean Max SD p10 p25 p50 p75 p90
January –16.9 –0.8 8.1 3.1 –4.9 –2.5 –0.6 1.3 2.9 February –11.6 1 11.3 3.4 –3.3 –1 1.3 3.4 5.3
March –5.8 4.6 16.3 3.6 –0.1 2 4.8 7.1 9.4
April –1 9.5 21 3.3 5 7.4 9.6 11.9 13.8
May 3.8 14.2 24.3 3.4 10 12 14.1 16.5 18.8
June 9.3 18.4 28.1 3.1 14.4 16.3 18.5 20.6 22.3 July 12.1 20.7 28.4 2.8 16.6 18.8 20.9 22.5 24 August 10.8 20.1 29.1 2.8 16.3 18.1 20.3 22.1 23.8 September 6.6 16.2 24.6 3.1 12.5 14 16.1 18.5 20.3 October 1.9 11.9 20.3 3 7.5 10 12.3 14 15.6 November –5.9 5.3 13.8 3.7 0.3 2.8 5.4 8.1 10 December –12.3 1.1 10.6 3.4 –3.1 –1.1 1 3.5 5.4
The data confirms that the winter months were the coldest, as December, January, and February had minimum values of less than 0 degrees Celsius in both subperiods. In these coldest months even the average values were frequently less than 0. It is worth noting that negative minimum values were also registered in March and November. Even if the averages for 1820–1859 are slightly less than those in the second subperiod, the lowest values are reached in the second subperiod. These monthly series appear to be stable, as the first and the second subperiods have nearly the same standard deviations.
4.3 Price series
4.4 The person-day dataset
The information in the various sources is linked on a nominative basis to reconstitute individual neonatal biographies in the first month of life. Nominative reconstitution produces a longitudinal person-day dataset suitable for a discrete-time event history analysis. This dataset has a rectangular shape in which each row contains information referring to each day of a neonate’s life from the first to thirtieth day from birth (unless the newborn died before the thirtieth day of life), supplemented with a number of constructed variables representing the main biodemographic and socioeconomic characteristics. The biodemographic variables are the sex of the newborn (a dummy for female or male), multiple births (a dummy for a twin or a singleton), the mother’s age (a four-category variable: less than 25 years, 25–34 years, more than 34 years, and ‘unknown age’), time from the most recent birth, and survival status of the previous child (a four-category variable combining dummy variables for intervals shorter or longer than 19 months and the life status of the previous child). A time-varying variable takes into account the newborn’s age, with the following neonatal subperiods: 0–1, 2–3, 4–6, 7–13, and 14 or more days. Two other covariates refer to SES and other specific household characteristics (the number of women aged 60 and older in the household). Other exogenous variables are also taken into account, controlling for the parish of residence, year of birth, season or month of birth, and wheat prices lagged one year before the birth.
The dataset also includes the main covariates in the analysis: season of birth and daily temperature and their interaction with SES. Each record reports two kinds of temperature registration. Time-constant temperatures refer to the day of birth and do not vary in the following person-day records. Time-varying temperatures change for each day-record according to the corresponding daily temperature.
5. Methods
for two subperiods (1820–1859 and 1860–1900), as we consider national unification in 1861 to be a turning point in Italy’s socioeconomic transformation.
5.1 Logistic regression analysis
In our first model we estimate the effects of season of birth and its interaction with SES, using the sample ofn = 2,786 neonates and 292 neonatal deaths during 1820–1900 and grouped amongm = 947 mothers. Since in this preliminary analysis all the covariates are time-constant and refer to the day of birth, we prefer to estimate a logistic regression model. So we use the following model, with the dummy variable “death (or not) in the first 30 days of life” as a response variable:
= ∑ + + + (1)
whereο denotes the probability that a neonatei from a motherj dies within the 30 days following delivery, represents a set of constants,α is a vector of parameters for the K covariates, andX is the vector of the time-constant covariates that refers to the day of birth.
A cluster random effect, grouping children with the same mother j, is included to take into account unexplained interfamily variation and thus improve the parameter estimates (Larsen et al. 2000). To account for unexplained mortality due to unobserved familial and maternal characteristics we create a latent variable, grouping the observed neonates by their mothers (Scalone et al. 2017). We therefore assume that them cluster random variables are mutually independent and have identical Gaussian distributions, with a mean of zero and ρ1
u variance. Traditional measures to investigate variance
components in random-effects logistic models are computed: the standard deviationρu
of the cluster random effects and the intra-class correlation coefficient (ICC, often indicated byθ), given by the ratio of the variance between the second-level units to the total variance. The ICC represents the total individual variation in the probability of neonatal death attributable to variation among mothers. The ICC quantifies the variation within groups and can also be interpreted as a measure of the residual correlation in the probability of death between two randomly selected newborns with the same mother (Larsen et al. 2000; Larsen and Merlo 2005).7
As the modelling strategy, a set of logistic regression models is estimated (Table 3). First, a base model is shown, including only the SES and the season of birth. Next, a full model includes controls for other biodemographic and exogenous factors, such as
7 Stata 13 (StataCorp 2013) was used for the statistical analyses. The xtlogit commands were applied with the
the number of individuals and older women in the household, time trends, wheat prices, and parish of residence. In the final model the interactions between SES and season of birth are also taken into account.
5.2 Discrete-time event history analysis
After testing the risk of neonatal mortality in the cold winter season, we consider the impact of daily external temperatures. The reconstituted micro-data permit multivariate statistical analysis, using event-history techniques to estimate the odds of death within a month of birth. The characteristics of the person-day dataset indicate that the use of discrete-time models with a person-day record as the unit of analysis is suitable (Allison 1982; Dalla Zuanna and Rosina 2011). We concentrate on births in November, December, January, February, and March over the period 1820–1900, as these months generally registered the highest neonatal mortality and the lowest temperatures. The second model is restricted to the coldest months, since extending the analysis to warmer months could confound and mask the effect of cold conditions and the differential impact by socioeconomic status. High temperatures during the warmest months could negatively affect mortality or have no impact, reducing the observed effect or making it nonlinear.
In total, 1,206 children born from November to March (32,355 person-days) and 175 events (deaths before the end of the first month of life) are taken into account.
We use the person-day dataset and extend equation (1), including at subscript that refers to the currenttth day within 30 days after childbirth:
= + + ∑ + ∑ φ + (2)
where α represents a parameter vector, X refers to the time-invariant controls (biodemographic variables, household covariates, parish, birth year, wheat price, and minimum daily temperature registered on the birth day), andZ andφ stand for the time-varying covariates (neonate age and minimum current daily temperature) and the correspondent vector of coefficients, respectively. As in the previous model specifications, a cluster random effect at the mother level is also included.
5.3 Expected outcomes
In the first logistic regression analysis, higher neonatal mortality risks are expected for the cold winter season and rural landless labourers. A significant interaction between season of birth and SES is also expected, as explained in the theoretical framework section. Regarding the control variables, higher neonatal mortality risks are expected for male newborns, twins, younger and older mothers, and shorter birth interval since the previous living child. Positive linear effects are expected for the number of individuals and the number of women age 60 years and older in the household, which are proxies for family wealth and caregiving attention, respectively. To control for the effects of short-term economic fluctuations, wheat prices are also taken into account, and increases in wheat prices are expected to negatively impact on neonatal survival. Controlling for the parish of birth, lower risks of neonatal death are expected for newborns in San Donnino, which was closer to the town of Bologna. The models include a birth year variable to control for the beneficial effects of progress in obstetrical care on neonatal survival; therefore, a negative linear effect is expected.
In the second discrete-event history model, temperatures are expected to have a negative linear effect as time-constant and time-varying variables. Significant interactions SES*temperatures are also expected, since in in the Bologna area the differential effects of low external temperature among the two main socioeconomic groups – sharecroppers and landless rural labourers – could be due to differences in living conditions and in the quantity and quality of nutritional intake. A control for the month of birth is also included. In rural areas the month of birth could also affect neonatal mortality, since it was also related to the calendar of agricultural work, influencing maternal physical and nutritional conditions.
Random effects at the mother level are also included in both the logistic and the event-history models. When passing from the base model to the full model including the biodemographic factors and the exogenous variables, we therefore expect that the residual variation due to the unexplained component at the family level will decrease, along with the ICC.
6. Results
statistically significant. The risk of neonatal deaths in winter and spring is respectively 2.5 and 1.8 times higher than in summer, while the effect in autumn, with 1.5 times higher risk, has low significance. Thus, season of birth appears to have stronger effects than socioeconomic differences. This tendency is confirmed in the full model (Table 3), which shows stronger and even more significant seasonal effects.8
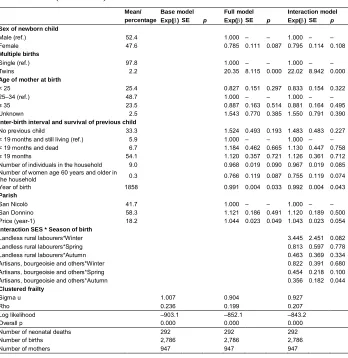
Considering the biodemographic covariates in the full model, female neonates experienced a lower risk of death, with weak statistical significance (less than 10%). Twins registered a much higher risk of neonatal mortality, showing strong statistical significance. Thirty out of sixty-two twins died in the first month of life, showing the high risks associated with a multiple birth. We do not find that family context plays a statistically significant role, although the results are consistent with our expectations. The number of household members and of women older than 60 years is inversely associated with neonatal mortality risk, with a low significance level of 10%.
In addition, a unit increment in wheat prices significantly increases the risk of neonatal death by 4.4%, with a one-year delay. As expected, the year of birth registers a significant declining linear effect.
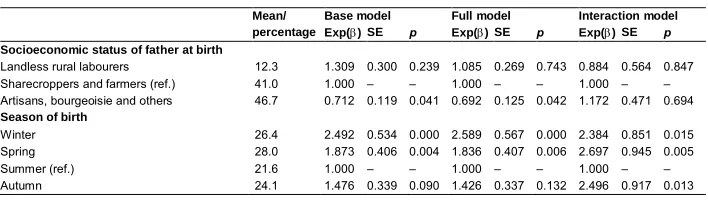
Looking at the SES*season interaction model, the group of artisans, bourgeoisie, and others had a significantly lower neonatal death risk during winter than the other two rural groups, whereas the landless labourers experienced higher risk in winter but without full statistical significance (approximately 10%). However, if we consider the net effect of the interactions, the landless rural labourers registered a far greater relative risk during winter than during other seasons, and than any other group does at any time [(exp (βlandless + βwinter + βlandless*winter)) = exp(–0.123+0.869+1.237) = 7.260].9
Table 3: Logistic regression analysis of neonatal mortality risk in San Nicolò and San Donnino, 1820–1900
Mean/ Base model Full model Interaction model percentage Exp(α) SE p Exp(α) SE p Exp(α) SE p
Socioeconomic status of father at birth
Landless rural labourers 12.3 1.309 0.300 0.239 1.085 0.269 0.743 0.884 0.564 0.847 Sharecroppers and farmers (ref.) 41.0 1.000 – – 1.000 – – 1.000 – – Artisans, bourgeoisie and others 46.7 0.712 0.119 0.041 0.692 0.125 0.042 1.172 0.471 0.694
Season of birth
Winter 26.4 2.492 0.534 0.000 2.589 0.567 0.000 2.384 0.851 0.015 Spring 28.0 1.873 0.406 0.004 1.836 0.407 0.006 2.697 0.945 0.005 Summer (ref.) 21.6 1.000 – – 1.000 – – 1.000 – – Autumn 24.1 1.476 0.339 0.090 1.426 0.337 0.132 2.496 0.917 0.013
8 Other models that we do not show for sake of brevity also include an interaction age* time-varying
temperature without finding significant coefficients.
9 For each SES, respectively ‘landless rural labourers’, ‘sharecroppers and farmers’, and ‘artisans, bourgeoisie
Table 3: (Continued)
Mean/ Base model Full model Interaction model percentage Exp(α) SE p Exp(α) SE p Exp(α) SE p
Sex of newborn child
Male (ref.) 52.4 1.000 – – 1.000 – –
Female 47.6 0.785 0.111 0.087 0.795 0.114 0.108
Multiple births
Single (ref.) 97.8 1.000 – – 1.000 – –
Twins 2.2 20.35 8.115 0.000 22.02 8.942 0.000
Age of mother at birth
< 25 25.4 0.827 0.151 0.297 0.833 0.154 0.322
25–34 (ref.) 48.7 1.000 – – 1.000 – –
≥ 35 23.5 0.887 0.163 0.514 0.881 0.164 0.495 Unknown 2.5 1.543 0.770 0.385 1.550 0.791 0.390
Inter-birth interval and survival of previous child
No previous child 33.3 1.524 0.493 0.193 1.483 0.483 0.227 < 19 months and still living (ref.) 5.9 1.000 – – 1.000 – – < 19 months and dead 6.7 1.184 0.462 0.665 1.130 0.447 0.758 ≥ 19 months 54.1 1.120 0.357 0.721 1.126 0.361 0.712 Number of individuals in the household 9.0 0.968 0.019 0.090 0.967 0.019 0.085 Number of women age 60 years and older in
the household 0.3 0.766 0.119 0.087 0.755 0.119 0.074 Year of birth 1858 0.991 0.004 0.033 0.992 0.004 0.043
Parish
San Nicolò 41.7 1.000 – – 1.000 – –
San Donnino 58.3 1.121 0.186 0.491 1.120 0.189 0.500 Price (year-1) 18.2 1.044 0.023 0.049 1.043 0.023 0.054
Interaction SES * Season of birth
Landless rural labourers*Winter 3.445 2.451 0.082 Landless rural labourers*Spring 0.813 0.597 0.778 Landless rural labourers*Autumn 0.463 0.369 0.334 Artisans, bourgeoisie and others*Winter 0.822 0.391 0.680 Artisans, bourgeoisie and others*Spring 0.454 0.218 0.100 Artisans, bourgeoisie and others*Autumn 0.356 0.182 0.044
Clustered frailty
Sigma u 1.007 0.904 0.927
Rho 0.236 0.199 0.207
Log likelihood –903.1 –852.1 –843.2
Overall p 0.000 0.000 0.000
Number of neonatal deaths 292 292 292
Number of births 2,786 2,786 2,786
Number of mothers 947 947 947
Sources: Parish registers and Status Animarum.
Note: The column ‘Mean/percentage’ reports the mean values of the numerical variables (Number of individuals in household, Number of women 60 years and over, Year of birth, Price at year-1) and the percentage distributions of the categorical covariates (Socioeconomic status, Season, Sex of newborn child, Multiple births, Age of mother, Distance from last birth and survival of last child, Parish, Month of birth, Age).
days as the time-varying variable. Lower temperatures on the day of childbirth significantly increased the risk of neonatal death, whereas no significant effect is found for daily temperature.10 This result is stable and persists in the full model (Table 4), with a 9% reduction in neonatal mortality risk for a unit increment in the temperature at birth.
It is confirmed that multiple births appeared to be extremely dangerous. Neonates of mothers younger than 25 years also had lower mortality risk after birth. To explain this result, we should remember the high average age at first birth noted in the study area (Rettaroli and Scalone 2012). Consequently, the mothers in this category likely were not so young and did not include many adolescents, who would have been more vulnerable to mother–foetus competition for nutrients or difficulties in maternal physical growth. Another explanation is that children of young mothers are more frequently first births, and the category ‘no previous birth interval’ (nonsignificant but with higher risk) implicitly controls for first child. In addition, the number of both individuals and women age 60 years and older in the household had nonsignificant effects during these coldest months. As expected, neonatal mortality risk progressively declined with neonate age.
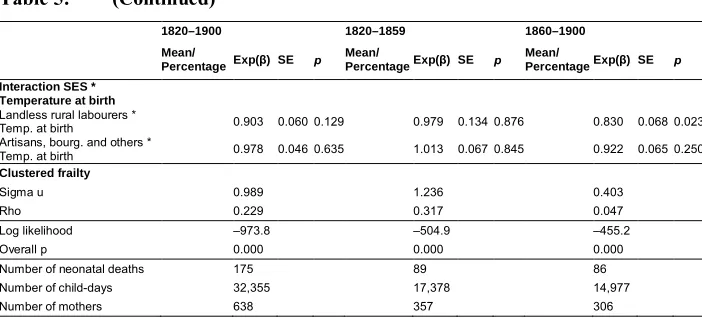
Three other models are also examined by interacting temperature at birth and SES for the complete period of 1820–1900 and the two subperiods of 1820–1859 and 1860– 1900. In the 1860–1900 model the significantly higher neonatal mortality level in San Donnino is an unexpected result, as this parish was closest to the urban area. Interestingly, for the 1860–1900 subperiod only the landless rural labourers had a significant interaction with temperature at birth. According to these results, in the last four decades of the 19th century the lower the class of the household the stronger the effect of the temperature at childbirth.
10 To determine whether low temperatures explain only death on the first day of life, we conduct an additional
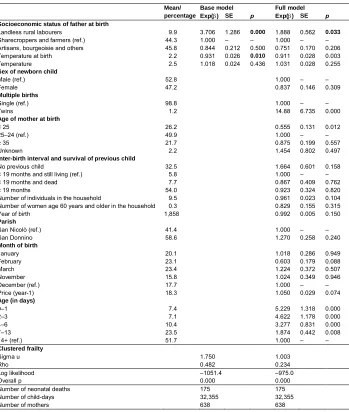
Table 4: Discrete-time event history analysis of neonatal mortality risk in San Nicolò and San Donnino, November–March 1820–1900
Mean/ Base model Full model percentage Exp(α) SE p Exp(α) SE p
Socioeconomic status of father at birth
Landless rural labourers 9.9 3.706 1.286 0.000 1.888 0.562 0.033
Sharecroppers and farmers (ref.) 44.3 1.000 – – 1.000 – – Artisans, bourgeoisie and others 45.8 0.844 0.212 0.500 0.751 0.170 0.206 Temperature at birth 2.2 0.931 0.026 0.010 0.911 0.028 0.003 Temperature 2.5 1.018 0.024 0.436 1.031 0.028 0.255
Sex of newborn child
Male (ref.) 52.8 1.000 – –
Female 47.2 0.837 0.146 0.309
Multiple births
Single (ref.) 98.8 1.000 – –
Twins 1.2 14.88 6.735 0.000
Age of mother at birth
< 25 26.2 0.555 0.131 0.012
25–24 (ref.) 49.9 1.000 – –
≥ 35 21.7 0.875 0.199 0.557
Unknown 2.2 1.454 0.802 0.497
Inter-birth interval and survival of previous child
No previous child 32.5 1.664 0.601 0.158
< 19 months and still living (ref.) 5.8 1.000 – – < 19 months and dead 7.7 0.867 0.409 0.762
≥ 19 months 54.0 0.923 0.324 0.820
Number of individuals in the household 9.5 0.961 0.023 0.104 Number of women age 60 years and older in the household 0.3 0.829 0.155 0.315
Year of birth 1,858 0.992 0.005 0.150
Parish
San Nicolò (ref.) 41.4 1.000 – –
San Donnino 58.6 1.270 0.258 0.240
Month of birth
January 20.1 1.018 0.286 0.949
February 23.1 0.603 0.179 0.088
March 23.4 1.224 0.372 0.507
November 15.8 1.024 0.349 0.946
December (ref.) 17.7 1.000 – –
Price (year-1) 18.3 1.050 0.029 0.074
Age (in days)
0–1 7.4 5.229 1.318 0.000
2–3 7.1 4.622 1.178 0.000
4–6 10.4 3.277 0.831 0.000
7–13 23.5 1.874 0.442 0.008
14+ (ref.) 51.7 1.000 – –
Clustered frailty
Sigma u 1.750 1.003
Rho 0.482 0.234
Log likelihood –1051.4 –975.0
Overall p 0.000 0.000
Number of neonatal deaths 175 175
Number of child-days 32,355 32,355
Number of mothers 638 638
Source: Parish registers and Status Animarum.
Table 5: Discrete-time event history analysis of neonatal mortality risk in San Nicolò and San Donnino with interactions SES*temperatures, November–March 1820–1859 and 1860–1900
1820–1900 1820–1859 1860–1900 Mean/
PercentageExp(β) SE p Mean/
PercentageExp(β) SE p Mean/
PercentageExp(β) SE p Socioeconomic status of father at birth
Landless rural labourers 9.9 2.267 0.721 0.010 9.1 1.042 0.608 0.943 9.9 3.675 1.439 0.001 Sharecroppers and farmers
(Ref.) 44.3 1.000 – – 43.6 1.000 – – 44.3 1.000 – – Artisans, bourgeoisie and
others 45.8 0.778 0.187 0.296 47.4 0.789 0.272 0.491 45.8 0.974 0.353 0.942 Temperature at birth 2.2 0.935 0.037 0.089 2.4 0.925 0.051 0.156 1.9 0.960 0.055 0.479 Temperature 2.5 1.029 0.028 0.286 2.9 1.011 0.039 0.784 2.1 1.056 0.041 0.161
Sex of newborn child
Male (Ref.) 52.8 1.000 – – 53.8 1.000 – – 51.7 1.000 – – Female 47.2 0.841 0.146 0.321 46.2 0.914 0.232 0.724 48.3 0.776 0.184 0.285
Multiple births
Single (Ref.) 98.8 1.000 – – 98.7 1.000 – – 98.8 1.000 – – Twins 1.2 15.30 6.87 0.000 1.3 16.00 12.31 0.000 1.2 15.81 8.30 0.000
Age of mother at birth
< 25 26.2 0.562 0.132 0.014 26.4 0.607 0.206 0.142 26.0 0.465 0.157 0.023 25–24 (Ref.) 49.9 1.000 – – 50.6 1.000 – – 49.0 1.000 – – ≥ 35 21.7 0.881 0.199 0.577 21.8 1.122 0.349 0.711 21.7 0.590 0.195 0.111 Unknown 2.2 1.364 0.755 0.576 1.2 1.900 3.741 0.744 3.3 1.161 0.610 0.776
Distance from last birth and survival of last child
No previous child 32.5 1.684 0.608 0.149 33.7 1.561 0.866 0.422 31.2 2.049 0.949 0.121 < 19 months and still living
(Ref.) 5.8 1.000 – – 5.3 1.000 – – 6.4 1.000 – – < 19 months and dead 7.7 0.896 0.424 0.817 8.3 0.563 0.410 0.431 7.0 1.507 0.957 0.518 ≥ 19 months 54.0 0.933 0.328 0.843 52.7 0.858 0.448 0.769 55.5 1.178 0.556 0.728 Number of individuals in
household 9.5 0.963 0.023 0.120 9.7 0.952 0.032 0.139 9.2 0.982 0.034 0.594 Number of women 60 years
and over 0.3 0.818 0.153 0.283 0.2 0.892 0.325 0.755 0.5 0.865 0.198 0.527 Year of birth 1857.5 0.993 0.005 0.170 1839.0 1.023 0.017 0.165 1878.9 0.979 0.012 0.086
Parish
San Nicolò (Ref.) 41.4 1.000 – – 40.2 1.000 – – 42.8 1.000 – – San Donnino 58.6 1.266 0.256 0.244 59.9 0.817 0.242 0.496 57.2 1.979 0.548 0.014
Month of birth
January 20.1 1.035 0.292 0.903 20.7 0.875 0.351 0.739 19.4 1.172 0.485 0.702 February 23.1 0.593 0.176 0.079 23.2 0.474 0.204 0.083 23.0 0.881 0.377 0.768 March 23.4 1.252 0.381 0.460 25.4 0.924 0.398 0.854 21.0 1.676 0.753 0.251 November 15.8 1.038 0.353 0.914 14.9 0.670 0.337 0.426 16.8 1.542 0.744 0.370 December (Ref.) 17.7 1.000 – – 15.8 1.000 – – 19.8 1.000 – – Price (year-1) 18.3 1.051 0.029 0.067 16.4 0.980 0.051 0.696 20.4 1.048 0.038 0.197
Age (in days)
Table 5: (Continued)
1820–1900 1820–1859 1860–1900 Mean/
PercentageExp(β) SE p Mean/
PercentageExp(β) SE p Mean/
PercentageExp(β) SE p Interaction SES *
Temperature at birth
Landless rural labourers *
Temp. at birth 0.903 0.060 0.129 0.979 0.134 0.876 0.830 0.068 0.023 Artisans, bourg. and others *
Temp. at birth 0.978 0.046 0.635 1.013 0.067 0.845 0.922 0.065 0.250
Clustered frailty
Sigma u 0.989 1.236 0.403
Rho 0.229 0.317 0.047
Log likelihood –973.8 –504.9 –455.2
Overall p 0.000 0.000 0.000
Number of neonatal deaths 175 89 86
Number of child-days 32,355 17,378 14,977
Number of mothers 638 357 306
Source: Parish registers and Status Animarum.
Note: The column ‘Mean/Percentage’ reports the mean values of the numerical variables (Temperature, Temperature at birth, Number of individuals in household, Number of women 60 years and over, Year of birth, Price at year-1) and the percentage distributions of the categorical covariates (Socioeconomic status, Sex of newborn child, Multiple births, Age of mother, Distance from last birth and survival of last child, Parish, Month of birth, Age).
7. Conclusion and discussion
This analysis confirms that the risk of death during the first month of life varied according to weather conditions and increased as external temperatures fell. These results are obtained while controlling for biodemographic factors, temporal trends, short-term economic fluctuations, and observed and unobserved family characteristics. The highest risk of neonatal death is found in winter, and the lowest risk in summer. Significant interactions between SES and season of birth are also found, revealing higher neonatal mortality among rural labourers’ families during winter.
and other cold-related causes of death. This tendency may explain why atrophy was the most common cause of neonatal death in the study region. The scarring effect of very cold weather on the day of birth therefore seems to be linked to weight loss in the first days after birth. In some cases too much weight loss leads to the child’s death in the first week of life due to hypothermia and/or atrophy; in others it only reduces the weight of newborns, making them more exposed to infections such as sepsis and pneumonia, which are typical causes of late neonatal death. Therefore, cold temperatures on the day of birth appear to exert negative effects on newborns: they compromise their chance of survival and significantly increase their risk of death compared to children born when temperatures are not extreme.
That the time-varying temperature has no significant effect does not exclude that a hypothermia mechanism could be at work in the first few days after childbirth. If time-varying temperature has an effect on mortality only in the first few days of life, hypothermia due to exposure to cold could increase neonatal mortality risks on the day of exposure and the days immediately afterwards, since the newborn would be severely weakened. Accordingly, it can be expected that temperature, as a time-varying covariate, would have an effect with the right direction (the right sign) in the first few days after birth. However, we found a nonsignificant result because the estimated effect is diluted by the observations following the first few days of life when its effect is zero. In other models (not shown for the sake of brevity) this covariate was included as a categorical variable (equal or lower than –3°C, between –3 and +3, equal or greater than +3), progressively increasing the neonatal mortality risk for the two coldest categories but without gaining any statistical significance. It is also worth mentioning that in another event history model (not reported for the purpose of simplicity) we excluded the first day of life and considered only the period from the second to the thirtieth days. Even then the effect of the temperature at birth was still significant and in the expected direction. On the one hand, this confirms that the pernicious effect of an early cold exposure at birth lasts over the following days. On the other hand, since temperatures on the first and second days of life are generally correlated, it further reveals that temperatures could play a role not only at birth but also in the days immediately afterwards.
The rural population was likely unaware of the modern child-rearing practices and theories that academics and doctors were then developing. These included proper methods of protecting neonates from cold and bad weather conditions. This argument is supported by a report from the Statistical Council of Bologna (Giunta di Statistica Bolognese), attributing neonatal mortality to “the transportation habits for the civil registration or the baptism, waiting not more than a few days or just some hours after childbirth, exposing the neonate to low temperatures and bad weather conditions on distances that sometimes – for rural families – were equal to several kilometres” (Bertoloni 1870). It is probable that local practices and behaviours commonly influenced new mothers. It is in this context that we can interpret the nonsignificant effect of older women in the household during the coldest months: even if they could assist in childrearing, their lack of modern knowledge could not protect neonates from adverse conditions such as severe cold. Moreover, as mentioned, illiteracy levels in the study area were still high, while family organisation and reproductive behaviours followed norms more traditional than innovative (Rettaroli and Scalone 2012).
Birth interval after the previous child was not found to be significant. A likely explanation is that Catholic registers did not note miscarriages and stillbirths, making this variable imprecise.
To explain why temperature*SES interactions were found to be significant only in the more recent period of 1860–1900, it must be remembered that this period saw prolonged economic crises, increasing prices, and unemployment that hit the agricultural sector especially hard (Malanima 2006). Consequently, rural proletarians experienced deteriorating living standards and worsening maternal and foetal conditions, while low-weight neonates were less physiologically able to withstand colder temperatures. This context can explain the higher neonatal mortality in San Donnino, the nearest parish to Bologna. We already saw that this parish had higher population growth, most probably due to immigration fluxes (Scalone and Del Panta 2008). We can assume that amid growing economic difficulties these immigrants were the most vulnerable social group and suffered the worst living standards, precarious conditions, and higher neonatal mortality.
An understanding of these mechanisms in the past can provide useful lessons for designing and implementing economic development policies in poor countries today. Given that in developing countries, hypothermia still plays a detrimental role in neonatal survival, the presented results underline how important is to protect neonates from cold-stress conditions. Mothers being aware of the extreme importance of protecting newborns from the cold, especially in the first day of life, could play a substantial role in reducing neonatal mortality. Therefore, making all mothers conscious, including the least-educated, those who belong to the most disadvantaged socioeconomic strata, and those who live in the poorest countries, could result in more rapidly meeting a fundamental target11 of the Sustainable Development Goals (United Nations 2015).
11 Target 3.2: “By 2030, end preventable deaths of newborns and children under 5 years of age, with all
References
Agarwal, S., Sethi, V., Pandey, R.M., and Kondal, D. (2007). Human touch vs. axillary digital thermometry for detection of neonatal hypothermia at community level. Journal of Tropical Pediatrics 54(3): 200–201.doi:10.1093/tropej/fmm098. Allison, P.D. (1982). Discrete-time methods for the analysis of event histories.
Sociological Methodology 13: 61–98.doi:10.2307/270718.
Almendra, R., Santana, P., and Vasconcelos, J. (2017). Evidence of social deprivation on the spatial pattern of excess winter mortality.International Journal of Public Health 62(8): 849–856.doi:10.1007/s00038-017-0964-7.
Analitis, A., Katsouyanni, K., Biggeri, A., Baccini, M., Forsberg, B., Bisanti, L., Kirchmayer, U., Ballester, F., Cadum, E., Goodman, P.G., Hojs, A., Sunyer, J., Tittanen, P., and Michelozzi, P. (2008). Effects of cold weather on mortality: Results from 15 European cities within the PHEWE project. American Journal of Epidemiology 168(12): 1397–1408.doi:10.1093/aje/kwn266.
Angeli, A., Del Panta, L., and Samoggia, A. (1995). Aspetti del regime demografico in Emilia-Romagna tra XVIII e XIX secolo. In: Del Panta, L. (ed.). Le Italie demografiche: Saggi di demografia storica. Udine: Università degli Studi di Udine: 123–150.
Bang, A.T., Reddy, H.M., Baitule, S.B., Deshmukh, M.D., and Bang, R.A. (2005). The incidence of morbidities in a cohort of neonates in rural Gadchiroli, India: Seasonal and temporal variation and a hypothesis about prevention. Journal of Perinatology 25(S1): 18–28.doi:10.1038/sj.jp.7211271.
Bellettini, A. (1971). La popolazione delle campagne bolognesi alla metà del secolo XIX. Bologna: Zanichelli.
Bellettini, A. and Samoggia, A. (1984). Evolution différentielle et mouvement saisonnier de la mortalité infantile et enfantine dans la banlieue de Bologne (XVIIIe–XIXe siècles).Annales de Démographie Historique 1983: 195–207. Bengtsson, T. (1993). Combined time-series and life-event analysis: The impact of
Bertoloni, G. (1870).Parole proferite davanti alla Giunta di statistica bolognese il 14 febbraio 1870 intorno alla mortalità dei neonati dell’anno 1869. Bologna: University of Bologna.
Breschi, M., Manfredini, M., and Pozzi, L. (2004). Mortality in the first years of life: Socio-economic determinants in an Italian nineteenth century population. In: Breschi, M. and Pozzi, L. (eds.).The determinants of infant and child mortality in past European populations. Udine: Forum: 123–137.
Breschi, M. and Livi Bacci, M. (1986). Saison et climat comme contraintes de la survie des enfants: L’expérience italienne au XIXe siècle. Population 41(1): 9–35. doi:10.2307/1533178.
Breschi, M. and Livi Bacci, M. (1994). Le mois de naissance comme facteur de survie des enfants. Annales de Démographie Historique 1994: 169–185.doi:10.3406/ adh.1994.1865.
Breschi, M., Derosas, R., and Manfredini, M. (2000). Infant mortality in nineteenth-century Italy: Interactions between ecology and society. In: Bengtsson, T. and Saito, O. (eds.). Population and economy: From hunger to modern economic growth. Oxford: Oxford University Press: 457–489.
Breschi, M., Derosas, R., and Manfredini, M. (2004). Mortality and environment in three Emilian, Tuscan, and Venetian communities, 1800–1883. In: Bengtsson, T., Campbell, C., and Lee, J.Z. (eds.).Life under pressure: Mortality and living standards in Europe and Asia, 1700–1900. Cambridge: Cambridge University Press: 209–251.
Breschi, M., Fornasin, A., Manfredini, M., Pozzi, L., Rettaroli, R., and Scalone, F. (2014). Social and economic determinants of reproductive behavior before the fertility decline: The case of six Italian communities during the nineteenth century. European Journal of Population 30(3): 291–315. doi:10.1007/s10680-013-9303-8.
Carolan, M. and Frankowska, D. (2011). Advanced maternal age and adverse perinatal outcome: A review of the evidence. Midwifery 27(6): 793–801. doi:10.1016/ j.midw.2010.07.006
Carson, C., Hajat, S., Armstrong, B., and Wilkingson, P. (2006). Declining vulnerability to temperature-related mortality in London over the 20th century. American Journal of Epidemiology 164(1): 77–84.doi:10.1093/aje/kwj147. Cazzola, F. (1996). Storia delle campagne padane dall’Ottocento a oggi. Milano:
Comizio Agrario di Bologna (1881). Monografia del podere Bolognese. Bologna: Società tipografica già compositori.
Costa, D.L. (1998). Unequal at birth: A long term comparison of income and birth weight. The Journal of Economic History 58(4): 987–1009. doi:10.1017/ S0022050700021690.
Dal Pane, L. (1969). Economia e società a Bologna nell’età del Risorgimento: Introduzione alla ricerca. Bologna: Compositori.
Dalla Zuanna, G. and Rosina, A. (2011). An analysis of extremely high nineteenth-century winter neonatal mortality in a local context of northeastern Italy. European Journal of Population 27(1): 33–55.doi:10.1007/s10680-010-9219-5. Darmstadt, G.L., Kumar, V., Yadav, R., Singh, V., Singh, P., Mohanty, S., Baqui, A.H.,
Bharti, N., Gupta, S., Misra, R.P., Awasthi, S., Singh, J.V., and Santosham, M. (2006). Introduction of community-based skin-to-skin care in rural Uttar Pradesh, India. Journal of Perinatology 26(10): 597–604. doi:10.1038/sj.jp. 7211569.
DaVanzo, J., Hale, L., Razzaque, A., and Rahman, M. (2008). The effects of pregnancy spacing on infant and child mortality in Matlab, Bangladesh: How they vary by the type of pregnancy outcome that began the interval.Population Studies 62(2): 131–154.doi:10.1080/00324720802022089.
Derosas, R. (2009). The joint effect of maternal malnutrition and cold weather on neonatal mortality in nineteenth-century Venice: An assessment of the hypothermia hypothesis. Population Studies 63(3): 233–251. doi:10.1080/0032 4720903165449.
Diaz, J., Garcia, R., Lopez, C., Linares, C., Tobias, A., and Prieto, L. (2005). Mortality impact of extreme winter temperatures.International Journal of Biometeorology 49(3): 179–183.doi:10.1007/s00484-004-0224-4.
Drevenstedt, G.L., Crimmins, E.M., Vasunilashorn, S., and Finch, C.E. (2008). The rise and fall of excess male infant mortality.Proceedings of the National Academy of Sciences of the United States of America 105(13): 5016–5021. doi:10.1073/ pnas.0800221105.
Ferrari, G. and Livi Bacci, M. (1985). Sulle relazioni tra temperatura e mortalità nell’Italia unita, 1861–1914. In: Societá Italiana di Demografia Storica (ed.).La popolazione italiana nell’Ottocento: Continuità e mutamenti. Bologna: Editrice: 273–297.
Fogel, R.W. (2003). Secular trends in physiological capital: Implications for equity in health care. Perspectives in Biology and Medicine 46(S3): S24–S38. doi:10.1353/pbm.2003.0052.
Fronzoni, S. (2004). L’insegnamento dell’agricoltura tra Emilia e Romagna alla metà dell’Ottocento: L’esperienza dell’Istituto agrario di Ferrara. In: Biagioli, G. and Pazzagli, R. (eds.). Agricoltura come manifattura: Istruzione agraria, professionalizzazione e sviluppo agricolo. Florence: Olschki: 411–453.
Galloway, P.R. (1985). Annual variations in deaths by age, deaths by cause, prices, and weather in London 1670 to 1830. Population Studies 39(3): 487–505. doi:10.1080/0032472031000141646.
Healy, J.D. (2003). Excess winter mortality in Europe: A cross country analysis identifying key risk factors. Journal of Epidemiology and Community Health 35(2): 77–82.doi:10.1136/jech.57.10.784.
Huynen, M.M., Martens, P., Schram, D., Weijenberg, M.P., and Kunst, A.E. (2001). The impact of heat waves and cold spells on mortality rates in the Dutch population. Environmental Health Perspective 109(5): 463–470. doi:10.1289/ ehp.01109463.
Iwamoto, A., Seward, N., Prost, A., Ellis, M., Copas, A., Fottrell, E., Azad, K., Triphaty, P., and Costello, A. (2013). Maternal infection and risk of intrapartum death: A population based observational study in South Asia. BMC Pregnancy and Childbirth 13(245): 1–14.doi:10.1186/1471-2393-13-245.
Jacini, S. (1885). Atti della Giunta per la inchiesta agraria e sulle condizioni della classe Agricola: Relazione finale sui risultati dell’inchiesta redatta per incarico della Giunta dal Presidente Conte Stefano Jacini. Roma: Forzani.
James, W.D., Berger, T.G., and Elston D.M. (2006). Andrews’ diseases of the skin: Clinical dermatology. Philadelphia: Saunders Elsevier.
Keatinge, W.R., Donaldson, G.C., Bucker, K., Jedritsky, G., Cordioli, E., Martinelli, M., Dardanoni, L., Katsouyanni, K., Kunst, A.E., Mackenbach, J.P., McDonald, C., Naya, S., and Vuori, I. (1997). Cold exposure and winter mortality from ischaemic heart disease, cerebrovascular disease, respiratory disease, and all causes in warm and cold region of Europe. The Lancet 349(9062): 1341–1346. doi:10.1016/S0140-6736(96)12338-2.
Kertzer, D.I. and Hogan, D.P. (1989). Family, political economy, and demographic change: The transformation of life in Casalecchio, Italy, 1861–1921. Chicago: University of Wisconsin Press.
Khadka, K.B., Lieberman, L.S., Giedraitis, V., Bhatta, L., and Pandey, G. (2015). The socio-economic determinants of infant mortality in Nepal: Analysis of Nepal demographic Health Survey, 2011.BMC Pediatrics 15(152): 1–11.doi:10.1186/ s12887-015-0468-7.
Knodel, J. (1984). Seasonal variation in infant mortality: An approach with applications. Annales de Démographie Historique 1983: 208–230. doi:10.3406/ adh.1984.1577.
Kramer, K.L. and Lancaster, J.B. (2010). Teen motherhood in cross-cultural perspective. Annals of Human Biology 37(5): 613–628. doi:10.3109/0301446 0903563434.
Kunst, A.E., Looman, C.W.N., and Mackenbach, J.P. (1991). The decline in winter excess mortality in The Netherlands. International Journal of Epidemiology 20(4): 971–977.doi:10.1093/ije/20.4.971.
Landers, J. (1986). Mortality, weather and prices in London 1675–1825: A study of short-term fluctuations. Journal of Historical Geography 12(4): 347–364. doi:10.1016/S0305-7488(86)80174-8.
Larsen, K. and Merlo, J. (2005). Appropriate assessment of neighborhood effects on individual health: Integrating random and fixed effects in Multilevel Logistic Regression. American Journal of Epidemiology 161(1): 81–88. doi:10.1093/ aje/kwi017.
Larsen, K., Petersen, J.H., Budtz-Jørgensen, E., and Endahl, L. (2000). Interpreting parameters in the logistic regression model with random effects. Biometrics 56(3): 909–914.doi:10.1111/j.0006-341X.2000.00909.x.