DEMOGRAPHIC RESEARCH
A peer-reviewed, open-access journal of population sciences
DEMOGRAPHIC RESEARCH
VOLUME 40, ARTICLE 16, PAGES 417–430
PUBLISHED 26 FEBRUARY 2019
http://www.demographic-research.org/Volumes/Vol40/16/ DOI: 10.4054/DemRes.2019.40.16
Descriptive Finding
The association between neonatal death and
facility birth in regions of India
Diane Coffey
c
2019 Diane Coffey.
This open-access work is published under the terms of the Creative Commons Attribution 3.0 Germany (CC BY 3.0 DE), which permits use, reproduction, and distribution in any medium, provided the original author(s) and source are given credit.
1 Introduction 418
2 Data and methods 419
2.1 Data 419
2.1.1 Dependent variable 420
2.1.2 Independent variable 421
2.1.3 Control variables 423
2.2 Methods 423
3 Results 426
3.1 Association between neonatal death and facility birth, by region 426
3.2 Within-village comparisons, by region 426
4 Discussion 428
The association between neonatal death and facility birth in regions
of India
Diane Coffey1
Abstract
BACKGROUND
Reducing neonatal mortality in India is critical to achieving the 2030 Sustainable Devel-opment Goal of a global neonatal mortality rate (NNM) of no more than 12 per 1,000. Policy efforts to reduce India’s NNM, including a large-scale conditional cash transfer program, have focused on promoting birth in health facilities, rather than at home. Be-tween 2005 and 2015, the percentage of facility births doubled, from 40% to 80%.
OBJECTIVE
We assess evidence for the hypothesis that facility births reduce NNM by using new data from the National Family Health Survey, 2015–2016.
METHODS
We analyze the association between neonatal death and facility birth at the region level, using ordinary least squares (OLS) linear probability models with fixed effects for the primary sampling unit, as well as child, mother, and household-level controls.
RESULTS
For babies born outside of Uttar Pradesh and Bihar, facility birth is robustly associated with neonatal survival. The controlled association between facility birth and neonatal survival is 7 per 1,000 in the east region (West Bengal, Assam, Jharkhand, Odisha) and 13 per 1,000 in the central region (Madhya Pradesh and Chhattisgarh). In Uttar Pradesh and Bihar, however, being born in a health facility appears to confer no neonatal survival advantage.
CONTRIBUTION
Documenting the lack of an association between facility birth and neonatal death in Uttar Pradesh and Bihar is important because these states collectively contribute 43% of India’s
NNM. These findings suggest the need for future research to investigate whether and how the quality of maternal and newborn care in health facilities differs across regions.
1. Introduction
The United Nations’ Sustainable Development Goal 3 aims to reduce global neonatal mortality (NNM) to 12 deaths per 1,000 live births by 2030. Reducing NNM in India is critical to achieving this goal because it is home to 27% of neonatal deaths but only 19% of births. India contributes more neonatal deaths than any other country. Its national NNM of 30 per 1,000 in 2015 (IIPS and ICF 2017) masks wide variation across places. Among states with more than 25 million people, Uttar Pradesh had the highest NNM at 45 per 1,000, and Kerala had the lowest at 4 per 1,000. India’s state-level variation in NNM is similar to the country-level variation in NNM that exists on a global scale. According to the 2015 World Development Indicators, the Central African Republic had the second highest NNM in the world at 43 per 1,000, and the United States had an NNM of 4 per 1,000 (World Bank Group 2015).
India’s high NNM is particularly surprising in light of a recent, dramatic increase in the fraction of births that occur in health facilities, rather than at home. In 2005, about 40% of births took place in health facilities; by 2015, this figure was 80%. The increase in facility births was in part due to a large-scale, conditional cash transfer pro-gram called Janani Surkasha Yojana(JSY). JSY was launched in 2005 as part of the central government’s new National Rural Health Mission (NRHM). JSY, which means Safe Motherhood Scheme, pays local health workers to accompany women to deliver in health facilities. Women who deliver in health facilities also receive a cash payment.
A key assumption of the JSY program, and of much of the Indian government’s ma-ternal and child health strategy, is that shifting births from homes to health facilities will reduce NNM (Rao 2017). However, causal analysis to test the validity of this assumption is difficult; it is not possible to randomly assign place of birth.
by the health facility). Considering the large variation in quality of public services across regions and states of India (Dr`eze and Sen 2013), it is also possible that the true effect of hospital birth on neonatal survival was heterogenous.
In this descriptive paper, I use the latest-available data from the National Family Health Survey, 2015–2016 (NFHS-4) to advance understanding of the association be-tween neonatal survival and facility birth. The weighted, uncontrolled, all-India associ-ation between neonatal survival and facility birth was 12 per 1,000. That is, NNM was 12 per 1,000 lower among children born in health facilities than among children born at home. The analysis that follows unpacks this association at the region level, showing that it is robust to controls for possible omitted factors in some regions – particularly in east and central India – and not statistically significantly different from zero in others, includ-ing in Uttar Pradesh and Bihar, two states that together contribute about 43% of India’s NNM.
2. Data and methods
2.1 Data
NFHS-4, conducted between January 2015 and December 2016 is India’s most recent Demographic and Health Survey (DHS). The prior DHS round, the NFHS-3, was con-ducted in 2005–2006. Both are nationally representative, multistage, clustered sample surveys. This paper’s analyses focus on the 2015–2016 survey; summary statistics from both surveys are used to identify recent trends.
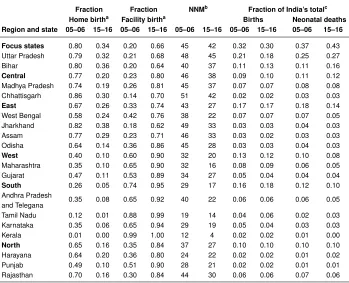
Table 1: Place of birth and NNM in Indian states, 2005–2006 and 2015–2016
Fraction Fraction NNMb Fraction of India’s totalc
Home birtha Facility birtha Births Neonatal deaths
Region and state 05–06 15–16 05–06 15–16 05–06 15–16 05–06 15–16 05–06 15–16
Focus states 0.80 0.34 0.20 0.66 45 42 0.32 0.30 0.37 0.43 Uttar Pradesh 0.79 0.32 0.21 0.68 48 45 0.21 0.18 0.25 0.27 Bihar 0.80 0.36 0.20 0.64 40 37 0.11 0.13 0.11 0.16
Central 0.77 0.20 0.23 0.80 46 38 0.09 0.10 0.11 0.12 Madhya Pradesh 0.74 0.19 0.26 0.81 45 37 0.07 0.07 0.08 0.08 Chhattisgarh 0.86 0.30 0.14 0.70 51 42 0.02 0.02 0.03 0.03
East 0.67 0.26 0.33 0.74 43 27 0.17 0.17 0.18 0.14 West Bengal 0.58 0.24 0.42 0.76 38 22 0.07 0.07 0.07 0.05 Jharkhand 0.82 0.38 0.18 0.62 49 33 0.03 0.03 0.04 0.03 Assam 0.77 0.29 0.23 0.71 46 33 0.03 0.02 0.03 0.03 Odisha 0.64 0.14 0.36 0.86 45 28 0.03 0.03 0.04 0.03
West 0.40 0.10 0.60 0.90 32 20 0.13 0.12 0.10 0.08 Maharashtra 0.35 0.10 0.65 0.90 32 16 0.08 0.09 0.06 0.05 Gujarat 0.47 0.11 0.53 0.89 34 27 0.05 0.04 0.04 0.04
South 0.26 0.05 0.74 0.95 29 17 0.16 0.18 0.12 0.10 Andhra Pradesh
0.35 0.08 0.65 0.92 40 22 0.06 0.06 0.06 0.05 and Telegana
Tamil Nadu 0.12 0.01 0.88 0.99 19 14 0.04 0.06 0.02 0.03 Karnataka 0.35 0.06 0.65 0.94 29 19 0.05 0.04 0.03 0.03 Kerala 0.01 0.00 0.99 1.00 12 4 0.02 0.02 0.01 0.00
North 0.65 0.16 0.35 0.84 37 27 0.10 0.10 0.10 0.10 Harayana 0.64 0.20 0.36 0.80 24 22 0.02 0.02 0.01 0.02 Punjab 0.49 0.10 0.51 0.90 28 21 0.02 0.02 0.01 0.01 Rajasthan 0.70 0.16 0.30 0.84 44 30 0.06 0.06 0.07 0.06
Note: Summary statistics are shown for Indian states that had populations larger than 25 million in the 2011 Census of India. In each survey year, these states accounted for 97% of NNM in India. Estimates use survey weights provided by the NFHS. aA ‘home birth’ is a birth that occurred at home; a ‘facility birth’ is a birth that occurred in a health facility. The NFHS collected data on place of birth for each mother’s last three births in the five years before the survey.bNNM is neonatal mortality, the number of deaths per 1,000 live births that took place in the first month
of life. NNM is computed by using the same method that is used by the DHS (see Rutstein and Rojas 2006) and uses births in the five years before the survey.cFigures for the percentage of total births and neonatal deaths do
not add to one because they use all of India in the denominator, not states with populations greater than 25 million. These figures are computed using births in the five years before the survey.
2.1.1 Dependent variable
the results; it simply changes the scale of regression coefficients so that they are easy to interpret as effects on “per 1,000” rates, which is how NNM is normally published. Children born in the five years before the survey are included in the sample, except for children who were born less than a month before the survey, as their neonatal survival status is unknown.
Table 1 provides state and region-level estimates of NNM that are computed using the method that the DHS uses to compute published summary statistics (Rutstein and Rojas 2006). Table 1 also provides information about the percentage of India’s births and neonatal deaths that occur in each region and state. It shows that the states of Uttar Pradesh and Bihar contribute disproportionately to neonatal death relative to births.
2.1.2 Independent variable
The independent variable of interest is an indicator that is equal to “1” if the child’s birth took place in a health facility (public or private) and “0” if the birth took place at home. The NFHS-4 collected information on place of birth for live births that occurred in the five years before the survey.2 Table 1 summarizes state and region-level variation in the
fraction of births that took place in health facilities. It also includes statistics from the NFHS-3 for comparison.
2.1.3 Control variables
Table 1 shows large variation in NNM across places in India, which suggests that NNM may be influenced by a number of variables other than facility birth, such as the disease environment, underlying maternal health, levels of gender empowerment, cultural prac-tices, and access to prenatal services. Our primary strategy for controlling for these and other possible confounding variables is to use fixed effects for a child’s primary sampling unit (PSU). PSUs are villages in rural areas and census enumeration blocks in urban ar-eas (IIPS and ICF 2017). Children in the same PSUs share many of the characteristics described above. The coefficient on facility birth that is produced by using a PSU-fixed effects regression is computed by averaging differences in neonatal survival between chil-dren who were born in health facilities and at home within the same PSU. PSUs in which there is no variation in place of birth do not contribute to the estimate.3
A PSU-fixed effects regression also permits child, mother, and household-level de-mographic and socioeconomic controls. Below, we describe the wide array of additional controls included in the model.
2.2 Methods
Figures 1 and 2 present the results of uncontrolled and controlled regressions respectively. Figure 1 plots coefficients and standard errors from region or state-level regressions of the following form:
neonatal deathi =β0+β1facility birthi+i, (1) whereiindexes live births andβˆ1is the estimated coefficient of interest.
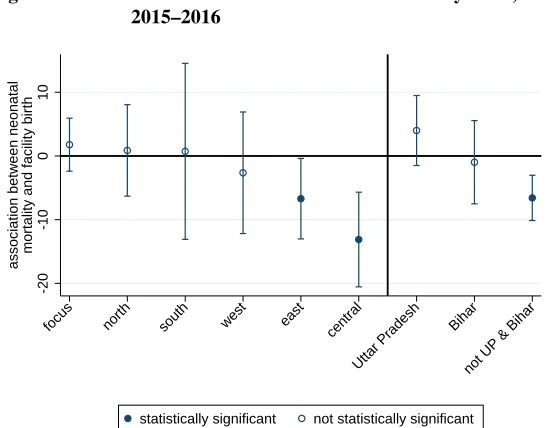
Figure 1: Associations between NNM and facility birth, no controls, 2015–2016
-20
-10
0
10
association between neonatal
mortality and facility birth
west focus north south east central
Uttar Pradesh Bihar
not UP & Bihar
statistically significant not statistically significant
Note: The figure plots OLS regression coefficients and confidence intervals (computed with standard errors clus-tered by PSU) from regressions of NNM on facility birth (see Equation 1) for regions and states of India. Gujarat and Maharastra compose ‘west’; Uttar Pradesh and Bihar compose ‘focus’; Haryana, Punjab, and Rajasthan com-pose ‘north’; Andhra Pradesh, Telegana, Karnataka, Kerala, and Tamil Nadu comcom-pose ‘south’; Orissa, West Bengal, Jharkhand, and Assam compose ‘east’; and Madhya Pradesh and Chhattisgarh compose ‘central.’ ‘Not UP & Bihar’ indicates a result that pools states in all other regions except for Uttar Pradesh and Bihar.
Figure 2 plots coefficients and standard errors from region or state-level regressions of the following form:
neonatal deathip = β0+β1facility birthip+β2maleip+Pb=4
+
b=1 β b
3birth orderip +Ps=6+
s=1 β s
4sibsizeip+β5mother’s years of educationip +β6mother’s age at birthip+β7mother’s age at birth2ip
+αp+Mipθ+SESipγ+ip, (2)
whereαpare fixed effects for childi’s primary sampling unit,p;Mipis a vector of fixed effects for the century month code (CMC) of the child’s birth; andSESipis a large vector of indicators for household socioeconomic status.4 Andmale
ip controls for the sex of
refriger-the child;5birth order is entered as indicator variables, ranging from1to4+; and sibsize is a set of indicators for the number of children ever born to the child’s mother at the time of the survey, ranging from1to6+. The model also includes controls for the mother’s education in years, and mother’s age and age-squared (both in years) at the time of child
i’s birth. Any survival advantage of being born in a health facility that remains after controlling for these indicators reflects a difference that persists even after very detailed demographic, geographic, and SES information has been accounted for.
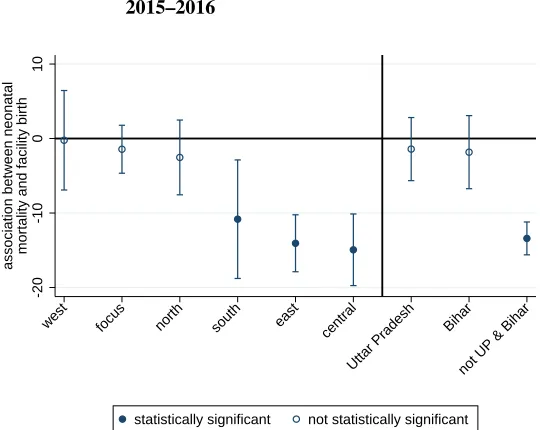
Figure 2: Associations between NNM and facility birth, with controls, 2015–2016
-20
-10
0
10
association between neonatal
mortality and facility birth
focus north south west east central
Uttar Pradesh Bihar
not UP & Bihar
statistically significant not statistically significant
Note: The figure plots OLS regression coefficients and confidence intervals (computed with standard errors clus-tered by PSU) from regressions of NNM on facility birth and controls (see Equation 2 and Section 2.2 for a description of the controls) for regions and states of India. The note for Figure 1 lists the states that correspond to each region.
ator, bicycle, motorcycle, telephone, and car, as well as type of flooring (in 15 categories), type of toilet facility (in 13 categories), household electrification, and mother’s educational attainment (in six categories).
3. Results
3.1 Association between neonatal death and facility birth, by region
Figure 1 plots coefficients and standard errors from Equation 1. It documents associations between neonatal death and facility birth, without controls, in different regions of India. In the south, east, and central regions, there is a negative association between neonatal death and facility birth. In the focus, north, and west regions, babies born in health facilities are no more likely to survive than those born at home.
3.2 Within-village comparisons, by region
Section 2 suggests several reasons why the coefficient on facility birth estimated by Equa-tion 1 may be downwardly biased. Figure 2 plots coefficients on facility birth that are estimated using Equation 2, which controls for PSU fixed effects, as well as a host of child, mother, and household-level demographic and socioeconomic characteristics. For the south region, the introduction of controls attenuates the coefficient to the point that it is no longer statistically significant, suggesting that women who deliver at home in the south may be different, on average, from the majority who deliver in health facilities.6
In east and central India, in contrast, the association between neonatal death and facility birth is both negative and statistically significant, even after the introduction of this large set of controls.
Perhaps the most striking result presented in Figure 2 is given on the right side of the figure. In a pooled regression using data from all of the regions except the focus region – Uttar Pradesh and Bihar – the association between neonatal death and facility birth is negative and statistically significant. For Bihar, the coefficient is not statistically significant, but it is slightly negative. In contrast, the point estimate for Uttar Pradesh is positive, and the confidence interval on the estimate does not overlap with that for the pooled estimate for the other regions.
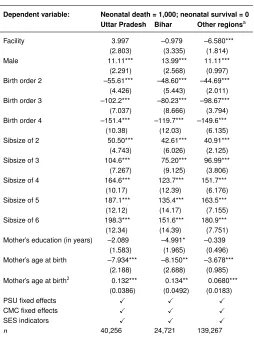
For each of the three places on the right side of Figure 2, Table 2 shows coefficient estimates for facility birth as well as many of the control variables included in the model described by Equation 2. The coefficient estimates underscore the importance of the controls – especially birth order and sibsize – in predicting neonatal mortality in all three places.7 Further, children whose mothers are at the extremes of the age distribution, and
male children, are more likely to die neonatal deaths. However, it is noteworthy that, outside of Uttar Pradesh and Bihar, even after accounting for this wide array of child,
6Another reason why the coefficient may be attenuated in these results is that fewer births are used to identify the association in Equation 2 than Equation 1.
mother, and household-level demographic and socioeconomic controls, as well as PSU fixed effects, children born in a health facility face an NNM about 7 per 1,000 lower than children born at home.
Table 2: Predictors of neonatal mortality, 2015–2016
Dependent variable: Neonatal death = 1,000; neonatal survival = 0 Uttar Pradesh Bihar Other regionsa
Facility 3.997 –0.979 –6.580*** (2.803) (3.335) (1.814) Male 11.11*** 13.99*** 11.11*** (2.291) (2.568) (0.997) Birth order 2 –55.61*** –48.60*** –44.69***
(4.426) (5.443) (2.011) Birth order 3 –102.2*** –80.23*** –98.67***
(7.037) (8.666) (3.794) Birth order 4 –151.4*** –119.7*** –149.6*** (10.38) (12.03) (6.135) Sibsize of 2 50.50*** 42.61*** 40.91*** (4.743) (6.026) (2.125) Sibsize of 3 104.6*** 75.20*** 96.99*** (7.267) (9.125) (3.806) Sibsize of 4 164.6*** 123.7*** 151.7*** (10.17) (12.39) (6.176) Sibsize of 5 187.1*** 135.4*** 163.5*** (12.12) (14.17) (7.155) Sibsize of 6 198.3*** 151.6*** 180.9*** (12.34) (14.39) (7.751) Mother’s education (in years) –2.089 –4.991* –0.339
(1.583) (1.965) (0.496) Mother’s age at birth –7.934*** –8.150** –3.678***
(2.188) (2.688) (0.985) Mother’s age at birth2 0.132*** 0.134** 0.0680***
(0.0386) (0.0492) (0.0183) PSU fixed effects X X X
CMC fixed effects X X X
SES indicators X X X
n 40,256 24,721 139,267
Note: The table reports OLS regression coefficients and standard errors (clustered by PSU) from regressions of NNM on facility birth and controls (see Equation 2 and Section 2.2 for a description of the controls). * p<0.05, ** p
4. Discussion
Considering that promoting facility birth has been the cornerstone of maternal and new-born health policy in India for much of the last decade, the finding that facility birth is uncorrelated with neonatal death in Uttar Pradesh and Bihar – which together contribute 43% of India’s neonatal mortality – is concerning. It is especially concerning for the state of Uttar Pradesh, which has a 2015 neonatal mortality rate higher than every country in the world except Pakistan, and which contributes 27% of India’s neonatal deaths.
The lack of an association between neonatal death and facility birth coheres with prior qualitative research which suggests that the quality of maternal and newborn care in health facilities in this region is extremely poor (Jeffery and Jeffery 2010; Coffey 2014). It also coheres with the results of Semrau et al. (2017), a randomized controlled trial of the “Better Birth” coaching program which aimed to improve the quality of maternal and newborn care in health facilities in 24 districts of Uttar Pradesh. The program, which was successful in other contexts (Kabongo et al. 2017), was intensive. It consisted of 43 day-long coaching visits to each facility over a period of eight months. Nevertheless, twelve months after the program was implemented, researchers found only modest differences in the quality of maternal and newborn care provided in intervention vs. control facilities. They found no differences in perinatal or maternal mortality, nor in major health com-plications following delivery. Thus, both qualitative and quantitative research provide evidence that the government’s rather singular focus on promoting facility birth may be misguided in this high-mortality region.
References
Coffey, D. (2014). Costs and consequences of a cash transfer for hospital births in a rural district of Uttar Pradesh, India.Social Science and Medicine114: 89–96.doi:10.1016/ j.socscimed.2014.05.035.
Coffey, D. and Spears, D. (2018). Neonatal death in India: The effect of birth order in a context of maternal undernutrition. Paper presented at the Population Association of America Conference, Austin, USA, April 10–13, 2019.
Correia, S. (2016). Linear models with high-dimensional fixed effects: An efficient and feasible estimator [unpublished manuscript]. Washington, D.C.: Board of Governors of the Federal Reserve System.
Dr`eze, J. and Sen, A. (2013).An uncertain glory: India and its contradictions. Princeton: Princeton University Press.
Fadel, S.A., Rasaily, R., Awasthi, S., Begum, R., Black, R.E., Gelband, H., Gerland, P., Kumar, R., Liu, L., and Mathers, C. (2017). Changes in cause-specific neonatal and 1–59-month child mortality in India from 2000 to 2015: A nationally representative survey. The Lancet390(10106): 1972–1980. doi:10.1016/S0140-6736(17)32162-1. IIPS and ICF (2017). National Family Health Survey (NFHS-4) 2015–16: India.
Mum-bai: International Institute for Population Sciences.
Jeffery, P. and Jeffery, R. (2010). Only when the boat has started sinking: A mater-nal death in rural north India. Social Science and Medicine 71(10): 1711–1718.
doi:10.1016/j.socscimed.2010.05.002.
Kabongo, L., Gass, J., Kivondo, B., Kara, N., Semrau, K., and Hirschhorn, L.R. (2017). Implementing the WHO Safe Childbirth Checklist: Lessons learnt on a quality im-provement initiative to improve mother and newborn care at Gobabis District Hospital, Namibia. BMJ Open Quality6(2): e000145.doi:10.1136/bmjoq-2017-000145. Rao, S. (2017).Do we care? India’s health system. New Delhi: Oxford University Press.
doi:10.1093/acprof:oso/9780199469543.001.0001.
Rutstein, S.O. and Rojas, G. (2006). Guide to DHS statistics. Calverton: ORC Macro (Technical report). http://www.ophi.org.uk/wp-content/uploads/OPHI-HDCA-SS2012-Guide DHS Statistics.pdf.
Semrau, K.E., Hirschhorn, L.R., Marx Delaney, M., Singh, V.P., Saurastri, R., Sharma, N., Tuller, D.E., Firestone, R., Lipsitz, S., Dhingra-Kumar, N., Kodkany, B.S., Kumar, V., and Gawande, A.A. (2017). Outcomes of a coaching-based WHO Safe Childbirth Checklist program in India. New England Journal of Medicine377(24): 2313–2324.
World Bank Group (2015). World development indicators 2015 [electronic resource]. Washington, D.C.: World Bank Publications.https://data.worldbank.org/indicator.
Acknowledgments
I appreciate helpful suggestions from the editor, two anonymous reviewers, Dean Spears, Sangita Vyas, and Alex Weinreb. All errors are my own. This research was supported by grant P2CHD042849, Population Research Center, awarded to the Population Research Center at The University of Texas at Austin by the Eunice Kennedy Shriver National In-stitute of Child Health and Human Development. The content is solely the responsibility of the author and does not necessarily represent the official views of the NIH.