Research article
Assessment of the microbial communities associated with white
syndrome and brown jelly syndrome in aquarium corals
Michael Sweet1, Jamie Craggs2, James Robson2 and John Bythell1
1School of Biology, Ridley Building, University of Newcastle, Newcastle upon Tyne NE1 7RU, UK 2Horniman Museum & Gardens, London Road, Forest Hill, London, SE23 3PQ, UK
*Corresponding author: [email protected]
Keywords:
Microbial communities, white syn-drome, brown jelly synsyn-drome, corals
Article history:
Received: 02 November 2012 Accepted: 12 May 2013 Published online: 01 July 2013
Abstract
Bacterial and ciliate assemblages associated with aquarium corals displaying white syndrome (WS) and brown jelly syndrome (BJS) were investigated. Healthy (n = 10) and diseased corals (WS n = 18; BJS n = 3) were analysed for 16S rRNA gene bacterial diversity, total bacterial abundance and vibrio-specific 16S rRNA gene abundance. This was conducted alongside analysis of 18S rRNA gene sequenc-ing targetsequenc-ing ciliates, a group of organisms largely overlooked for their potential as causal agents of coral disease. Despite significant differences between healthy and diseased corals in their 16S rRNA gene bacterial diversity, total bacterial abundance and vibrio-specific rRNA gene abundance, no domi-nant bacterial ribotypes were found consistently within the diseased samples. In contrast, one ciliate morphotype, named Morph 3 in this study (GenBank Accession Numbers JF831358 for the ciliate isolated from WS and JF831359 for the ciliate isolated from BJS) was observed to burrow into and underneath the coral tissues at the disease lesion in both disease types and contained algal endosym-bionts indicative of coral tissue ingestion. This ciliate was observed in larger numbers in BJS compared to WS, giving rise to the characteristic jelly like substance in BJS. Morph 3 varied by only 1 bp over 549 bp from the recently described Morph 1 ciliate (GenBank Accession No. JN626268), which has been shown to be present in field samples of WS and Brown Band Disease (BrB) in the Indo-Pacific. This result indicates a close relationship between these aquarium diseases and those observed in the wild.
OPE
N A
C
CE
SS
Introduction
The aquarium industry is a significant global enterprise worth $200-300 million annually (Wabnitz et al. 2003), with an esti-mated 11-12 million pieces of coral traded annually (Vincent 2006). High mortality rates of corals in aquaria are therefore a major concern (Sweet et al. 2011a). While many cases of coral disease in aquaria are non specific and likely due to deterio-rating water quality rather than primary pathogen infections (Borneman and Lowrie 2001; Sweet et al. 2011a), there are a number of specific diseases with clearly defined signs (reviewed by Sweet et al. 2011a). These include brown jelly syndrome (BJS) and Red Slime Algae which have no reported parallels in nature, and white syndrome (WS), which has similar macroscopic signs to the disease of the same name in the wild (Fig 1). As in the wild, WS within aquariums may progress at different rates (reported to be 0.1 cm per day to 10 cm per hr). The coral diseases with similar macroscopic signs but faster rates of lesion progression are variously known as Rapid Tissue Necrosis, Shut Down Reaction, and Stress Related Necrosis (Hormansdorfer et al. 2000; Borneman and Lowrie 2001; Luna et al. 2007; Luna et al. 2010; Sweet et al. 2011a). The slower rates of progression observed in WS within aquaria are similar to those reported for WS in the field (Ainsworth et al. 2007; Andersen et al. 2010; Luna et al. 2010; Work and Aeby 2011).
WS is defined as progressive, full-thickness tissue loss from the coral with a sharp demarcation between the apparently healthy tissue and the denuded white skeleton. Willis et al. (2004) defined the term WS to encompass any disease with unknown etiology which showed these particular pathological field signs. Although several studies have implicated specific
bacterial pathogens to be the cause of WS (Sussman et al. 2008; Luna et al. 2010), there has been no evidence of a signifi-cant population of bacteria at the disease lesion interface or classical signs of bacterial-induced necrosis (Ainsworth et al. 2007; Work and Aeby 2011). Recently, a group of organisms known as ciliates have been shown to be present at the disease lesion interface of WS. These ciliates were shown to ingest the coral tissue and it was suggested that they are responsible for the pathology of these diseases (Sweet and Bythell 2012). This ciliate community was also shown to be similar to that of Brown Band Disease (BrB), another common disease found to occur on the Great Barrier Reef (Sweet and Bythell 2012).
BJS in aquarium corals has been strongly linked to a ciliate, commonly referred to as Helicostoma nonatum (Hummon 2008), which has only recently been assigned to the same ge-nus as that of two ciliates in WS and BrB, Philaster (Sweet et al. 2011a). This study therefore describes both the ciliate and bacterial communities of WS and BJS in aquarium corals using culture-independent (18S and 16S rRNA gene) techniques. Diseased samples were taken opportunistically as they arose in the aquariums, and compared to non-diseased samples collect-ed at the same time from the same aquarium.
Methods
Sample collection
Corals displaying signs of WS were collected from three loca-tions; Horniman Museum and Gardens aquarium in London, the Zoological Society of London (ZSL) aquarium and our own aquarium at Newcastle University. These diseased samples
JZ
AR R
es
ea
rch
ar
ti
cl
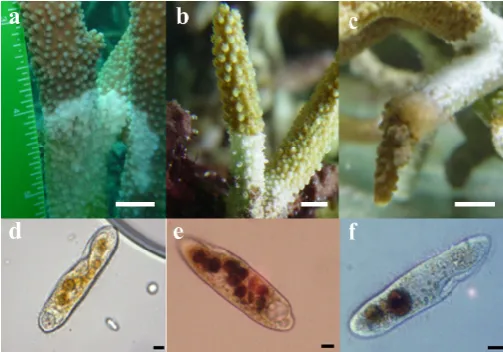
were compared to apparently healthy corals from the same aquari-um systems. Healthy samples (n = 10) and diseased samples (n = 18) of six different species (Table 1) were collected from the various aquariums (Fig 1, Table 1). A further three samples of coral exhib-iting symptoms of brown jelly syndrome (Fig 1f), were acquired from ZSL and The Deep (Hull, UK) for analysis of the ciliates previously proposed as the causal agent of this disease. Coral samples were photographed before removal from the aquarium then placed in 50 ml falcon tubes with 100% EtOH and stored at -20°C until extraction and further analysis. Samples were centrifuged at 20,000 rpm for 20 min to concentrate the tissue slurry, 1000 µl of which was subse-quently used for DNA extraction using QIAGEN DNeasy Blood and Tissue kits (Sweet et al. 2011b) with an added step to concentrate the lysate using a vacuum centrifuge for 2 h at 24° C.
Bacterial diversity, DNA extraction, amplification and DGGE analy-sis
Bacterial partial 16S rRNA gene fragments were amplified using standard prokaryotic primers (357F) (5´-CCTACGGGAGGCAGCAG-3´) and (518R) (ATTACCGCGGCTGCTGG-3’). The GC-rich sequence 5’-CGC CCG CCG 5’-CGC GCG GCG GGC GGG GCG GGG GCA GCA CGG GGG G-3’ was incorporated in the forward primer 357 at its 5’ end to prevent complete disassociation of the DNA fragments during DGGE. Thirty PCR cycles were performed at 94°C for 30 seconds, 53°C for 30 seconds and 72°C for 1 min and a final extension at 72°C for 10 min (Sanchez et al. 2007). Three independent 10 μl PCR reactions were used, each containing 1.5 mM MgCl2, 0.2 mM dNTP (PROMEGA), bovine serum albumin (BSA, 400 ng μl-1), 0.5 mM of both the forward and reverse primers, 2.5 U of Taq DNA polymerase (QBiogene), incubation buffer, and 20 ng of template DNA (Siboni et al. 2007). These replicate PCR’s for each sample were then com-bined and cleaned using QIAGEN QIAquick PCR purification kits, reducing the final volume to 15 µl in Sigma molecular grade H2O. All reactions were performed using a Hybraid PCR Express thermal cycler. PCR products were verified by agarose gel electrophoresis (1.6%
(w/v) agarose) with ethidium bromide staining and visualized using a UV transilluminator.
DGGE was performed using the D-Code universal mutation detec-tion system (Bio-Rad). Bacterial PCR products were resolved on 10 % (w/v) polyacrylamide gels that contained a 30–60 % denaturant gradient for 13 h at 60 °C and a constant voltage of 50 V. Gels were stained with a concentrated solution of 9 µl Sybr® Gold (Sigma) in 50 µl of 1X TAE poured directly onto the gel surface, covered and left in the dark for 20 min then further washed in 500 ml 1X TAE for 30 min and visualized using a UV transilluminator. Bacterial operational taxonomic units (OTUs), were defined from DGGE band-matching analysis using BioNumerics 3.5 (Applied Maths BVBA) following methods described by Guppy and Bythell (2006). Standard internal marker lanes were used to allow for gel-to-gel comparisons. Toler-ance and optimisation for band-matching was set at 1%. OTUs of interest (those which explained the greatest differences/similarities between samples), were identified by sequence analysis. Bands were excised from DGGE gels, left overnight in Sigma molecular grade water, vacuum centrifuged, re-amplified with the appropriate primer set, labelled using Big Dye (Applied Biosystems) transfor-mation sequence kits and sent to Genevision (Newcastle University, UK) for sequencing.
Ciliate diversity, DNA extraction, amplification and DGGE analysis Single cell isolates
Corals were viewed under a binocular microscope and single cell isolates of ciliate morphotypes were sampled using a 10 µl pipette and stored in 1.5 ml micro-centrifuge tubes containing 100 µl EtOH at -20°C. DNA was extracted from the ethanol-fixed single isolates following a modified Chelex Extraction (Walsh et al. 1991). The
sam-Sample Number
Species Location Health
status
Rate of tissue loss (mm2/day) 1 Acropora pulchra HM Healthy NA 2 Acropora formosa HM Healthy NA
3 Acropora sp HM Healthy NA
4 Acropora sp ZSL Healthy NA
5 Pocilliopora damicornis NU Healthy NA 6 Pocilliopora damicornis NU Healthy NA 7 Acropora formosa NU Healthy NA 8 Acropora formosa NU Healthy NA 9 Pocilliopora damicornis HM Healthy NA 10 Pocilliopora damicornis HM Healthy NA
11 Acropora sp HM WS1 0.2
12 Acropora sp HM WS1
0.2 13 Seriatopora hystrix HM WS2 0.2 14 Montipora capricornis HM WS3
0.5 15 Pocilliopora damicornis HM WS1
1.6 16 Acropora sp ZSL WS1
10 17 Pocilliopora damicornis ZSL WS1
10 18 Euphyllia yaeyamnmesis ZSL WS1
10 19 Pocilliopora damicornis NU WS1
10 20 Pocilliopora damicornis NU WS1
1.9 21 Acropora sp ZSL WS1
10 22 Acropora sp ZSL WS1
10 23 Acropora sp ZSL WS1
10 24 Acropora sp ZSL WS1
10 25 Acropora sp ZSL WS1
11
26 Acropora sp NU WS1
16 27 Acropora formosa NU WS1
10 28 Hydnophora rigida HM WS1 28
29 Acropora sp ZSL BJS 20
30 Acropora sp Deep BJS 15
31 Acropora sp Deep BJS 20
1WS starting at the extremities; 2WS starting along the branch; 3WS patchy distribution
Table 1. Sample set illustrating species and location utilised in this study, health status relates to described status of coral at time of samples. Healthy represent apparently healthy specimens, WS represent white syndrome disease signs, BJS brown jelly syn-drome HM = Horniman Museum; ZSL = Zoological society of London; NU = Newcastle University, Deep = The Deep in Hull. Rates of tissue loss are estimates by personal observations in tank systems prior to transportation up to Newcastle for analysis and may not be accurate. Pers. obs. at ZSL showed an average advance rate of the tissue lesion of 10 mm2 day-1 from the base, until ~10 cm from the tip then the rate would be
accelerated and the coral would appear to ‘shut down’ and die off overnight ~100mm2 Figure 1. Sub set of samples exhibiting white syndrome (WS) and the dominant ciliates
ples were centrifuged for 2 min at 20,000 g and washed 3 times in sigma water with a centrifuge step between each wash. After the last wash 50 µl of a 5 % Chelex 100 (sigma) solution and 15 µl of proteinase K (20 mg/ml) were added to the cell isolate. Samples were incubated overnight in a water bath at 56°C, vortexed for 10 sec, boiled in a 100°C water bath for 10 min, vortexed again for 10-20 sec, and finally centrifuged for 3 min at 16,000 g; 40 µl of the supernatant was taken off and put in a fresh micro-centrifuge tube for use in subsequent PCR reactions.
PCR amplifications of single cell isolates were carried out using 20 µl reaction mixtures (final PCR buffer contained: 1 mM MgCl2, and 1 U Taq DNA polymerase (QBiogene); 100 µM deoxynucleoside tri-phosphates; 0.2 µM of each of the forward and reverse primers; and 0.4 % bovine serum albumin, with 20 ng of template DNA. All reac-tions were performed using a Hybaid PCR Express thermal cycler. PCR products were analysed by agarose gel electrophoresis *1.6 % (w/v) agarose+ with ethidium bromide staining and visualized using a UV transilluminator. A nested PCR was used to yield best results, initially with the universal 18S eukaryotic primer pairs f4617 (5’-TCCTGCCAGTAGTCATATGC-3’) (T. Tengs pers. commun.) and r4618 (5’-TGATCCTTCTGCAGGTTCACCTAC-3’). PCR protocol was; 95°C for 3 min, then 40 cycles of (95°C for 30 sec, 55°C for 30s and 72°C for 90s); followed by 5 min at 72°C (Oldach et al. 2000). Then with inter-nal ciliate specific primers 384f-cil (5’-YTBGATGGTAGTGTATTGGA-3’) and 1147r-cil (5’-GACGGTATCTRATCG TCTTT-3’). PCR protocol was; 94°C for 5 min, then 30 cycles of (94°C for 45 sec, 55°C for 60 sec and 72°C for 90 sec); followed by 72°C for 7 min (Dopheide et al. 2008). Sequencing was carried out as above using Big Dye sequence kits and cleaned with an EtOH precipitation method and sequenced at Genius limited, Newcastle University.
Ciliate DGGE
The same coral samples (as used for the bacterial analysis) were analysed for their ciliate diversity. Partial ciliate 18S rRNA gene ribo-types were amplified with a single-round PCR approach (Jousset et al. 2010). Three replicate PCR reactions were carried out as above (final PCR buffer contained: 1 mM MgCl2, and 1 U Taq DNA polymer-ase (QBiogene); 100 µM dNTPs; 0.2 µM of each of the forward and reverse primers; and 0.4% BSA, with 20 ng of template DNA. Primers Cil-f (5’-TGGTAGTGTATTGGACWACCA-3’) with a 36-bp GC clamp (Muyzer and Smalla 1998) attached to the 5’ end and CilDGGE-r (5’-TGAAAACATCCTTGGCAAATG-3’) were used. Initial denaturation was at 94°C for 5 min, followed by 26 cycles of 94°C for 1 min, 52°C for 1 min, and 72°C for 1 min and a final elongation of 10 min at 72°C to reduce double bands in the DGGE patterns (Janse et al. 2004). PCR products of the 3 replicate samples were combined and subject-ed to DGGE on a D-code system (Bio-Rad) with 0.75 mm thick 6 % polyacrylamide gels in 1 X TAE buffer. Electrophoresis was carried out for 16 h at 60°C and 50 V in a linear 32 to 42 % deionised forma-mide denaturing gradient. Gels were stained as above and OTUs of interest were similarly identified by band excision and sequencing.
Quantitative PCR (qPCR) targeting Vibrio sp.
Quantitative PCR (qPCR) was conducted on an Engine Opticon® 2 system in order to test whether Vibrio sp. relative 16S rRNA abun-dance differed between a random subset of the diseased samples (n = 10) and healthy coral samples (n = 10). qPCR assays were standard-ised using a serial dilution (109 – 101 CFU ml-1; 3 replicates per dilu-tion) of pure cultures of Vibrio harveyi (NR043165) and run on the qPCR machine to determine threshold cycles. Vibrio-specific primers 567F (5’-GGCGTAAAGCGCATGCAGGT-3’) and 680R (5’-GAAATTCTACCCCCCTCTACAG-3’) (Thompson et al. 2004; Sweet et al. 2010), were used for all samples. qPCR reaction mixtures totalled 25
μl and consisted of 12.5 µl of 2X Quantitect® Sybr® Green 1 super-mix (Qiagen), 1.25 μl each of 0.5 mM forward and reverse primers, 50 ng DNA and 9.5 μl Sigma molecular grade water. Each set of sam-ples included a negative control, in which water was substituted for the DNA sample. qPCR was performed with an initial activation step
of 15 min at 95°C, followed by 39 cycles (94°C for 15 sec, 58°C for 30 sec, primer annealing at 58°C for 30 sec). The fluorescent product was detected after each extension. Following amplification, melting temperature analysis of PCR products was performed to determine the specificity of the PCR. The melting curves were obtained by slow heating at 0.5°C sec-1 increments from 50 to 90°C, with continuous fluorescence recording.
Total bacterial abundance
To estimate bacterial abundance, 1000 µl of tissue slurry was filtered through a 0.22 µm black polycarbonate filter and fixed with 100 µl of paraformaldehyde until analysis (Fuhrman et al. 2008). These filters were stained with 100 μl DAPI solution (final concentration 5 μg ml -1) for 10 min, rinsed with Phosphate Buffer Solution (Yu et al. 1995;
Weinbauer et al. 1998; Yamaguchi et al. 2007), and viewed under epifluorescence microscopy using a DAPI-specific filter set. Counts on 50 fields of view (FOV), were taken using an automatic cell coun-ter (Cell C; (Selinummi et al. 2005). The parameters were set to ex-clude any objects smaller than 0.03 μm2 and anything larger than 0.7
μm2. Counts were scaled up to the total area of the filter and calcu-lated to give total bacterial abundance per volume of tissue on the diseased corals (cells cm3). Total amount of diseased tissue rather than complete coral nubbin surface area was used to account for the varying amount of tissue on the diseased samples as this could not be standardised at time of collection. Counts of n = 3 tissue sub-samples were taken from each coral and averaged to provide a cell density per sample.
Statistical analysis
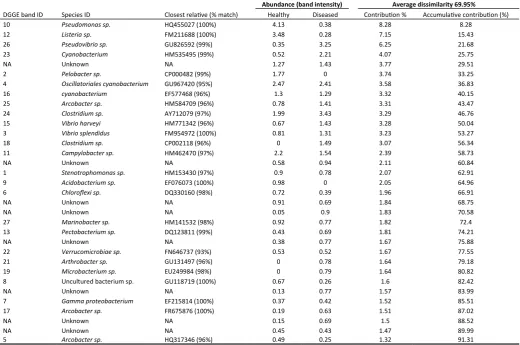
Analysis of Similarity (ANOSIM) tests based on Bray-Curtis similari-ties (Clarke and Warwick 2001) were used to test for differences in the bacterial 16S and ciliate 18S rRNA gene DGGE profiles associated with diseased and healthy corals. A non-metric multidimensional scaling (MDS) analysis was used to represent each sample type on a 2-D plot (Clarke and Warwick 2001). An analysis of contribution to similarities (SIMPER) based on DGGE analysis with both relative band intensity and presence absence was performed to determine which 16S and 18S rRNA gene OTUs best explained dissimilarities among sample types that were statistically different. The abundance of bacteria (total bacterial counts) was compared between healthy and diseased samples with a one-way ANOVA. Data met the assumptions of normality and equality of variances (Anderson Darling and Levene’s tests respectively). For qPCR a standard curve delineating threshold (CT) values of V. harveyi against number of V. harveyi (CFU ml-1) in pure cultures gave a standard curve (R2 = 0.996) allowing quantification of the assay. Calculations were then based on 1 CFU relating to a genome copy. One way ANOVA was used to compare between healthy and diseased samples for Vibrio fold difference.
Results
Significant differences based on profiling of bacterial communities using DGGE analysis (PERMANOVA, R = 0.494, p = 0.001), were found between the bacterial 16S rRNA gene diversity of healthy and diseased coral samples (Fig 2, 3). Within healthy coral samples, there were no significant differences between the three aquariums where samples were sourced from, or between species of coral (two-way crossed ANOSIM, R = 0.29, p = 0.2 and R = 0.187, p = 0.28, respec-tively). Similarly no significant differences were detected between diseased samples with different rates of progression and disease type (WS or BJS) (two-way crossed ANOSIM, R = 0.19, p = 0.09 and R = 0.22, p = 0.12 respectively, Fig 3a,b).
Figure 2. DGGE analysis of bacterial 16S rRNA gene diversity from healthy and diseased corals. Healthy = corals showing no signs of distress or symptoms of disease at time of collection; WS = white syndrome collected from aquariums, corals showing signs of some form of tissue necrosis similar to that known as rapid tissue necrosis or white syndrome. FWS = field white syndrome from Heron Island as reported in Sweet and Bythell 2012, used as a reference to show similarities and differences between those in aquarium and those in the wild. Arrows indicate corals symbiotic algae, Symbiodinium sp. Band numbers (1 – 27 in blue) relates to ribotypes excised from the cell and sequenced (Table 2). Intermittent marker lanes (m) allowed gel to gel comparison using the software BioNumerics.
increased significantly (ANOVA, df = 1, F = 4.46, p = 0.043) in dis-eased coral compared to healthy (1.5 ± 0.48 (SD) x 106 cell cm-3 and 5.3 ± 0.37 (SD) x 105 cells cm-3 respectively) (Fig 4b).
There were several bacterial ribotypes (a Pseudomonas sp. Gen-Bank closest relative HQ455027 and a Listeria sp. GenBank closest relative FM211688) which reduced in dominance in diseased tissues compared to healthy samples (Fig 2 and 3c,d). Whilst two other ribo-types were completely absent from diseased samples, including a Pelobacter sp. (GenBank closest relative CP000482) and a Acidiobac-terium sp. (GenBank closest relative EF076073) (Table 2). Several bacterial ribotypes increased in relative 16S rRNA gene abundance in some diseased samples including ribotypes similar to a Pseudovibrio sp. (GenBank closest relative GU826592), a Cyanobacterium sp. (GenBank closest relative HQ230344), a Arcobacter sp. (GenBank closest relative HM584709) and two Vibrio sp. (GenBank closest relative HM771342 and FM954972; Fig 3e and f respectively). Three bacterial ribotypes were absent from healthy specimens and domi-nant in some diseased samples, including a Clostridium sp. (GenBank closest relative CP002118; Fig 3g), a Arthrobacter sp. (GenBank clos-est relative GU131497; Fig 3h) and a Microbacterium sp. (GenBank closest relative EU249984) (Fig 2 and 3, Table 2). However, there were no bacterial ribotypes consistently present in all cases of dis-ease (Fig 2).
Ciliates were only observed on diseased tissues and completely absent in healthy corals. This observation was supported by 18S rRNA gene analysis which showed a diversity of ciliate ribotypes in diseased samples and produced no PCR product in healthy samples (Fig 5). At least 7 ciliate ribotypes were consistently present in all diseased corals. These included ribotypes similar to a Pseudokero-nopsis sp. (GenBank closest relative HQ228545), a Aspidisca sp. (GenBank closest relative AF305625), a Philaster sp. (GenBank clos-est relative FJ648350), a Glauconema sp. (GQ214552), a Paradisco-cephalus sp. (GenBank closest relative EU684746), a Licnophora sp.
Figure 4. (a) Total bacterial abundance of healthy and diseased corals within aquari-um, acquired from filtered tissue slurry and DAPI staining, counts made using the automatic cell counter Cell C; (b) total relative Vibrio sp. per cm3 of tissue present
within healthy and diseased coral samples, acquired from quantitative PCR (see materials and methods) for ten replicate qPCR runs for both healthy and diseased samples. Error bars represent SE for collective mean.
Abundance (band intensity) Average dissimilarity 69.95%
DGGE band ID Species ID Closest relative (% match) Healthy Diseased Contribution % Accumulative contribution (%)
10 Pseudomonas sp. HQ455027 (100%) 4.13 0.38 8.28 8.28
12 Listeria sp. FM211688 (100%) 3.48 0.28 7.15 15.43
26 Pseudovibrio sp. GU826592 (99%) 0.35 3.25 6.25 21.68
23 Cyanobacterium HM535495 (99%) 0.52 2.21 4.07 25.75
NA Unknown NA 1.27 1.43 3.77 29.51
2 Pelobacter sp. CP000482 (99%) 1.77 0 3.74 33.25
4 Oscillatoriales cyanobacterium GU967420 (95%) 2.47 2.41 3.58 36.83
16 cyanobacterium EF577468 (96%) 1.3 1.29 3.32 40.15
25 Arcobacter sp. HM584709 (96%) 0.78 1.41 3.31 43.47
24 Clostridium sp. AY712079 (97%) 1.99 3.43 3.29 46.76
15 Vibrio harveyi HM771342 (96%) 0.67 1.43 3.28 50.04
3 Vibrio splendidus FM954972 (100%) 0.81 1.31 3.23 53.27
18 Clostridium sp. CP002118 (96%) 0 1.49 3.07 56.34
11 Campylobacter sp. HM462470 (97%) 2.2 1.54 2.39 58.73
NA Unknown NA 0.58 0.94 2.11 60.84
1 Stenotrophomonas sp. HM153430 (97%) 0.9 0.78 2.07 62.91
9 Acidobacterium sp. EF076073 (100%) 0.98 0 2.05 64.96
6 Chloroflexi sp. DQ330160 (98%) 0.72 0.39 1.96 66.91
NA Unknown NA 0.91 0.69 1.84 68.75
NA Unknown NA 0.05 0.9 1.83 70.58
27 Marinobacter sp. HM141532 (98%) 0.92 0.77 1.82 72.4
13 Pectobacterium sp. DQ123811 (99%) 0.43 0.69 1.81 74.21
NA Unknown NA 0.38 0.77 1.67 75.88
22 Verrucomicrobiae sp. FN646737 (93%) 0.53 0.52 1.67 77.55
21 Arthrobacter sp. GU131497 (96%) 0 0.78 1.64 79.18
19 Microbacterium sp. EU249984 (98%) 0 0.79 1.64 80.82
8 Uncultured bacterium sp. GU118719 (100%) 0.67 0.26 1.6 82.42
NA Unknown NA 0.13 0.77 1.57 83.99
7 Gamma proteobacterium EF215814 (100%) 0.37 0.42 1.52 85.51
17 Arcobacter sp. FR675876 (100%) 0.19 0.63 1.51 87.02
NA Unknown NA 0.15 0.69 1.5 88.52
NA Unknown NA 0.45 0.43 1.47 89.99
5 Arcobacter sp. HQ317346 (96%) 0.49 0.25 1.32 91.31
(GenBank closest relative DQ445606) and a Holosticha sp. (GenBank closest relative DQ059583). All morphotypes detected visually and identified by sequencing single cell isolates were also detected by DGGE analysis of the ciliate community. Five of the seven ribotypes identified in WS samples matched (with >99% similarity) to those recently identified in WS in the wild (Sweet and Bythell 2012, Fig 5). These included the Pseudokeronopsis sp., Aspidisca sp., Philaster sp., Glauconema sp. and Holosticha sp. One DGGE band in the aquar-ium samples (Band 4 in Fig 5) was identified as a fungus, Han-seniaspara sp. (GenBank closest relative JF306024), and another (Band 9 in Fig 5) was identified as a nematode similar to Chromodori-na sp. (GenBank closest relative AY854207), indicative of a limited amount of non-specific PCR amplification with these primers.
Only one ciliate type was observed to ingest coral tissue, as evi-dent from the presence of coral symbiotic algae within the cell (Fig 1 d-f). This was commonly the most abundant ciliate observed and was found consistently in all WS and BJS samples. It was identified from single cell isolates as 99% similar over 549 base pairs to Philas-ter digitformis (FJ648350) and was morphologically similar to Por-postoma notatum (=notate), (Song 2000), P. guamense (Lobban et al. 2011) and Helicostoma notatum (the ciliate associated with BJS reviewed in Sweet et al. 2011a). However, single cell sequences obtained from this morphotype in aquarium disease samples were distinct (92% sequence similarity over 549 bp) from the recently submitted sequence for Porpostoma notatum (GenBank closest rela-tive HM236335). Sequence data is currently lacking for the only oth-er Porpostoma species reported, Porpostoma guamense so compari-son with this species on a genetic level could not be done. Two unique GenBank accession numbers have been submitted for the morphotype in this study, JF831358 for ciliates acquired from corals with WS and JF831359 for ciliates associated with BJS. These WS and BJS sequences were closely related (>99% over 549 bp) to ribotypes recently identified in wild corals with WS (GenBank closest relative HQ204545) and Brown Band Disease (GenBank closest relative HQ204546), varying by only 2 bp over 549 (Sweet and Bythell 2012; Fig 6). Thus, the evidence strongly suggests that this same ciliate is the dominant member of WS-associated communities in both aquar-ium and wild samples and is also a dominant member of BJS and BrB communities (this study and Sweet and Bythell 2012).
Discussion
There was a significant difference between bacterial 16S rRNA gene diversity of healthy and diseased coral samples and a general in-crease in bacterial load within diseased samples, a result consistent with previous findings (Luna et al. 2007; Sussman et al. 2008; Ains-worth et al. 2010; Luna et al. 2010). In previous studies specific bac-teria have been proposed as single causal agents to certain coral diseases such as WS. The most commonly referred to are from the genus Vibrio (Luna et al. 2007; Sussman et al. 2008; Luna et al. 2010). However, in this study there were no single dominant bacterial
ribotypes consistently present within all diseased samples. This sup-ports the report by Willis et al. (2004), in which they defined WS as a group of unidentified diseases occurring in Indo-Pacific corals with unknown etiology. Two Vibrio sp. and a Pseudovibrio sp. were found to increase in abundance within diseased specimens, making them potential candidates for pathogenesis (Sweet and Bythell 2012). However, the two Vibrio sp. were also detected in healthy as well as diseased samples. Several other potential pathogens were also shown to increase in relative 16S rRNA gene abundance in individual diseased samples, including ribotypes similar to; a Cyanobacteria sp., a Arcobacter sp., a Clostridium sp., a Arthrobacter sp. and a Micro-bacterium sp., however none of these specific bacteria were consist-ently detected in all diseased samples.
If WS was simply a case of a specific single bacterial pathogen and providing that the samples were taken at the same stage of disease progression, when casual agents would be in high abundance and high activity, you would expect to see a single dominant ribotype consistent across all samples exhibiting signs of this disease. It is therefore likely that WS is caused by an initial systemic infection by any number of potential bacterial pathogens depending on which are present when the coral becomes stressed. In addition, it should be possible to co-localise these bacterial populations with histo-pathology. There should be an increase in bacterial populations at the disease lesion interface and/or classic signs of bacterial induced necrosis, which up to now has not been possible (Ainsworth et al. 2007; Work and Aeby 2011).
In contrast, the consistent presence of the same ciliate, identified as similar to Philaster digitformis (FJ648350), in all diseased samples exhibiting signs of WS and those from samples exhibiting BJS, yet absent in the healthy specimens, suggests that this ciliate is an im-portant and regularly detectable associate of the disease. Observa-tions of the ingestion of coral tissues, and presence of coral endo-symbiotic algae within the ciliate suggests that either these ciliates are directly involved in pathogenesis or alternatively they are simply associated with the necrotic tissue of the disease. Regardless, these ciliates are clearly important in the pathology of these aquarium diseases (namely the sharp band of denuded skeleton adjacent to apparently healthy tissue) a result supporting that recently found in the wild (Sweet and Bythell 2012). The ciliate identified as being involved in pathogenesis in these aquarium diseases is >99% similar to ciliates also consistently identified in both WS (HQ204545) and BrB (HQ204546) in the wild (Sweet and Bythell 2012). Several other ciliates previously identified in WS and BrB in the wild were also detected with the aquaria however were not shown to ingest coral tissues and are likely secondary colonisers. Interestingly, the domi-nant ciliate of BrB, first identified by Bourne et al. (2008), and also involved in coral tissue feeding in the wild diseases (Sweet and Bythell 2012), was absent from the aquarium diseases, suggesting that it not a necessary component of the WS pathology.
Although disease causation cannot be inferred using a purely culture independent approach, the observations of histophagy (Ainsworth et al. 2007; Work and Aeby 2011), together with
similari-Figure 5. DGGE analysis of ciliate 18S rRNA gene diversity from healthy and diseased corals. Healthy = corals showing no signs of distress or symptoms of disease at time of collection; WS = white syndrome from aquarium, corals showing signs of some form of tissue necrosis similar to that known as rapid tissue necrosis or white syndrome. FWS = Field white syndrome from Heron Island as reported in Sweet and Bythell (2012), used as a reference to show similarities and differences between those in aquarium and those in the wild. Band numbers (1–9 in blue) relate to ribotypes excised from the cell and sequenced. 1 = Pseudocarnopsis sp. (HQ228545); 2 =
Aspidisca steini (AF305625), 3 = Philaster sp. (FJ648350), 4 = Hanseniaspara sp. (JF306024), 5 =
ties of ciliate communities in aquarium and wild corals displaying similar disease signs has led us to confirm our hypotheses reported in Sweet and Bythell (2012). In short, either; (i) opportunistic patho-genic bacterial species such as the widely-reported vibrios are the primary agents, invading healthy tissues and leading to an impaired physiological condition which allows ciliate communities to invade and proliferate at the disease lesion. Or, alternatively (ii) ciliates are the causal agents and the bacterial agents identified are either non-specific pathogens infecting the tissues that have been compromised by ciliate histophagy or are invading the dead and decomposing tissues at the lesion interface or the skeletal surfaces immediately adjacent to it. A further hypothesis can also be inferred in that the corals physiological condition is severely impaired due to either envi-ronmental stress or for example infection from other organisms not investigated in this study e.g. viruses (Davy et al. 2006; Marhaver et al. 2008) and/or fungi (Lecampionalsumard et al. 1995). This in turn would then allow for secondary invasion scenarios from both bacte-ria and ciliates.
Since potential bacterial pathogens previously linked to coral disease have routinely been detected in healthy corals in this and many other studies (Bourne and Munn 2005; Klaus et al. 2005; Gil-Agudelo et al. 2007; Arboleda and Reichardt 2009; Kvennefors et al. 2010; Luna et al. 2010), it is essential that studies assessing disease causation by techniques such as pure culture inoculations, control for the inadvertent increase in relative abundance of other potential pathogens. In our own experimental aquarium facilities, the ciliate type implicated in pathogenesis in this study (JF831359), was preva-lent in aquarium samples within one week of initial set up (pers. obs.). Since we show here that these ciliates are absent from non-diseased coral, we strongly recommend that future studies address-ing Koch’s postulates, simultaneously test for the presence of ciliates
via light microscopy and molecular screening to ensure that the stress of applying the inoculate does not inadvertently promote these or other potential pathogens, which are apparently ubiquitous in the field and in experimental aquaria.
Acknowledgements
Thanks to the Deep Aquarium in Hull for tissue samples of corals showing signs of BJS. Funding for this research was provided by the Natural Environ-mental Research Council, UK (NE/E006949).
References
Ainsworth T., Fine M., Roff G., Hoegh-Guldberg O. (2008) Bacteria are not the primary cause of bleaching in the Mediterranean coral Oculina patagoni-ca. ISME Journal 2: 67-73.
Ainsworth T.D., Thurber R.V., Gates R.D (2010) The future of coral reefs: a microbial perspective. Trends in Ecology & Evolution 25: 233-240. Ainsworth T.D., Kvennefors E.C., Blackall L.L., Fine M., Hoegh-Guldberg O.
(2007) Disease and cell death in white syndrome of Acroporid corals on the Great Barrier Reef. Marine Biology 151: 19-29.
Andersen S.B., Vestergaard M.L., Ainsworth T.D., Hoegh-Guldberg O., Kuhl M. (2010) Acute tissue death (white syndrome) affects the microenviron-ment of tabular Acropora corals. Aquatic Biology 10: 99-104.
Arboleda M., Reichardt W.G. (2009) Epizoic Communities of Prokaryotes on Healthy and Diseased Scleractinian Corals in Lingayen Gulf, Philippines.
Microbial Ecology 57: 117-128.
Borneman E.H., Lowrie, J. (2001) Advances in captive husbandry and propa-gation: An easily utilized reef replenishment means from the private sector? Bulletin of Marine Science 69: 897-913.
Bourne D.G., Munn C.B. (2005) Diversity of bacteria associated with the coral
Pocillopora damicornis from the Great Barrier Reef. Environmental Mi-crobiology 7: 1162-1174.
Bruckner A., Bruckner R. (1998) Rapid-wasting disease: Pathogen or preda-tor? Science 279: 2023-2025.
Clarke K.R., Warwick R.M. (2001) A further biodiversity index applicable to species lists: variation in taxonomic distinctness. Marine Ecology-Progress Series 216: 265-278.
Davy S.K., Burchett S.G., Dale A.L., Davies P., Davy J.E., Muncke C., Hoegh-Guldberg O., Wilson W.H. (2006) Viruses: agents of coral disease? Diseas-es of Aquatic Organisms 69: 101-110.
Dopheide A., Lear G., Stott R., Lewis G. (2008) Molecular characterization of ciliate diversity in stream biofilms. Applied and Environmental Microbiol-ogy 74: 1740-1747.
Fuhrman J.A., Steele J.A., Hewson I., Schwalbach M.S., Brown M.V., Green J.L., Brown J.H. (2008) A latitudinal diversity gradient in planktonic ma-rine bacteria. Proceedings of the National Academy of Sciences of the United States of America 105: 7774-7778.
Gil-Agudelo D.L., Fonseca D.P., Weil E., Garzon-Ferreira J., Smith G.W. (2007) Bacterial communities associated with the mucopolysaccharide layers of three coral species affected and unaffected with dark spots disease.
Canadian Journal of Microbiology 53: 465-471.
Guppy R., Bythell J.C .(2006) Environmental effects on bacterial diversity in the surface mucus layer of the reef coral Montastraea faveolata. Marine Ecology-Progress Series 328:133-142
Hormansdorfer S., Wentges H., Neugebaur-Buchler K., Bauer J. (2000) Isola-tion of Vibrio alginolyticus from seawater aquaria. International Journal of Hygiene and Environmental Health 203: 169-175.
Hummon W. (2008) Meiofauna Marina. Biodiversity, morphology and ecolo-gy of small benthic organisms. Department of Biological Sciences, Ohio University, USA
Janse I., Bok J., Zwart G. (2004) A simple remedy against artifactual double bands in denaturing gradient gel electrophoresis. Journal of Microbiologi-cal Methods 57: 279-281.
Jousset A., Lara E., Nikolausz M., Harms H., Chatzinotas A. (2010) Application of the denaturing gradient gel electrophoresis (DGGE) technique as an efficient diagnostic tool for ciliate communities in soil. Science of the Total Environment 408:1221-1225
Klaus JS., Frias-Lopez J., Bonheyo G.T., Heikoop J.M., Fouke B.W. (2005) Bac-terial communities inhabiting the healthy tissues of two Caribbean reef corals: interspecific and spatial variation. Coral Reefs 24: 129-137. Kvennefors E.C.E., Sampayo E., Ridgway T., Barnes A.C., Hoegh-Guldberg O.
(2010) Bacterial communities of two ubiquitous Great Barrier Reef corals reveals both site and species-specificity of common bacterial associates.
PLoS One 5: e10401.
Lecampionalsumard T., Golubic S., Priess K .(1995) Fungi in Corals - Symbiosis or Disease - Interaction between Polyps and Fungi Causes Pearl-Like Skeleton Biomineralization. Marine Ecology-Progress Series 117: 137-147.
Lesser M.P., Bythell J.C., Gates R.D., Johnstone R.W., Hoegh-Guldberg O. (2007) Are infectious diseases really killing corals? Alternative interpreta-tions of the experimental and ecological data. Journal of Experimental Marine Biology and Ecology 346: 36-44.
Lobban C.S., Raymundo L., Montagnes D.J.S. (2011) Porpostoma guamensis n. sp., a Philasterine Scuticociliate Associated With Brown-Band Disease of Corals. Journal of Eukaryotic Microbiology 58: 103-113.
Luna G.M., Biavasco F., Danovaro R. (2007) Bacteria associated with the rapid tissue necrosis of stony corals. Environmental Microbiology 9:1851-1857 Luna G.M., Bongiorni L., Gili C., Biavasco F., Danovaro R. (2010) Vibrio harveyi
as a causative agent of the white syndrome in tropical stony corals. Envi-ronmental Microbiology Reports 2: 120-127.
Marhaver K.L., Edwards R.A., Rohwer F. (2008) Viral communities associated with healthy and bleaching corals. Environmental Microbiology 10: 2277-2286.
Muyzer G., Smalla K. (1998) Application of denaturing gradient gel electro-phoresis (DGGE) and temperature gradient gel electroelectro-phoresis (TGGE) in microbial ecology. Antonie Van Leeuwenhoek International Journal of General and Molecular Microbiology 73: 127-141.
Oldach D.W., Delwiche C.F., Jakobsen K.S., Tengs T., Brown E.G., Kempton J.W., Schaefer E.F., Bowers H.A., Glasgow H.B., Burkholder J.M., Steiding-er K.A., Rublee P.A. (2000) HetSteiding-eroduplex mobility assay-guided sequence discovery: Elucidation of the small subunit (18S) rDNA sequences of
Pfiesteria piscicida and related dinoflagellates from complex algal culture
and environmental sample DNA pools. Proceedings of the National Acad-emy of Sciences of the United States of America 97: 4303-4308. Qiu D.J., Huang L.M., Huang H., Yang J.H., and Lin S.J. (2010) Two functionally
distinct ciliates dwelling in Acropora corals in the South China Sea near Sanya, Hainan Province, China. Applied Environmental Microbiology 76: 5639–5643.
Sanchez O., Gasol JM., Massana R., Mas J., Pedros-Alio C. (2007) Comparison of different denaturing gradient gel electrophoresis primer sets for the study of marine bacterioplankton communities. Applied and Environmen-tal Microbiology 73: 5962-5967.
Selinummi J., Seppala J., Yli-Harja O., Puhakka JA.. (2005) Software for quanti-fication of labeled bacteria from digital microscope images by automated image analysis. Biotechniques 39: 859-863.
Siboni N., Lidor M., Kramarsky-Winter E., Kushmaro A. (2007) Conditioning film and initial biofilm formation on ceramics tiles in the marine environ-ment. FEMS Microbiology Letters 274: 24-29.
Song W.B. (2000) Morphological and taxonomical studies on some marine scuticociliates from China Sea, with description of two new species,
Philasterides armatalis spn, and Cyclidium varibonneti sp n. (Protozoa: Ciliophora: Scuticociliatida). Acta Protozoologica 39: 295-322.
Sussman M., Willis B.L., Victor S., Bourne D.G. (2008) Coral Pathogens Identi-fied for white syndrome (WS) Epizootics in the Indo-Pacific. PLoS One 3 Sweet M.J., Bythell J.C. (2012) Ciliate and bacterial communities associated
with white syndrome and Brown Band Disease in reef building corals.
Environ Microbiol 14: 2184-2199.
Sweet M.J., Croquer A., Bythell J.C. (2010) Temporal and spatial patterns in waterborne bacterial communities of an island reef system. Aquatic Microbial Ecology 61: 1-11.
Sweet M.J., Jones R., Bythell J.C. (2011a) Coral diseases in aquaria and in nature. Journal of the Marine Biological Association of the United King-dom 92: 791-801.
Sweet M.J., Croquer A., Bythell J.C. (2011b) Dynamics of bacterial community development in the reef coral Acropora muricata following experimental antibiotic treatment. Coral Reefs 30: 1121-1133.
Thompson J.R., Randa M.A., Marcelino L.A., Tomita-Mitchell A., Lim E., Polz M.F. (2004) Diversity and dynamics of a north Atlantic coastal Vibrio community. Applied and Environmental Microbiology 70:4103-4110 Vincent A.C.J. (2006) Live food and non-food fisheries on coral reefs, and
their potential management. In: Cote IMRJD (ed) Coral Reef Conserva-tion, pp. 183-236
Wabnitz C., Taylor M., Green E., Razak T. (2003) From ocean to aquarium. The global trade in marine ornamental species.
Walsh P.S., Metzger D.A., Higuchi R. (1991) Chelex-100 as a medium for sim-ple extraction of DNA for PCR-based typing from rorensic material. Bio-techniques 10: 506-513.
Weinbauer M.G., Beckmann C., Hofle M.G. (1998) Utility of green fluorescent nucleic acid dyes and aluminum oxide membrane filters for rapid epifluo-rescence enumeration of soil and sediment bacteria. Applied and Envi-ronmental Microbiology 64: 5000-5003.
Willis B.L., Page C.A., Dinsdale E.A. (2004) Coral disease on the Great Barrier Reef. In: Rosenberg E., Loya Y (eds) Coral health and disease. Springer-Verlag Heidelberg pp. 69-104.
Work TM., Aeby GS (2011) Pathology of tissue loss (white syndrome) in
Acropora sp corals from the Central Pacific. Journal of Invertebrate Pa-thology 107: 127-131.
Yamaguchi N., Baba T., Nakagawa S., Saito A., Nasu M. (2007) Rapid monitor-ing of bacteria in dialysis fluids by fluorescent vital stainmonitor-ing and microcol-ony methods. Nephrology Dialysis Transplantation 22: 612-616. Yu W., Dodds W.K., Banks M.K., Skalsky J., Strauss E.A. (1995) Optimal