DEPARTMENT OF INFORMATION ENGINEERING AND COMPUTER SCIENCE ICT International Doctoral School
I
MPLICIT
H
UMAN
-
COMPUTER
I
NTERACTION
:
T
WO COMPLEMENTARY
A
PPROACHES
Julia Wache
Advisor:
Prof. Nicu Sebe
Universit`a degli Studi di Trento
Abstract
One of the main goals of Human Computer Interaction (HCI) is to improve
the interface between users and computers: interfacing should be effortless and
easy to learn. In this thesis, we pursue this goal, aiming to reduce the stress of
users and increase their wellbeing. We work on two different but complementary
approaches: (i) Automatic assessment of users inner psychological state, so as
to enhance computer-human interaction; and (ii) Information presentation in a
comprehensive manner, with no stress added by devices and applications when
delivering information. Not only computers should understand their users, but
also users should easily understand the information given by computers. For
the first approach we collected physiological and psychological data from
peo-ple exposed to emotional stimuli. We created a database, and made it freely
available to the community, for further use in research on automated detection
of the differences in the inner states of users. We employed the data for
pre-dicting both the emotional state of users and their personality traits. For the
second approach, we investigated two devices that intend to provide
compre-hensible feedback easily. First we discuss how to utilize a breathing sensor that
informs its users on their current physiological state and on how to decrease the
stress in daily life by adapting their breathing patterns. Here we investigated
general criteria on how to develop systems that are easily understandable. The
second device was a tactile belt. We analyze the belt as a solution that provides
comprehensive guidance information in navigation contexts, and that does not
require cognitive effort. The belt uses localized tactile stimulation to transmit
directional information. By employing the tactile sense it can augment or even
replace the information normally received through eyes and ears. Finally, we
discuss opportunities for future applications of our research, and conclude with
a summary of our contributions to HCI: transmitting information from humans
tactile signals, navigation
Acknowledgements
When I was thinking about a PhD position four years ago, I was not
immedi-ately considering Computer Science as my background is in Cognitive Science.
The direction my PhD would take was not very clear in the first year. Luckily,
I found my advisor Prof. Nicu Sebe. I am very grateful for his guidance and
constant support during my adventurous PhD journey. Thanks for introducing
me to my dear colleague Mojtaba Khomami Abadi, who taught me most of the
technical knowledge I acquired and was always ready to help and support me.
Also thanks to my other colleagues that worked with me, especially Ramanathan
Subramanian.
I thank the European Institute of Innovation & Technology that I could be
part of the EIT programme where I learned a lot of additional entrepreneurial
skills that researchers often don’t get the chance to learn. Transferring research
results into useful applications for daily life became my goal for both my PhD
and my future life, at the latest after successfully participating in the student
competition in Virginia Tech.
I thank Neema Moraveji from Spire, for inviting me to San Francisco and
giving me the exciting inside into a startup.
I am especially happy that I got the opportunity to do a further internship
at the startup feelSpace. Special thanks for the great collaboration to Silke,
Jessika and Susan who welcomed me to the feelSpace family and wait for me to
come back and join their venture.
Trento would not have been the great experience it was without the
peo-ple that made me feel home. First of all, I want to thank Marcos, who always
was there for me and made these years special. Also a great impact had my
flatmates, the Costanzi family, with the current, former and extended members,
Marco, Francisco, Marijo, Cristhian and of course Ruzanna. They were always
one of them (and they are the reason I learned more Spanish than Italian here).
I also thank all my other friends who supported me throughout the journey.
Last but not least I want to thank my family. Thanks for the loving support
of my parents who taught me to see the world with amazement and planted the
seed of the curiosity that keeps me wanting to learn more about the wonders of
life and nature. Finally, am very grateful to have my sister Susan who always
knows the right thing to say and do to me feel good.
1 Introduction 1
1.1 Research approaches . . . 2
1.1.1 Technology understanding humans . . . 2
1.1.2 Humans understanding technology . . . 3
1.2 Research methodologies . . . 4
1.3 Outline of the thesis . . . 5
2 ASCERTAIN: A Multimodal Affective Database for Personality As-sessment 9 2.1 Introduction . . . 10
2.2 Related Work . . . 13
2.2.1 Emotion Theories . . . 14
2.2.2 Physiological responses . . . 14
2.2.3 Multimodal affect recognition . . . 15
2.2.4 Personality recognition . . . 16
2.2.5 Personality-Affect relationship . . . 17
2.2.6 Spotting the research gap . . . 18
2.3 ASCERTAIN Overview . . . 19
2.3.1 Materials and Methods . . . 20
2.3.2 Physiological feature extraction . . . 23
2.3.3 Data Quality . . . 25
2.4 Descriptive Statistics . . . 26
2.4.1 Analysis of Self-ratings . . . 26
2.4.2 Correlating Affective Ratings and Personality Scales . . 28
2.4.3 Mutual Information Analysis . . . 31
2.5 Personality measures vs user ratings . . . 33
2.5.1 H1: Extraversion vs Arousal and Valence . . . 34
2.5.2 H2: Neuroticism vs Arousal . . . 34
2.5.3 H3: Neuroticism vs Valence . . . 35
2.5.4 H4: Openness vs Valence and Arousal . . . 35
2.5.5 Agreeableness and Conscientiousness . . . 36
2.6 Physiological correlates of emotion and personality . . . 36
2.6.1 Linear correlates of Emotion and Personality . . . 37
2.6.2 Non-linear correlates . . . 39
2.7 Recognition results . . . 40
2.7.1 Emotion recognition . . . 40
2.7.2 Personality recognition . . . 42
2.8 Discussion . . . 44
2.9 Conclusion . . . 47
3 Inference of Personality Traits and Affect Schedule by Analysis of Spontaneous Reactions to Affective Videos 49 3.1 Introduction . . . 50
3.2 Related Works . . . 51
3.2.1 Measuring Emotion . . . 52
3.2.2 Personality Assessment . . . 53
3.3 Experimental Protocol and Rating Analysis . . . 54
3.3.1 Used stimuli and experimental protocol . . . 54
3.3.2 Personality and PANAS evaluation . . . 57
3.3.3 Affective Rating Analysis . . . 58
3.4 Data Analysis . . . 61
3.4.3 Facial Video Analysis . . . 63
3.4.4 Mutual Information Analysis . . . 65
3.5 Experimental Setup and Results . . . 66
3.5.1 Personality/PANAS recognition . . . 66
3.5.2 Discussion on the Results . . . 68
3.5.3 Chosen videos during the predictions . . . 70
3.6 Conclusion . . . 71
4 Respiration as indicator of physiological states 73 4.1 Breathing and its connection to stress . . . 73
4.2 Controlled Breathing and Physiological Effects . . . 74
4.3 Study . . . 76
4.3.1 Hypotheses . . . 76
4.3.2 Participant selection . . . 77
4.3.3 Sensor . . . 77
4.3.4 App . . . 77
4.3.5 Procedure . . . 78
4.3.6 Data collection . . . 79
4.3.7 Results . . . 79
4.3.8 Discussion . . . 80
4.4 Development of Spire . . . 81
4.4.1 Design heuristics . . . 82
4.4.2 App development . . . 83
4.4.3 Final Sensor . . . 85
4.5 Conclusion . . . 86
5 Tactile guidance in navigation 89 5.1 Introduction . . . 90
5.2 Background . . . 92
5.2.1 Multiple Resource Theory . . . 93
5.2.2 Sensory substitution and augmentation . . . 94
5.2.3 Navigation devices for the blind . . . 96
5.2.4 Tactile devices . . . 98
5.3 Tactile belts . . . 99
5.3.1 Tactile belts for navigation . . . 103
5.3.2 Navigation belts for the blind . . . 104
5.3.3 Navigation belts for the elderly . . . 105
5.3.4 Other use cases . . . 106
5.4 Tactile direction display . . . 106
5.4.1 Location of tactile stimulation . . . 107
5.4.2 Accuracy of perceiving directions . . . 108
5.4.3 Mental load . . . 111
5.4.4 Experiment 1: Turning accuracy . . . 113
5.4.5 Experiment 2: Mental load . . . 114
5.4.6 Hypotheses . . . 115
5.5 Methodology . . . 116
5.5.1 Participants . . . 116
5.5.2 Procedure . . . 117
5.5.3 Experiment 1: Turning task . . . 117
5.5.4 Experiment 2: Mental task . . . 118
5.5.5 Qualitative scores . . . 119
5.6 Data analysis and results . . . 119
5.6.1 Display modes . . . 121
5.6.2 Effects of the turning task on mental performance . . . . 121
5.6.3 Effects of the mental task on the turning performance . . 123
5.6.4 Qualitative data . . . 123
5.7 Discussion . . . 124
5.8 Conclusion and outlook . . . 127
6 Summary and conclusion 129 6.1 Summary . . . 129
6.2 Putting research into practice . . . 131
6.2.1 Emotion and Personality recognition . . . 131
6.2.2 Breathing sensor . . . 132
6.2.3 The tactile belt . . . 133
6.2.4 Combining both approaches . . . 134
6.3 Contributions . . . 135
6.3.1 Technology understanding humans . . . 135
6.3.2 Humans understanding technology . . . 136
6.4 Limitations and Future Work . . . 138
6.4.1 Emotion and personality recognition . . . 138
6.4.2 Breathing sensor . . . 139
6.4.3 Tactile belt . . . 139
Bibliography 141
Introduction
In the past decades new technologies became a constant and important part of
human life being used in many areas of interest. The typical life and work style
of people have changed resulting in people spending more time interacting with
computers and other smart devices. To facilitate the experience and improve
the interaction with users, Human Computer Interaction (HCI) research aims
constantly at improving the interaction processes with new technologies.
Unlike those of computers, not all actions of humans are predictable or
fol-low logical rules; in fact one important factor of human behavior is emotion.
External cues from the environment as well as internal states induce emotions
that can have a substantial influence on the peoples experience and subsequent
actions. The information a computer system has on the assumed emotional
sta-tus of a user is mostly limited. Therefore, it is useful for a system to learn
from interactions with users and their behavior about their inner state and
cur-rent emotions. If the system is able to detect and understand human emotions
without forcing the user to explicitly name his or her emotions (e.g. by
pro-viding written feedback), the system can adapt then the consequent interactions
accordingly.
This chapter presents the outline of the approach and methods of the research
conducted throughout this thesis.
1.1. RESEARCH APPROACHES
1.1
Research approaches
To enhance interactions between users and their computers two different aspects
are important: (1) enable computers to assess user’s differences automatically to
improve the understanding of their current inner state and (2) make technology
provide information in an easy accessible way that avoids stress and cognitive
overload of users.
1.1.1 Technology understanding humans
One important factor influencing human behavior is emotion. Emotions are
psychological phenomena but they also have an impact on physiological
sig-nals that can be measured and analyzed (e.g. [142]). Physiological changes are
induced by the Limbic System, the part of the brain controlling the autonomic
nervous system. The Limbic System is involved in emotional experience and
sensory input processing [72]. Hence, the current emotional state may influence
the perception of a situation and the corresponding behavioral actions of
peo-ple [134, 172]. Also further internal factors, such as personality, can have an
impact. Therefore one challenge for contemporary HCI systems is the ability
to understand the influence that factors like the personality traits or the
environ-ment have on the emotional state of a user and to use this information to predict
consequential behavioral actions. For example, in an e-learning scenario the
computer might adapt the shown content depending on how easy (boring) or
difficult (stressing) it is perceived by the user.
To investigate emotional states and what influences them, emotional videos
are preferably used because multimedia contents such as movies intend to
in-duce certain emotions in viewers to create a specific experience [176]. One way
to understand the current emotional state of users while watching emotional
stimuli is to interrupt the users and directly ask them for an evaluation. Newer
methods avoid interrupting the user. Instead they measure users’ implicit
tions in emotional situations and extract the affective state from the collected
data. One method is to record physiological responses and facial expressions
during exposure to emotional content [149, 89]. In this way we intend to solve
the first problem - automated emotion and personality recognition.
Successful applications could cover the area of computer games or learning
platforms where the user experience can be enhanced significantly when the
system decreases the stress level, hence, the negative emotions. These
applica-tions should avoid frustration and should increase their success by adapting the
speed and the difficulty of the tasks according to the users performance.
1.1.2 Humans understanding technology
The other side of an effective communication between humans and their
techno-logical devices is the ability to provide information in an easily understandable
way making the processing of data effortless for the users. In a world of
increas-ing information overload, people are often overwhelmed by the huge amount of
data to be processed. Most input is usually received over the visual and
audi-tory channels. In daily life people continuously encounter an endless stream
of sounds and images which can lead to cognitive overload resulting in less
ef-fective performance in current tasks [182]. To relieve the visual and auditory
senses, a further sense that can be employed for information input is the tactile
sense. The sense of touch is suitable to transmit simple information in a
dis-crete way, e.g. a mobile phone that vibrates to transmit information to its owner
without attracting attention from other people close by.
We analyze a tactile alternative to common output devices (visual displays,
loudspeakers, earphones) to provide precise information during navigational
tasks. As a direct application outside of the lab, tactile belts can, in
combi-nation with a smartphone, be used for navigation in unknown environments.
Current navigation aids are mostly based on audio or visual instructions.
Nor-mally navigating in a new environment requires eyes and ears to be focused on
1.2. RESEARCH METHODOLOGIES
the surroundings, e.g. in a urban area pedestrians need to attend to traffic and
evade obstacles or other people. The usage of tactile signals elegantly
circum-navigates an overload of the visual and auditory sensory modalities as it uses
the tactile sense to provide information. This can enhance the effective
naviga-tion for people requiring special assistance such as visually impaired or elderly
people, but it can also improve navigation experience for people engaged in
ac-tivities that require their hands (cyclists) or their eyes and ears to be free for
other tasks, for example athletes or tourists. In summary, tactile devices can be
applied in real world applications to facilitate information reception and
under-standing.
1.2
Research methodologies
When interacting with intelligent systems an important aspect is to take the
contextual situation of the user into account. Therefore, adapting the interaction
possibilities between computer and user according to the users mental state can
facilitate understanding between humans and machines.
In order to reach the goal of automated response to emotional states, the
emotions need to be detected first. Emotions are psychological phenomena but
they also have physiological concomitants that can be measured and analyzed
(e.g. [148]). The challenge is to accurately detect physiological changes caused
by affective responses and understand the dependencies between physiological
signals, the emotions and the personality of users.
To analyze the physiological reactions we need to induce similar emotions in
many people. This is exactly what multimedia contents such as movies intend to
do. They evoke certain emotions in viewers to create an enjoyable experience.
In fact, often the emotional experience stimulated is the aspect people value
when watching a movie [9].
Important aspects of the mental state are current emotions and personality
traits. Emotions are correlated to implicit responses [105] but it is yet to
investi-gate in more depth how personality affects this relationship. Additionally, there
is an increasing need of easy information transfer from machines to humans to
avoid information overload. To achieve these goals we work on the following
problems:
1. We need to automatically detect the mental state of users such as
emo-tions and personality in order to improve interacemo-tions with intelligent systems.
Therefore, we correlate physiological signals to emotions and personality traits
and try predicting both, emotional states and personality traits, from those
sig-nals to understand how the goal of automated detection of inner states can be
achieved best.
2. The second problem is to find a good way to communicate information
to users and make it easily understandable. Information need to be transmitted
in a complex context even when eyes and ears are already occupied by other
tasks that require attention. We investigate whether tactile signals can
over-come limitations of attention and be used to transmit information intuitively.
We investigate how a tactile device in form of a belt can be best used to
dis-play information for navigation purposes and whether we can create an easy
understanding of directional indications to reduce the required mental effort in
orientation.
In the end we discuss how knowledge about the mental state and the
sonality of a user can be utilized by a system to provide information in a
per-sonalized way adapted to individual needs. We review how the results could be
applied to future applications.
1.3
Outline of the thesis
Our general goal is to improve the intuitiveness of new technological
devel-opments to make the interaction with them easier and more effective. There
1.3. OUTLINE OF THE THESIS
are two complementary approaches that we address. To investigate the
prob-lems mentioned in the last section we developed and applied two main lines
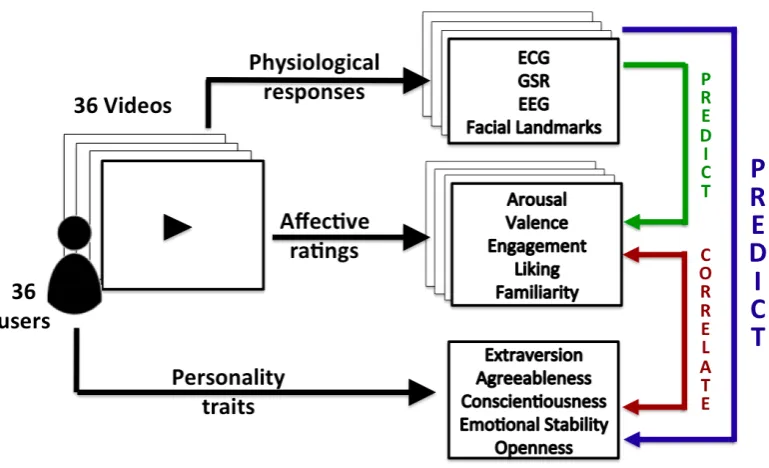
of investigation. In Figure 1.1 we show a schematic overview of the thesis.
We highlight the two directions of communications in HCI with two different
colors. For each flow of information we indicate the sender, the type of
infor-mation provided, the supporting device (in grey), and the outcome that reaches
the receiver. In more detail we did the following:
Figure 1.1: This schema provides an overview about this thesis. The first part focuses on the transfer of Information from Human to Computer, while the second part concentrates on the transfer of information from technology to humans.
In the next two chapters we aim at better understanding the user.
There-fore, we investigate how to predict the inner mental state automatically, without
users’ having to actively provide information themselves, by measuring implicit
signals. We then use those to predict both, the affective state and the personality
traits.
We employ facial expressions and physiological signals, implicit signals, as
they are mostly unconscious and difficult to influence. Therefore, we use
sen-sors measuring their physiological changes while subjects watch multimedia
content that elicits different emotions. With pattern recognition and machine
learning approaches we then work on predicting emotions as well as personality
traits from the collected measurements. We conduct two main experiments
ex-plained in chapter 2 and 3 where we collect physiological data, train classifiers
to predict both, their affective reactions to emotional stimuli and personality
traits, and use correlation methods to understand their connections. Both
chap-ters are based on papers we published at respected conferences [1, 174]. From
the study in chapter 2 we additionally prepared a dataset that is under review to
be published for the community [173].
In the next project, we investigate how breathing can be used as an indicator
for physiological states such as stress (chapter 4). We work on developing a
sensor able to measure breath rates and an smartphone application to provide
useful feedback. We evaluate how it can be used as calming technology to
effectively reduce stress in users.
Finally we work on a use case investigating how to provide relevant
infor-mation to the users in an easily comprehensible way. For this scenario we
de-veloped a tactile belt as a navigation device. It provides feedback via a tactile
display to indicate directions. In chapter 5 we review the benefits of using tactile
signals and the advantages of the tactile belt as navigation device, in particular
for more challenged users such as the visually impaired. We investigate the
form of tactile feedback necessary to optimize understanding of the tactile
sig-nal. We perform a study to validate the prototype of the tactile belt and detect
differences in navigation performance for two different versions of displaying
directional information. Further we investigate performance changes of subjects
when under cognitive load.
1.3. OUTLINE OF THE THESIS
In the last chapter (chapter 6) we discuss the results of our research and put
them in the context of possible applications. We conclude by summarizing our
contributions and pointing out the limitations of our research.
ASCERTAIN: A Multimodal Affective
Database for Personality Assessment
We present ASCERTAIN1 – a multimodal databaASe for impliCit pERsonaliTy
and Affect recognitIoNusing commercial physiological sensors. To our
knowl-edge, ASCERTAIN is the first database to connect personality traits and
emo-tional states via physiological responses. ASCERTAIN contains big-five
person-ality scales and emotional self-ratings of 36 users along with their
Electroen-cephalogram (EEG), Electrocardiogram (ECG), Galvanic Skin Response (GSR)
and facial activity data, recorded using commercially available sensors while
viewing affective movie clips. We first examine relationships between users’
affective ratings and personality scales in the context of prior observations,
and then study linear and non-linear physiological correlates of emotion and
personality. Our analysis suggests that the emotion–personality relationship is
better captured by non-linear rather than linear statistics. We finally attempt
bi-nary emotion and personality trait recognition using physiological features.
Ex-1This chapter is mainly based on the following two papers: 1. Julia Wache, Ramanathan Subramanian, Mojtaba
Khomami Abadi, Radu-Laurentiu Vieriu, Nicu Sebe, and Stefan Winkler. Implicit User- centric Personality
Recog-nition Based on Physiological Responses to Emotional Videos. In Proceedings of the 2015 ACM on International Conference on Multimodal Interaction, pages 239-246, 2015 [174]. 2. Julia Wache, Ramanathan Subramanian,
Mojtaba Khomami Abadi, Radu-Laurentiu Vieriu, Nicu Sebe, and Stefan Winkler. ASCERTAIN: A Multimodal
Affective Database for Personality Assessment. Submitted to IEEE Transactions on Affective Computing (TAC) [173].
2.1. INTRODUCTION
perimental results cumulatively confirm that personality differences are better
revealed while comparing user responses to emotionally homogeneous videos,
and above-chance recognition is achieved for both affective and personality
di-mensions.
2.1
Introduction
Despite rapid advances in Human-computer Interaction (HCI) and continuous
effort to improve user experience with computer systems, the need for systems
torecognizeandadapt to theaffective state of users has been widely
acknowl-edged. While affect is an important component influencing human behavior,
nevertheless it a highly subjective phenomenon that is influenced by contextual
and psychological factors including personality.
The personality–affect relationship has been actively studied ever since a
correlation between the two was proposed in Eysenck’s personality model [52].
Eysenck supposed that Extraversion, the personality dimension that describes a
person as either talkative or reserved, is accompanied by low cortical arousal,
i.e., extraverts require more external stimulation than introverts. His model also
proposed that neurotics, characterized by negative feelings such as anxiety, are
more sensitive to external stimulation and become easily upset or nervous due
to minor stressors.
Many affective studies have attempted to validate and extend Eyesenk’s
find-ings. Some have used explicit user feedback in the form of affective
self-ratings [127, 85], while others have measured physiological signals to acquire
implicit user responses such as Electroencephalogram (EEG) activity [154] and
heart rate [44]. However, few works have investigated affective correlates of
traits other than Extraversion and Neuroticism. Social psychology studies have
examined personality mainly via non-verbal social behavioral cues (see [171]
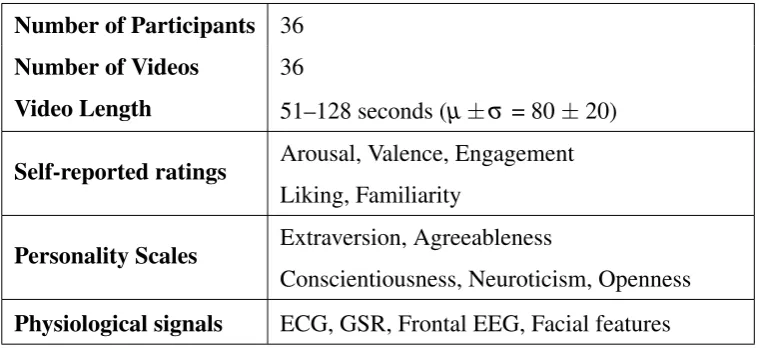
Table 2.1: Summary of the ASCERTAIN database. Number of Participants 36
Number of Videos 36
Video Length 51–128 seconds (µ±σ = 80±20)
Self-reported ratings Arousal, Valence, Engagement Liking, Familiarity
Personality Scales Extraversion, Agreeableness
Conscientiousness, Neuroticism, Openness Physiological signals ECG, GSR, Frontal EEG, Facial features
for a review), but few works have modeled personality traits based on emotional
behavior.
To facilitate research on emotion recognition from physiological signals
re-searchers need large datasets comprising physiological and emotional data from
many subjects, but due to high cost of time, equipment and interdisciplinary
knowledge necessary to compile such datasets, there is only a limited number
available [149] and no currently published data set includes personality data.
We created the dataset ASCERTAIN2 which contains measures of
Elec-trocardiogram (ECG), Galvanic skin response (GSR), facial expressions and
Electroencephalography (EEG) in response to 36 affective video stimuli. This
work includes the first publicly available dataset that also includes personality
scores. It builds on [174] and examines the influence of personality differences
on users’ affective states. Hence, we investigate whether affective
physiologi-cal responses are indicative of users’ personality traits. ASCERTAIN contains
personality scores and emotional self-ratings of 36 users in addition to their
affective physiological responses (overview of the dataset in Table 2.1).
We utilize ASCERTAIN to (i) understand the relation betweenemotional
at-tributesandpersonality traits, and (ii) characterize both via users’ physiological
2Available at: http://mhug.disi.unitn.it/index.php/datasets/ascertain/
2.1. INTRODUCTION
responses.
We specifically designed a movie-based study as movie scenes effectively
evoke emotions [68, 1], and movie genres such as thriller, comedy or horror
are explicitly defined by the emotions they evoke. Also, different from existing
affective databases, ASCERTAIN comprises data recorded exclusively using
commercial sensors to ensure ecological validity and scalability of our
frame-work for profiling applications.
From the ASCERTAIN data, we first examine correlations among users’
va-lence (V) and arousal (A) self-ratings and their personality dimensions. We
then attempt to isolate physiological correlates of emotion and personality. Our
analyses suggest that the relationships between emotional states and personality
traits are better captured by non-linear rather than linear statistics. Finally, we
present single-trial (binary) recognition of A,V and the big-five traits
consider-ing physiological responses observed over (a)all, and (b)emotionally
homoge-neous (e.g, high A, high V) clips. Superior personality recognition is achieved
for (b), implying that personality differences are better revealed on comparing
responses to emotionally similar stimuli. The salient aspects of ASCERTAIN
are:
1. To our knowledge, ASCERTAIN is the first physiological database that
fa-cilitates both emotion and personality recognition. In social psychology,
personality traits are commonly modeled via questionnaires or social
be-havioral cues. Instead, this is one of the first works to assess personality
traits via affective physiological responses (the only other work similar to
ours is [1]).
2. Different from popular recent affective computing databases such as the
DEAP [89], MAHNOB [149] and DECAF [3] databases, we use
wear-able, off-the-shelf sensors for physiological recordings. This enhances
recognition of emotion and personality confirms its utility and promise for
commercial applications.
3. We present interesting insights concerning correlations among affective
and personality attributes. Our analyses suggest that the emotion–personality
relationship is better captured via non-linear statistics. Also, personality
differences are better revealed on comparing user responses to
emotion-ally similar videos (or more generemotion-ally, under similar affect inducement).
The chapter is organized as follows– Section 2.2 reviews related literature
to motivate the need for ASCERTAIN, while Section 2.3 explains the
materi-als and methods employed for data compilation. Section 2.4 presents
descrip-tive statistics, while correlations among users’ affecdescrip-tive ratings and
personal-ity dimensions are analyzed in Section 2.5. Section 2.6 details physiological
correlates of emotion and personality, while Section 2.7 presents recognition
experiments. Section 2.8 discusses the correlation and recognition results, and
Section 2.9 concludes the chapter with key observations.
2.2
Related Work
This section reviews related work focusing on (a) multimodal affect recognition,
(b) personality assessment and (c) the personality–affect relationship.
Emotions are an important factor in human life. Any behaviour and
envi-ronmental stimulus may cause these psychological effects in us and influences
our interpretation of the environment and our consequent behaviour. Emotional
intelligence, the capability to recognize and understand affective states of the
person we are communicating with, is of great importance for our success in
so-cial interaction and therefore in life in general. The capability of understanding
emotions that comes naturally to most people is very difficult to implement in
2.2. RELATED WORK
an increasingly interesting topic in research. So far many studies investigated
how emotions are induced through speech and several algorithms were
devel-oped to analyse emotional content in speech [48] and were integrated in speech
recognition systems e.g. in robots [137]. Also the use of images to induce
emo-tions has been widely studied [143] and research investigating the emotional
responses to videos are steadily increasing.
2.2.1 Emotion Theories
In order to understand the phenomenon of feelings, emotion theories have been
developed to build hypotheses and run experiments. Mainly two concepts are
used today. One classifies emotions in six distinct universal groups [47]:
hap-piness, sadness, anger, fear, surprise and disgust. Each of these basic emotions
has a unique facial expression that can be easily detected [53]. For continuous
measurements it is more common to use the dimensional concept of emotion.
Already in the late 19th century Wundt [185] proposed that emotions could be
classified along three dimensions: pleasure, arousal and dominance. To assess
the emotions evoked by different stimuli often a technique based on the model
of Russell is used [141]. Using this, subjects have to generate 18 ratings for
bipolar adjective pairs (e.g. bored-relaxed). To save time and effort the subjects
can directly rate arousal (calm-excited) and the valence (unpleasant-pleasant)
leading to the same results [21] which can be displayed on a two-dimensional
plane with the two axes valence (miserable-pleased) and arousal
(sleepiness-aroused).
2.2.2 Physiological responses
To capture stress and emotions some studies have been done with multi-modal
emotion recognition systems using facial expressions [145]. Even if facial
and are therefore not completely reliable. Additionally, the face mainly
dis-plays the conscious aspect of an emotion. Physiological reactions caused by
the peripheral nervous system are unconscious and cannot easily be controlled
willingly. Signals that effectively encode emotions are for example:
Electro-cardiogram (ECG) measuring the heart activity, Electroencephalogram (EEG)
measuring the electrical activity of the brain through the scalp, and galvanic
skin conductance (GSR) measuring the electrical conductance of the skin [96].
Lisetti and Nasoz [105] review the technologies for capturing physiological
sig-nals that are associated with emotions using wearable devices. They use GSR,
heart rate and temperature to predict emotions with different algorithms.
2.2.3 Multimodal affect recognition
As emotions are conveyed by content creators using multiple means (audio,
video), and expressed by humans in a number of ways (facial expressions,
speech and physiological responses), many affect recognition (AR) methods
employ a multimodal framework. Common content-based modalities employed
for AR include audio [14, 15, 98], visual [109, 191, 132] and audio-visual
[30, 60, 144]. Recent AR methodologies have focused on monitoring user
be-havior via the use of physiological sensors (see [177] for a review). Emotions
induced by music clips are recognized via heart rate, muscle movements, skin
conductivity and respiration changes in [86]. Lisetti and Nasoz [105] use GSR,
heart rate and temperature signals to recognize emotional states. As part of the
HUMAINE project [46], three naturalistic and six induced affective databases
containing multimodal data (including physiological signals) are compiled from
8–125 participants.
Koelstraet al.[91] analyze blood volume pressure, respiration rate, skin
tem-perature and Electrooculogram (EOG) patterns for recognizing emotional states
induced by 40 music videos. MAHNOB-HCI [149] is a multimodal database
record-2.2. RELATED WORK
ings from 27 users. Abadiet al.[1] study Magnetoencephalogram (MEG),
Elec-tromyogram (EMG), EOG and ECG responses from users for music and movie
clips, and conclude that better emotion elicitation and AR are achieved with
movie clips.
2.2.4 Personality recognition
The big-five or five-factor model [40] describes human personality in terms of
five dimensions– Extraversion (sociablevsreserved), Neuroticism or the degree
of emotional stability (nervousvsconfident), Agreeableness (compassionatevs
dispassionate), Conscientiousness (dutiful vs easy-going) and Openness (
curi-ous/creative vscautious/conservative).
A comprehensive survey of personality computing approaches is presented
in [171]. The traditional means to model personality traits are questionnaires
or self-reports. Argamon et al. [7] use lexical cues from informal texts for
recognizing Extraversion (Ex) and Neuroticism (Neu). Olguin et al. [129] and
Pinedaet al.[5] show that non-verbal behavioral measures acquired using a
so-ciometric badge such as the amount of speech and physical activity, number of
face-to-face interactions and physical proximity to other objects is highly
cor-related with personality. Much work has since employed non-verbal behavioral
cues in social settings for personality recognition including [100], where Ex
is recognized using speech and social attention cues in round-table meetings,
while [159, 192] predict Exand Neufrom proxemic and attention cues in party
settings.
Among works that have attempted recognition of all five personality
fac-tors, Mairesse et al. [112] use acoustic and lexical features, while Staiano et
al. [153] analyze structural features of individuals’ social networks.
Srivas-tavaet al.[152] automatically complete personality questionnaires for 50 movie
characters utilizing lexical, audio and visual behavioral cues. Brouweret al.[22]
sub-consciously and more genuinely (less prone to manipulation) than questionnaire
answers. In a gaming-based study, they observe a negative correlation between
(i) heart rate andEx, and (ii) skin-conductance andNeu.
2.2.5 Personality-Affect relationship
The relationship between personality and affect has been extensively examined
in social psychology [183], but not in a computational setting. Eysenck’s
sem-inal personality theory [52] posits that extraverts require more external
stimu-lation than introverts, and that neurotics are aroused more easily. Many studies
have since studied the personality–affect relationship by examining explicit or
implicit user responses. Personality effects on brain activation related to valence
(V) and arousal (A) is investigated in [85], which concludes that Neucorrelates
negatively with positive V, and positively with A. In an EEG-based study [154],
a negative correlation is observed between Ex and A, while a positive
correla-tion is noted between Neuand A especially for negative valence stimuli.
The impact of personality traits on affective user ratings is studied using path
analysis in [163]. Feedback scores from 133 students are analyzed in [127] to
conclude that neurotics experience positive emotions similar to emotionally
sta-ble counterparts in pleasant situations, even though they may experience
nega-tive emotions more strongly. Event-related potentials and heart rate changes are
studied in [44] to confirm a positive correlation betweenNeuand A for negative
stimuli, while a signal-detection task is used in [70] to suggest that extraverts
are generally less aroused than introverts. Brumbaugh et al. [27] examine
cor-relations among the big-five traits, and find Ex and Neu to be associated with
increased A while viewing negative videos. Abadi et al.[3] attempt recognition
of the big-five traits from affective physiological responses, and our work is
most similar to theirs in this respect. Nevertheless, we consider user responses
to a larger stimulus set in this work (36 clips vs 16 in [3]), and show superior
emotion-2.2. RELATED WORK
ally homogeneous clips.
2.2.6 Spotting the research gap
Examination of related literature reveals that AR methodologies are
increas-ingly becoming user-centric instead of content-centric, suggesting that
emo-tions better manifest via human behavioral cues rather than multimedia
content-based (typically audio, visual and speech-content-based) cues. Nevertheless, the
influ-ence of psychological factors such as personality on emotional behavior has
hardly been examined, in spite of prior work suggesting that personality affects
one’s (i) feelings [183, 104], (ii) emotional perception [85, 154] and (iii)
multi-media preferences [93, 146].
Motivated by the above findings and the lack of publicly available data sets
positioned at the intersection of personality and affect, we introduce
ASCER-TAIN, a multimodal corpus containing physiological recordings of users
view-ing emotional videos. ASCERTAIN allows for inferrview-ing both personality traits
and emotional states from physiological signals. We record GSR, EEG, ECG
signals using wearable sensors, and facial landmark trajectories (EMO) using
a web-camera. In the light of recent technological developments, these signals
can be acquired and analyzed instantaneously. Also, Wang and Ji [177]
advo-cate the need for less intrusive sensors to elicit natural emotional behavior from
users. Use of wearable sensors is critical to ensure the ecological validity,
re-peatability and scalability of affective computing studies, which are typically
conducted in controlled lab conditions and with small user groups.
Table 2.2 presents an overview of publicly available user-centric AR datasets.
Closest to ASCERTAIN is the dataset of Abadi et al. [3], in which the authors
use both movie and music clips to elicit emotions. In contrast, we record our
signals using affordable sensors and provide personality annotations in addition
to emotional responses. Apart from being one of the largest datasets in terms
Table 2.2: Comparison of user-centered affective databases. We point out the number of sub-jects (N), the number of stimuli, the type of recorded signals and the annotations collected. ’var’ denotes variable.
Name N Stimuli Recorded signals Annotations Comments Affect Personality
HUMAINE [46]
var var audio, visual, physi-ological
yes no includes 6 sub-collections (some non-public)
DEAP [89] 32 40 physiological yes no focus on music videos
DECAF [3] 30 76 face, physiological yes no compares music and movie clips
MAHNOB-HCI [149]
27 20 face, audio, eye gaze, physiological
yes no includes video and image stimuli
ASCERTAIN 36 36 face, physiological yes yes connects emotion and per-sonality
is also the first database to facilitate the investigation of the personality–affect
relationship.
2.3
ASCERTAIN Overview
Figure 2.1 presents an overview of the ASCERTAIN framework and a summary
of the compiled data is provided in Table 2.1. To study the personality–affect
relationship, we recorded users’ physiological responses as they viewed the
af-fective movie clips used in [2]. Additionally, their explicit feedback, in the form
of arousal, valence, liking, engagement and familiarity ratings, were obtained
on viewing each clip. Finally, personality measures for the big-five dimensions
were also compiled using a big-five marker scale (BFMS) questionnaire [133].
We now describe (1) the procedure adopted to compile users’ emotional
rat-ings, personality measures and physiological responses, and (2) the
2.3. ASCERTAIN OVERVIEW
Figure 2.1: ASCERTAIN study overview.
2.3.1 Materials and Methods
Subjects: 36 university students (12 female, mean age = 29.2) from various
countries participated in the study. All subjects were fluent in English and were
habitual Hollywood movie watchers.
Materials: One PC with two monitors was used for the experiment. One
monitor was used for video clip presentation at 1024×768 pixel resolution
with 60 Hz screen refresh rate, and was placed roughly one meter before the
user. The other monitor allowed the experimenter to verify the recorded sensor
data. Following informed consent, physiological sensors were positioned on
the user’s body as shown in Figure 2.2(a). The GSR sensor was tied to the left
wrist, and two electrodes were fixed to the index and middle finger phalanges.
Two measuring electrodes for ECG were placed at each arm crook, with the
was placed on the head like a normal headset, with the EEG sensor touching the
forehead and the reference electrode clipped to the left ear. EEG data samples
were logged using theLucid Scribe software, and all sensor data were recorded
via bluetooth. A webcam was used to record facial activity. Synchronized data
recording and pre-processing were performed using MATLAB Psychtoolbox3.
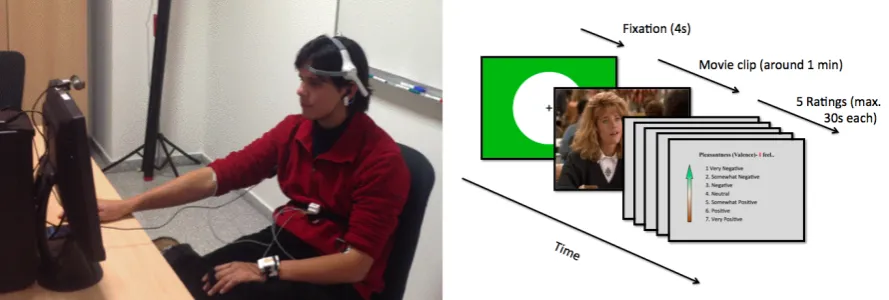
Figure 2.2: Participant with sensors (EEG, ECG and GSR visible) during the experiment (left) and timeline for each trial (right).
Protocol: Each user performed the experiment in a session lasting about 90
minutes. Viewing of each movie clip is denoted as a trial. After two practice
trials involving clips that were not part of the actual study, users watched movie
clips randomly shown in two blocks of 18 trials, with a short break in-between
to avoid fatigue. In each trial (Figure 2.2b), a fixation cross was displayed for
four seconds followed by clip presentation. On viewing each clip, users
self-reported their emotional state in the form of affective ratings within a time limit
of 30 seconds. They also completed a personality questionnaire after the
exper-iment.
Stimuli: We adopted the 36 movie clips used in [2] for our study. These clips
are between 51–127 sec long (µ =80, σ =20), and are shown to be uniformly
distributed (9 clips per quadrant) over the arousal-valence (AV) plane.
2.3. ASCERTAIN OVERVIEW
Affective ratings: For each movie clip, we compiled valence (V) and arousal
(A) ratings reflecting the user’s affective impression. A 7-point scale was used
with a -3 (very negative) to 3 (very positive) scale for V, and a 0 (very boring) to
6 (very exciting) scale for A. Likewise, ratings concerning engagement (Did not
pay attention – Totally attentive), liking (I hated it – I loved it) and familiarity
(Never seen it before – Remember it very well) were also acquired. Mean user
V,A ratings for the 36 clips are plotted in Figure 2.3(b), and are color-coded
based on the ground-truth ratings from [2]. Ratings form a ’C’-shape in the AV
plane, consistent with prior affective studies [89, 2].
Personality scores: Participants also completed the big-five marker scale (BFMS)
questionnaire [133] which has been used in many personality recognition works [192,
100, 159]. Scale distributions for the big-five traits are shown in Figure 2.3(b).
(a) (b)
2.3.2 Physiological feature extraction
We extracted physiological features corresponding to each trial over the final
50 seconds of stimulus presentation, owing to two reasons: (1) The clips used
in [3] are not emotionally homogeneous, but are more emotional towards the
end. (2) Some employed features (see Table 2.3) are nonlinear functions of
the input signal length, and fixed time-intervals needed to be considered as the
movie clips were of varying lengths. Descriptions of the physiological signals
examined in this work are as follows.
Table 2.3: Extracted features for each modality (feature dimension stated in parenthesis). Statis-ticsdenote mean, standard deviation (std), skewness, kurtosis of the raw feature over time, and % of times the feature value is above/below mean±std.
Modality Extracted features
ECG (32) Ten low frequency ([0-2.4] Hz) power spectral densities (PSDs), four very slow response ([0-0.04] Hz) PSDs, IBI, HR and HRV statistics.
GSR (31) Mean skin resistance and mean of derivative, mean differential for negative values only (mean decrease rate during decay time), pro-portion of negative derivative samples, number of local minima in the GSR signal, average rising time of the GSR signal, spectral power in the [0-2.4] Hz band, zero crossing rate of skin conductance slow response ([0-0.2] Hz), zero crossing rate of skin conductance very slow response ([0-0.08] Hz), mean SCSR and SCVSR peak magnitude
Frontal EEG (88)
Average of first derivative, proportion of negative differential sam-ples, mean number of peaks, mean derivative of the inverse channel signal, average number of peaks in the inverse signal, statistics over each of the 8 signal channels provided by the Neurosky software EMO (72) Statistics concerning horizontal and vertical movement of 12 motion
2.3. ASCERTAIN OVERVIEW
Galvanic Skin Response (GSR):GSR measures transpiration rate of the skin.
When two electrodes are positioned on the middle and index finger phalanges
and a small current is sent through the body, resistance to current flow changes
with the skin transpiration rate. Most of the GSR information is contained in
low-frequency components, and the signal is recorded at 100 Hz sampling
fre-quency with a commercial bluetooth sensor. Following [86, 89, 149], we
ex-tracted 31 GSR features listed in Table 2.3.
Electroencephalography (EEG): EEG measures small changes in the skull’s
electrical field produced by neural activity, and information is encoded in the
EEG signal amplitude as well as in certain frequency components. We used a
commercial, single dry-electrode EEG sensor4, which records eight
informa-tion channels sampled at 32 Hz. The eight channels are respectively raw EEG,
attention and meditation level, alpha, beta, delta, gamma and theta components.
The recorded information includes frontal lobe activity, level of facial
activa-tion, eye-blink rate and strength, which are relevant emotional responses.
Electrocardiogram (ECG):Heart rate characteristics have been routinely used
for user-centered emotion recognition. We performed R-peak detection on the
ECG signal to compute users’ inter-beat intervals (IBI), heart rate (HR), and the
heart rate variability (HRV). We also extracted power spectral density (PSD) in
low frequency bands as in [86, 149].
Facial landmark trajectories (EMO): A facial feature tracker [80] was used
to compute displacements of 12 interest points or motion units (MU) in each
video frame. We calculated 6 statistical measures for each landmark to obtain a
total of 72 features (Table 2.3).
2.3.3 Data Quality
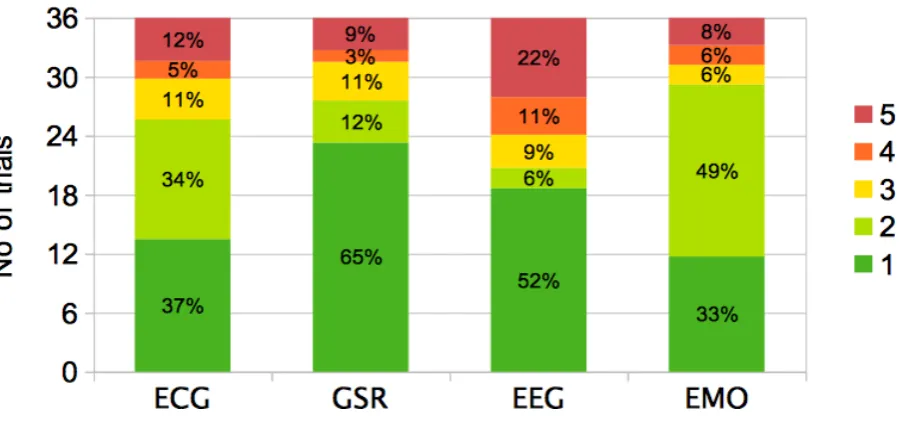
Figure 2.4: Bar plot showing proportion of trials for which data quality ranges from best (1) to worst (5).
A unique aspect of ASCERTAIN with respect to prior affective databases is
that physiological signals are recorded using commercial and minimally
inva-sive sensors that allow body movement of participants. However, it is well
known that body movements can degrade quality of the recorded data, and such
degradation may be difficult to detect using automated methods. Therefore, we
plotted the recorded data for each modality and trial, and rated the data quality
manually on a scale of 1 (good data)–5 (missing data). For ECG, we evaluated
the raw signal from each arm as well as the R-peak amplitudes. For GSR, we
examined the extent of data noise, and rated EEG (i) on the raw signal, (ii) by
summarizing the quality of δ (< 4 Hz), θ (4–7 Hz), α (8–15 Hz), β (16–31
Hz) and γ (> 31 Hz) frequency bands, and (iii) on the pre-calculated attention
andmeditationchannels available as part of the EEG data. Plots and tables with
explanations on data quality are available with the dataset. Figure 2.4 presents
an overview of the data quality for the four considered modalities, with the
2.4. DESCRIPTIVE STATISTICS
of the recorded data is good for all modalities except EEG, with the facial video
data being the cleanest. Maximum missing data is noted for EEG, reflecting the
sensitivity of the EEG device to head movements.
2.4
Descriptive Statistics
In this section, we present statistics relating to user self-reports and personality
scores.
2.4.1 Analysis of Self-ratings
As mentioned previously, we selected 36 movie clips such that their emotional
ratings were distributed uniformly over the AV plane as per ground-truth
rat-ings in [1], with 9 clips each corresponding to the HAHV (high arousal-high
valence), LAHV (low arousal-high valence), LALV (low arousal-low valence)
and HALV (high arousal-low valence) quadrants5. The targeted affective state
was mostly reached during the ASCERTAIN study as shown in Figure 2.3(a). A
t-test revealed significantly higher A ratings for HA as compared to LA stimuli
(t(34) =5.8889,p<0.0001). Similarly, V ratings for HV and LV clips were
significantly different (t(34) = 17.9621,p <0.0001). Overall, emotion
elici-tation was more consistent for valence as compared to arousal like also found
by prior works [1, 89]. Emotion elicitation was easier for the valence
dimen-sion than for the arousal one. This is due to the fact that it is hard to induce
strong emotional responses while keeping a low level of arousal. This effect is
visible from the C-shape the clip ratings form in the AV plane (Figure 2.3a)
be-ing consistent with previous studies [89]. In Figure 2.5 the ratbe-ing distributions
are separated for each quadrant. While HV and LV video ratings are clearly
separated, HA and LA have some overlap.
Figure 2.5: Boxplots of the mean Arousal, Valence, Engagement, Liking and Familiarity ratings for the different video sets.
We computed agreement among participants’ A,V ratings using the
Krip-pendorff’s alpha metric– mean agreement for A and V were respectively found
to be 0.11 and 0.61, implying more consensus for clip valence as for arousal.
We then computed the agreement between the ASCERTAIN population and the
DECAF [3] groundtruth using the Cohen’s Kappa measure. To this end, we
computed the agreement between ground-truth (GT) labels from [1] and each
user’s A,V labels assigned as high/low based on the mean rating– the mean
agreement over all users for A and V was found to be 0.22 and 0.72
respec-tively. Finally, we computed the agreement between GT and the ASCERTAIN
population based on the mean A,V rating of all users– here, an agreement of
0.89 was observed for A and perfect agreement (of 1) was noted for V. Overall,
these measures suggest that while individual-level differences exist in affective
perception of the movie clips, there is high agreement between overall
assess-ments of the ASCERTAIN and DECAF populations implying that the
consid-ered movie clips are effective for emotion elicitation.
Figure 2.5 presents box-plots describing the distribution of the arousal (A),
valence (V), engagement (E), liking (L) and familiarity (F) user ratings for
quadrant-based videos. Clearly, low-arousal videos are perceived as more
Fig-2.4. DESCRIPTIVE STATISTICS
ure 2.3(a). All videos are perceived as sufficiently engaging, while HV clips
are more liked than LV clips. Also, the presented movie clips were not very
conversant to participants, suggesting that the ASCERTAIN results are overall
unlikely to be modulated by familiarity biases.
2.4.2 Correlating Affective Ratings and Personality Scales
To examine relationships between the different user ratings, we computed
Pear-son correlations among self-reported attributes as shown in Table 2.4. Since
the analysis involves attribute ratings provided by 36 users for 36 clips, we
ac-counted for multiple comparisons by limiting the false discovery rate (FDR) to
within 5% using the procedure outlined in [16]. Highlighted numbers denote
correlations found to be significant over at least 9 users (25% of the population)
adopting the above methodology.
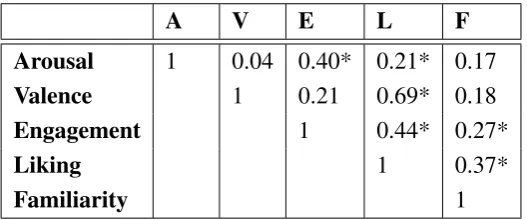
Focusing on significant correlations, A is moderately correlated with E and L
and there also exists a moderate correlation between E and L. Also, V is found
to correlate strongly with L mirroring the observations of Koelstra et al. [89].
Correlations between F and E, as well as between F and L confirm the mere
exposure effect observed in [20], which attributes liking to familiarity.
Nev-ertheless, different from [89] with music videos where a moderate correlation
is noted between A and V ratings, we notice that the A and V dimensions are
Table 2.4: Mean Pearson correlations between self-ratings across users. *s denote significant correlations (p<0.05) upon limiting FDR to 5%.
A V E L F
Arousal 1 0.04 0.40* 0.21* 0.17
Valence 1 0.21 0.69* 0.18
Engagement 1 0.44* 0.27*
Liking 1 0.37*
Table 2.5: Pearson correlations between personality dimensions (*⇒p<0.05)
E A Co ES O
Extraversion 1 0.49* 0.13 -0.02 0.45* Agreeableness 1 0.10 0.34* 0.35*
Conscientiousness 1 0.29 0.15
Emotional Stability 1 -0.07
Openness 1
uncorrelated for the ASCERTAIN study, which again reinforces the utility of
movie clips as good control stimuli. To validate our experimental design, we
tested for effects of video length on A,V ratings but did not find any.
Table 2.5 presents Pearson correlations between personality dimensions. Again
focusing on significant correlations, moderately strong and positive correlations
are noted between Extraversion (Ex) and Agreeableness (Ag), as well as
be-tween Ex and Openness (O)– prior studies have noted that Exand O are
corre-lated via the sensation seeking construct [6]. Agis also found to moderately and
positively correlate with Emotional Stability (ES) and O. Conversely, the least
correlations are observed between (i)Exand O, and (ii)ES andO.
Partial correlations between self-rated and personality attributes are
tabu-lated in Table 2.6. No significant correlation is noted between personality scales
and mean user emotional ratings acquired for all movie clips, but some
signifi-cant correlates are nevertheless observed when mean ratings for quadrant-wise
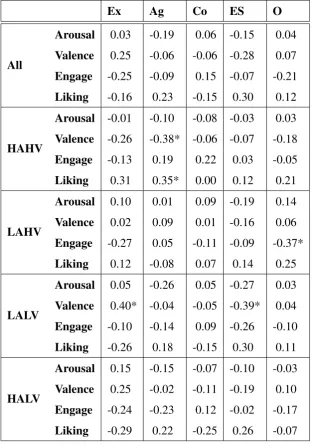
(or emotionally similar) videos are considered. Focusing on significant
cor-relates, Ag is positively correlated with L, but negatively with V ratings for
HAHV videos. Surprisingly, a negative correlation is noted between O and E
for LAHV clips. Consistent with prior studies [39], V is positively correlated
with Exin general, with a significant and moderately positive correlation noted
for LALV clips. Finally, a moderately negative correlation is observed between
mean Valence ratings and ES for LALV clips consistent with the observations
2.4. DESCRIPTIVE STATISTICS
Table 2.6: Partial correlations between personality scales and self-ratings (*⇒p<0.05).
Ex Ag Co ES O
All
Arousal 0.03 -0.19 0.06 -0.15 0.04 Valence 0.25 -0.06 -0.06 -0.28 0.07 Engage -0.25 -0.09 0.15 -0.07 -0.21 Liking -0.16 0.23 -0.15 0.30 0.12
HAHV
Arousal -0.01 -0.10 -0.08 -0.03 0.03 Valence -0.26 -0.38* -0.06 -0.07 -0.18 Engage -0.13 0.19 0.22 0.03 -0.05 Liking 0.31 0.35* 0.00 0.12 0.21
LAHV
Arousal 0.10 0.01 0.09 -0.19 0.14 Valence 0.02 0.09 0.01 -0.16 0.06 Engage -0.27 0.05 -0.11 -0.09 -0.37* Liking 0.12 -0.08 0.07 0.14 0.25
LALV
Arousal 0.05 -0.26 0.05 -0.27 0.03 Valence 0.40* -0.04 -0.05 -0.39* 0.04 Engage -0.10 -0.14 0.09 -0.26 -0.10 Liking -0.26 0.18 -0.15 0.30 0.11
HALV
Arousal 0.15 -0.15 -0.07 -0.10 -0.03 Valence 0.25 -0.02 -0.11 -0.19 0.10 Engage -0.24 -0.23 0.12 -0.02 -0.17 Liking -0.29 0.22 -0.25 0.26 -0.07
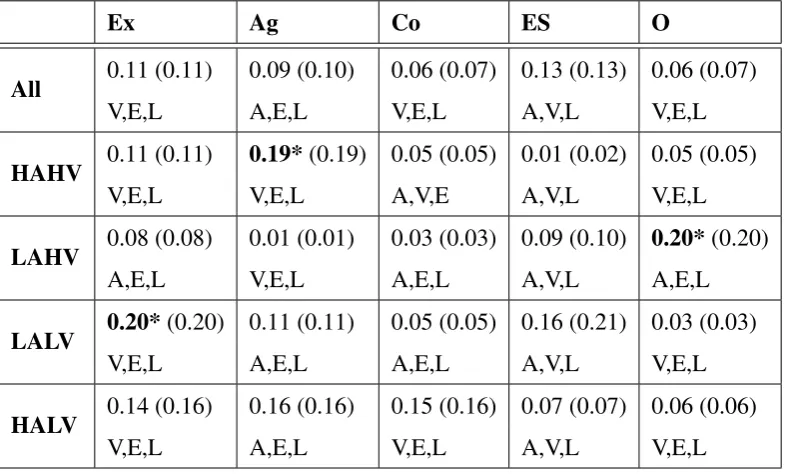
We also performed linear regression analyses with user self ratings as
predic-tors and personality attributes as the target variables for the different video sets,
and the coefficients of determination/squared correlations (R2) for the different
video sets are presented in Table 2.7. R2 values with the three best predictors
along with the predictor names are listed outside parentheses, while squared
Table 2.7: R2 and best three predictors for the five personality dimensions. Full model coeffi-cients are shown in parentheses. *⇒p<0.05.
Ex Ag Co ES O
All 0.11 (0.11) 0.09 (0.10) 0.06 (0.07) 0.13 (0.13) 0.06 (0.07)
V,E,L A,E,L V,E,L A,V,L V,E,L
HAHV 0.11 (0.11) 0.19*(0.19) 0.05 (0.05) 0.01 (0.02) 0.05 (0.05)
V,E,L V,E,L A,V,E A,V,L V,E,L
LAHV 0.08 (0.08) 0.01 (0.01) 0.03 (0.03) 0.09 (0.10) 0.20*(0.20)
A,E,L V,E,L A,E,L A,V,L A,E,L
LALV 0.20*(0.20) 0.11 (0.11) 0.05 (0.05) 0.16 (0.21) 0.03 (0.03)
V,E,L A,E,L A,E,L A,V,L V,E,L
HALV 0.14 (0.16) 0.16 (0.16) 0.15 (0.16) 0.07 (0.07) 0.06 (0.06)
V,E,L A,E,L V,E,L A,V,L V,E,L
the table that (i) there is little difference in the predictive power of the
best-three-predictor and full models, and (ii) the linear models have rather limited
predictive power, with the best models explaining only 20% of the personality
scale variance. Overall, Tables 2.6 and 2.7 cumulatively suggest that the
rela-tionship between emotional and personality variables is not well modeled using
linear statistics, and it is perhaps worthwhile to explore the use of non-linear
measures to this end. Also, given the significance of the relationship between
emotional (A,V) attributes and personality dimensions, and the high degree of
correlation between E,L and A,V ratings, we will only focus on arousal and
valence in the rest of the chapter.
2.4.3 Mutual Information Analysis
Mutual information (MI) is a popular metric to capture non-linear relationships
2.4. DESCRIPTIVE STATISTICS
about one variable given the other. Formally, the MI between two random
vec-tors X ={x} andY ={y}is defined as:
MI(X,Y) = ∑x,yPXY(x,y)logPPXY(x,y)
X(x).PY(y)where pXY(x,y) is the joint probability
distribution, while PX(x) and PY(y) are the respective marginal probabilities.
We attempted to describe the relationship between emotional ratings and
per-sonality scales via the normalized mutual information (NMI) index [158]
de-fined as: NMI(X,Y) = √MI(X,Y)
(H(X)H(Y)), whereH(X) andH(Y) denote entropies of
X andY.
Figure 2.6: NMI between big-five trait scales and A (left), V (right) ratings.
Computed NMI values with personality scales for arousal and valence
rat-ings are shown in Figure 2.6. In contrast to linear measures, both A and V share
a high degree of mutual information with all the five personality traits. While
considering all the movie clips, MI is generally higher for A as compared to V.
Among personality traits, Conscientiousness (Con) and Ex share the most MI
with affective attributes (note that in contrast, little correlation is observed
be-tween Con and A,V in Table 2.6), while lowest MI is noted for Openness. For
both A and V, higher MI with personality dimensions is noted when ratings for
quadrant-based videos are considered instead of all movie clips. One notable
for high V as compared to low V videos. In contrast, for all personality traits
barring Ag, greater MI with valence is observed for LV clips than for HV clips.
2.5
Personality measures vs user ratings
We now examine the relationship between user V,A ratings and personality
scales in the context of hypotheses (H1–H4) put forth in the literature. To this
end, we determinedhigh/lowtrait groups (e.g., emotional stable vs neurotic) for
each personality dimension by dichotomizing personality measures based on the
median score– this generated balancedhighandlowsets for three traits, with an
imbalanced split (19 vs 17) obtained for Conscientiousness and Openness. We
then proceeded to analyze the affective ratings for each group.
2.5. PERSONALITY MEASURES VS USER RATINGS
2.5.1 H1: Extraversion vs Arousal and Valence
The correlation between Extraversion and arousal has been investigated in many
studies – EEG measurements in [154], signal detection analysis in [70], and
fMRI [85] have shown lower arousal in extraverts as compared to introverts,
consistent with Eyesenck’s personality theory. Also, Extraversion has been
found to correlate with positive valence in a number of works [39].
Analyses presented in Table 2.6 reveal a very weak positive correlation
be-tween Exand A. While two-tailedt-tests showed that both extraverts and
intro-verts rated high A and low A videos differently (p<0.00001 in both cases), no
differences in A ratings could be identified between the two groups considering
either all or quadrant-based movie clips. Focusing on V ratings, a generally
positive correlation between Ex and V can be noted for all video sets with the
exception of HAHV clips. A significant positive correlation is however noted
only for negative (LALV) videos. Therefore, while statistical analyses do not
support the negative correlation between Ex and A, they weakly corroborate the
positive correlation betweenExand V.
2.5.2 H2: Neuroticism vs Arousal
The relationship between Neu and A has been extensively studied and
com-mented on– a positive correlation betweenNeuand A is revealed through fMRI
responses [85], and EEG analysis [154] reinforces this observation especially
for negative valence stimuli. [127] further remarks that neurotics experience
negative emotions stronger than emotionally stable persons.
A ratings provided by the neurotic and ES groups were found to be
sig-nificantly different for low-arousal clips as confirmed by a left-tailed t-test
(t(34) = −1.9555,p = 0.0294). Quadrant-wise distributions of A ratings for
theESand neurotic groups are presented in Figure 2.7 (left). Neurotics are
Left-tailedt-tests confirmed that neurotics provided significantly higher A ratings for
LALV (t(16) =−1.7606,p =0.0487) clips, and marginally higher A ratings
for LAHV (t(16) =−1.7349,p=0.0510) and HAHV (t(16) = −1.5410,p =
0.0714) stimuli. In general, our analyses support the observation that
Neuroti-cism is associated with higher A, with the effect being more pronounced for LA
videos.
2.5.3 H3: Neuroticism vs Valence
Differing observations have been made regarding the relationship between Neu
and V. A negative correlation between Neu and positive valence is observed
in [85], while a positive relationship between the two for low arousal stimuli is
noted in [163]. [127] remarks that theNeu-V relation is moderated by situation–
while neurotics may feel less positive in unpleasant situations, they experience
positive emotions as strongly asES subjects in pleasant conditions.
Comparing V ratings of the neurotic and ES groups, very similar V ratings
are noted for high/low V clips. Quadrant-wise comparisons also failed to reveal
any differences. Overall, no definitive relationship was noted between between
Neuand V.
2.5.4 H4: Openness vs Valence and Arousal
Among the few works to study Openness, [163] notes a positive correlation
be-tween Openness and valence under low arousal conditions, which is attributed
to the intelligence and sensitivity of creative individuals6, enabling them to
bet-ter appreciate subtly emotional stimuli. Right-tailedt-tests to compare V ratings
of the openand closed groups failed to reveal any differences. Quadrant-based
comparisons showed that open individuals experienced slightly higher V for
LAHV clips (t(16) =1.3737,p=0.0942).
2.6. PHYSIOLOGICAL CORRELATES OF EMOTION AND PERSONALITY
No significant difference was noted in the A ratings of openandclosed
sub-jects for HA and LA videos. For fine-grained analysis, we again used left-tailed
t-tests considering quadrant-wise ratings, which revealed that closed
individu-als experienced slightly higher arousal for HALV clips (t(16) =−1.3499,p=
0.0979). In summary, we observed a slightly positive relationship between
Openness and A,V as noted in [163].
2.5.5 Agreeableness and Conscientiousness
Quadrant-wise comparison of A ratings by agreeable and disagreeable groups
(Figure 2.7(b)) revealed that disagreeablesubjects felt more aroused by HALV
(t(16) =−2.0811,p=0.0269) and by LALV (t(16) =−1.8003,p=0.0453)
clips. The fact that disagreeable persons felt more aroused by low-valence clips
could possibly be attributed to their association with negative feelings such as
deceit and suspicion.
Conscientiousness scale differences did not significantly influence the VA
ratings in any manner.
2.6
Physiological correlates of emotion and personality
From the previous section, we note that the impact of personality differences
on the emotion perceived by users is revealed mainly through quadrant-wise
comparisons of V and A ratings involving emotionally similar or homogeneous
clips. If explicit ratings provided by users are a conscious reflection of their
emotional perception, then the analyses employing physiological signals should
also reveal similar patterns. We attempt to identify linear and non-linear
physi-ological correlates of emotion and personality considering responses to alland